샘플프로젝트 : GA(Google Analytics) 데이터 활용 유저 분석
시나리오 요약
: 웹사이트 방문자 수의 변동에 대한 원인을 GA 데이터를 통해 파악하고자 한다
- 데이터 살펴보기
| Column | Description |
|---|---|
| channelGrouping | 채널 그룹핑 |
| date | 날짜 |
| device | 기기 정보 |
| fullVisitorId | 방문자 전체ID |
| geoNetwork | 지리적 네트워크 정보 |
| sessionId | 세션 ID |
| socialEngagementType | 소셜 참여 유형 |
| totals | 총계 |
| trafficSource | 트래픽 소스 |
| visitId | 방문 ID |
| visitNumber | 방문 횟수 |
| visitStartTime | 방문 시작 시간 |
Process 01 Data Info. check
- Data 전처리 : Data shape, Data type, Null, Outlier 확인
- Data EDA : 수집된 데이터의 기본 정보들을 확인
df['totals'] = df['totals'].astype(float)
df['date'] = pd.to_datetime (df['date'], format='%Y%m%d')
Process 02 주요 지표 추출
- 월 별 MAU
df_mau = pd.DataFrame (df.groupby (df['date'].dt.strftime('%Y%m'))['fullVisitorId'].nunique())- 월 별 Transaction
df_t = pd.DataFrame (df.groupby(df['date'].dt.strftime('%Y%m'))['totals'].sum())- 월 별 Conversion rate
df_cov = pd.DataFrame (df.groupby(df['date'].dt.strftime('%Y%m'))[['sessionId', 'totals']].agg(['count'])).reset_index()
df_cov.columns = ['Date', 'Visit', 'Revenue']
df_cov['cov_rate'] = round ( (df_cov['Revenue'] / df_cov['Visit']) *100, 2)
Process 03 Profit 분석
- Device 별 분석
import plotly.graph_objects as go
go.Bar (x=df_device_category ['totals'], y=df_device_category['device'], orientation='h')
go.Bar (x=df_device_browser ['totals'], y=df_device_browser['device_browser'], orientation='h')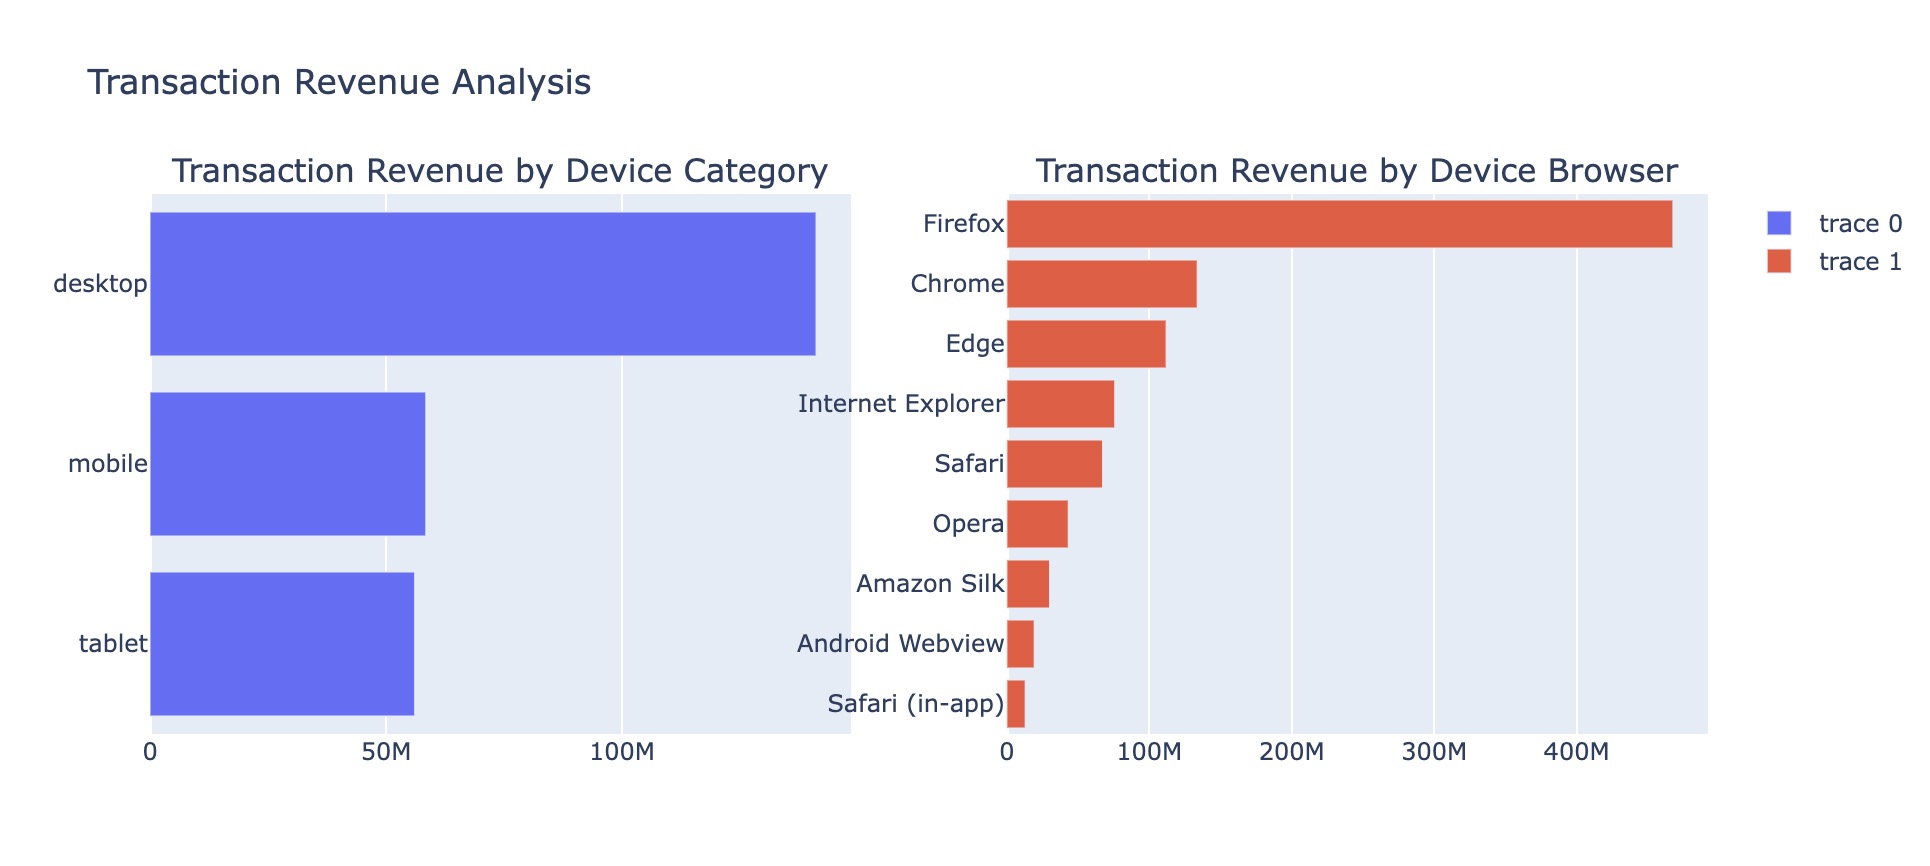
- GeoNetwork 별 분석
go.Bar (x=df_geoNetwork_continent['totals'], y=df_geoNetwork_continent['geoNetwork'], orientation='h')
# same for the sub-continent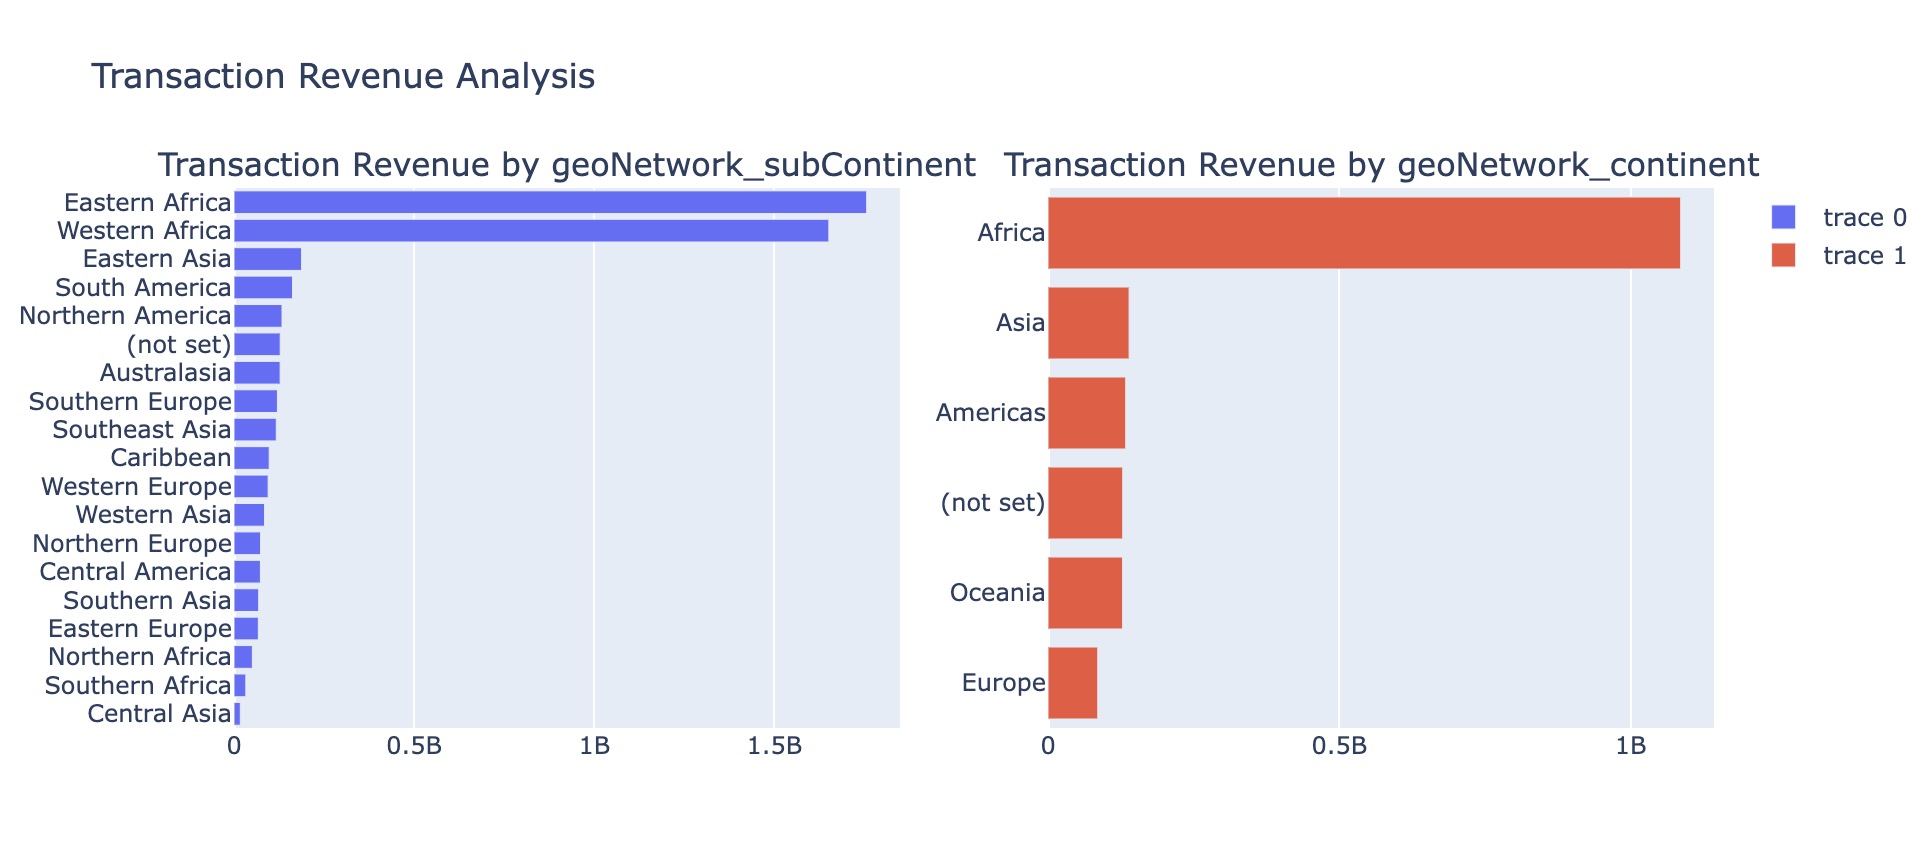
이 글은 제로베이스 데이터 분석 취업 스쿨의 강의 자료 일부를 발췌하여 작성되었습니다.

I like to movie movie