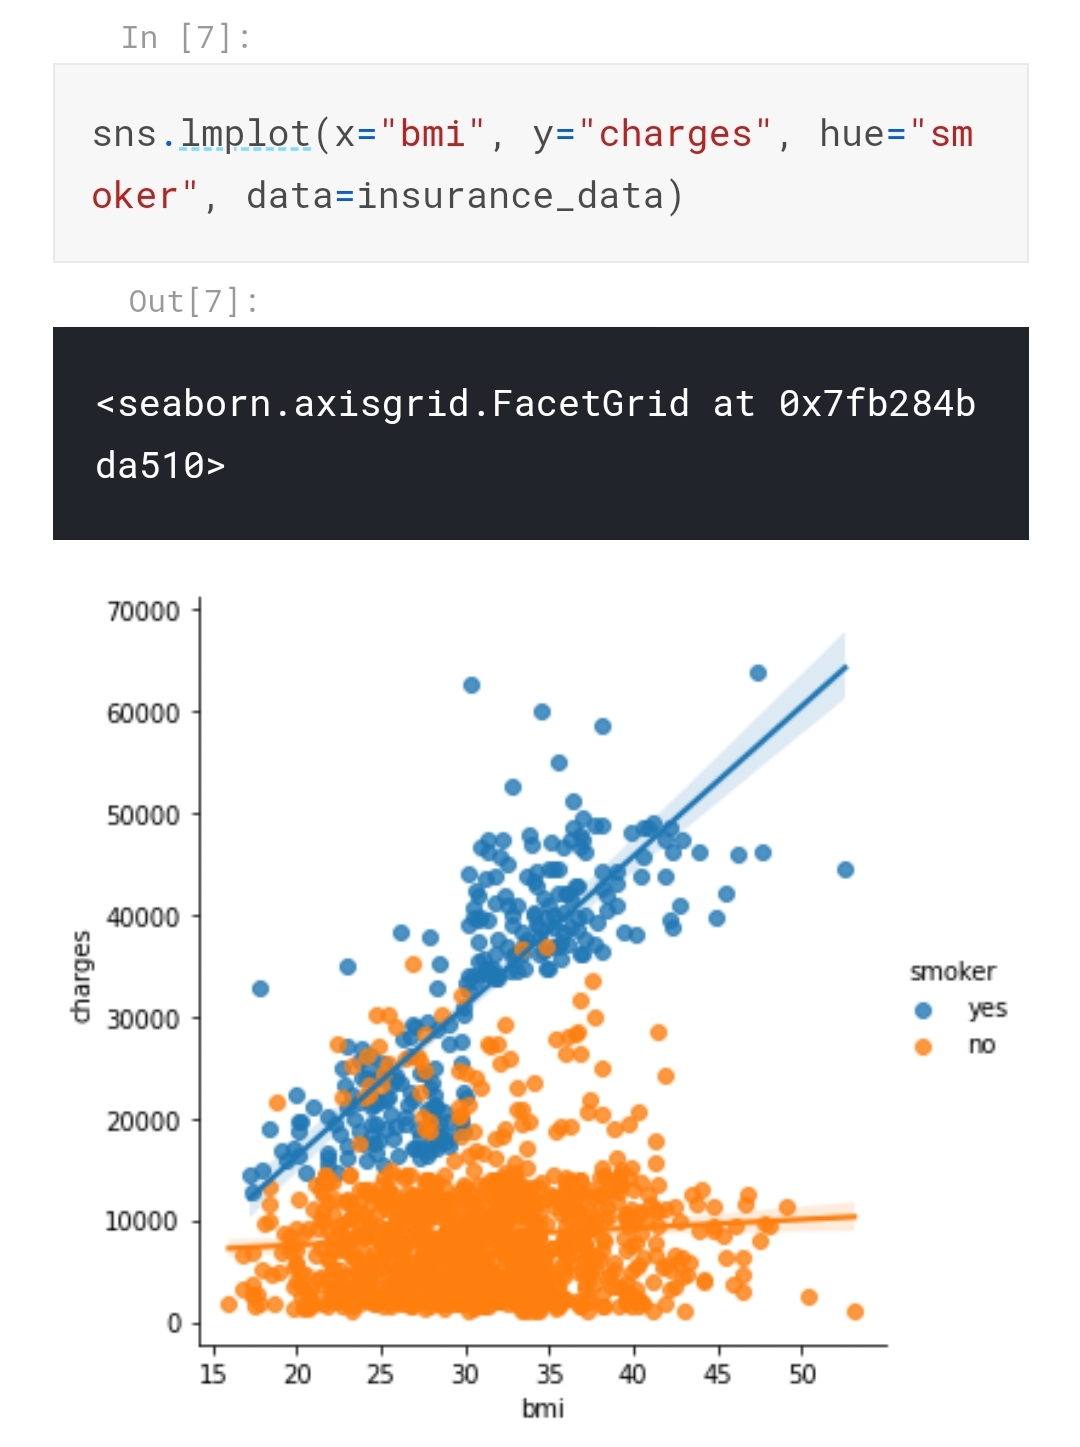
sns.lmplot(x="bmi", y="charges", hue="smoker", data=insurance_data)To further emphasize this fact, we can use the sns.lmplot command to add two regression lines, corresponding to smokers and nonsmokers. (You'll notice that the regression line for smokers has a much steeper slope, relative to the line for nonsmokers!)
reference

hello wirld