ROC Curve와 AUC (분류 임계값과 성능의 관계)
정확도, 정밀도, 재현율... 숫자 하나로만 모델을 평가하기엔 부족할 때가 있다.
모델이 얼마나 엄걱하게(Threshold) 판정하느냐에 따라 성능이 달라지기 때문.
1. ROC Curve (Receiver Operating Characteristic Curve)
- 모든 가능한 분류 임계값(Threshold)에 대해 모델의 성능을 시각화한 그래프
X축과 Y축의 의미
ROC 곡선은 "맞춘 것(이득)"과 "틀린 것(비용)"의 트레이드오프(Trade-off)를 보여준다
-
Y축: TPR (True Positive Rate) 재현율(Recall)
실제 양성(Positive)인 사람들 중 모델이 "양성입니다!"라고 맞게 찾은 비율.
Ex) 실제 암 환자를 암이라고 진단한 비율 (높을수록 좋음) -
X축: FPR (False Positive Rate)
실제 음성(Negative)인 사람들 중 모델이 "양성입니다.."라고 틀리게 경고한 비율.
Ex) 정상인을 암이라고 오진한 비율 (낮을수록 좋음)
좋은 모델은 암 환자는 다 찾으면서(TPR ), 정상인에게는 오진을 안 하는(FPR ) 모델이다. 따라서 그래프가 좌상단(0, 1) 에 붙을수록 좋다.
2. 임계값(Threshold)의 변화
모델은 내부적으로 확률(0.1 ~ 0.9)을 계산하고, 특성 기준(Threshold, 보통 0.5)를 넘으면 1, 아니면 0으로 분류한다.
-
임계값을 낮추면 (0.5 0.1): "의심되면 무조건 암이라고 해!"
암 환자를 거의 다 찾아냄. (TPR 증가 👍)
하지만 멀쩡한 사람도 암이라고 오진. (FPR 증가 👎) -
임계값을 높이면 (0.5 0.9): "확실할 때만 암이라고 해!"
오진이 거의 없다. (FPR 감소 👍)
하지만 초기 암 환자를 놓칠 수 있습니다. (TPR 감소 👎)
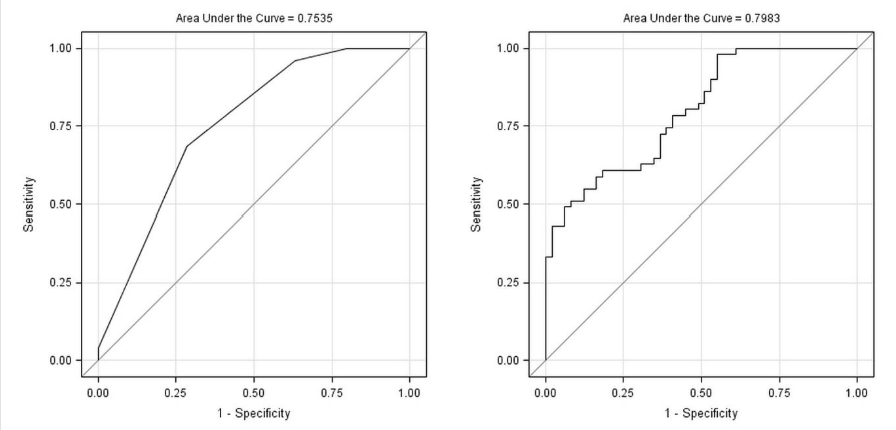
ROC Curve는 이 모든 임계값에서의 점들을 이은 선.
3. AUC (Area Under the Curve)
- ROC 곡선 아래의 면적
곡선만으로는 어떤 모델이 더 좋은지 숫자로 비교하기 어렵기 때문에 사용
AUC = 1.0: 완벽한 모델 (FPR=0일 때 TPR=1)
AUC = 0.5: 완전 랜덤 모델 (동전 던지기 수준, 그래프의 대각선)
해석: 일반적으로 0.8 이상이면 훌륭한 모델로 평가.
ROC Curve 그리기
Scikit-learn의
roc_curve와auc함수를 사용.
주의할 점:roc_curve함수에는 최종 예측값(0, 1)이 아니라 예측 확률(predict_proba)을 넣어야 매끄러운 곡선이 그려진다.
1) 데이터 준비 및 학습
import pandas as pd
import numpy as np
import matplotlib.pyplot as plt
from sklearn.model_selection import train_test_split
from sklearn.linear_model import LogisticRegression
from sklearn.metrics import roc_curve, auc

# 데이터 로드 (Pima Indians Diabetes 예제 가정)
df = pd.read_csv('data/pima-indians-diabetes.data.csv')
x_data = df.iloc[:, :-1].values
y_data = df.iloc[:, -1].values

# 데이터 분할
x_train, x_test, y_train, y_test = train_test_split(x_data, y_data, test_size=0.3, stratify=y_data, random_state=42)

# 모델 학습
model = LogisticRegression(max_iter=500)
model.fit(x_train, y_train)
2) 확률값 예측 및 ROC 계산
# 중요: predict()가 아니라 predict_proba()를 사용!
# [:, 1]은 레이블이 1(양성)일 확률만 가져온다는 뜻
pred_proba = model.predict_proba(x_test)[:, 1]

# roc_curve(실제값, 예측확률값)
# 반환값: fpr, tpr, 임계값들
fpr, tpr, thresholds = roc_curve(y_test, pred_proba)

# AUC 계산
auc_val = auc(fpr, tpr)
print(f"AUC Score: {auc_val:.4f}")

# AUC Score: 0.8375
3) 시각화 (Plotting)
plt.figure(figsize=(6, 6))

# ROC Curve 그리기
plt.plot(fpr, tpr, color='blue', lw=2, label=f'ROC curve (AUC = {auc_val:.2f})')

# 기준선 그리기 (Random Classifier, AUC=0.5)
plt.plot([0, 1], [0, 1], color='gray', linestyle='--', label='Random')

plt.xlim([0.0, 1.0])
plt.ylim([0.0, 1.05])
plt.xlabel('False Positive Rate (FPR)')
plt.ylabel('True Positive Rate (TPR)')
plt.title('Receiver Operating Characteristic (ROC)')
plt.legend(loc="lower right")
plt.grid(True)
plt.show()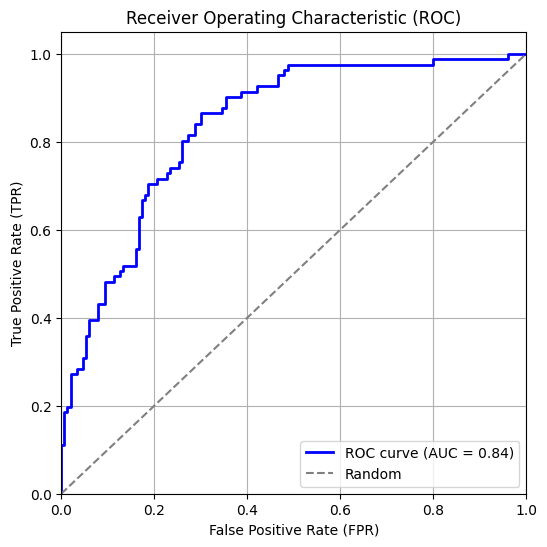
요약
- ROC Curve: 모델의 임계값(Threshold)을 조절할 때 TPR(재현율)과 FPR(오탐률)이 어떻게 변하는지 보여준다.
- 이상적인 형태: 그래프가 왼쪽 위(0, 1)에 붙을수록 좋은 모델이다. (많이 맞추고, 오진은 적고)
- AUC: 곡선 아래 면적값. 1에 가까울수록 성능이 뛰어나다는 뜻이다. (0.5는 찍기 수준)
- Tip: 코드로 구현할 때는 predict() 대신 predict_proba()의 양성 확률값을 사용해야 정확한 곡선을 얻을 수 있다.