Seaborn
Matplotlib을 기반으로 고급화된 시각화 기능을 제공하는 패키지
실습 사이트 https://www.kaggle.com/learn/data-visualization

Setup
실습에 필요한 라이브러리 import and configure
import pandas as pd
pd.plotting.register_matplotlib_converters()
import matplotlib.pyplot as plt
%matplotlib inline
import seaborn as sns
print("Setup Complete")
Load the data
# Path of the file to read
fifa_filepath = "../input/fifa.csv"

# Read the file into a variable fifa_data
fifa_data = pd.read_csv(fifa_filepath, index_col="Date", parse_dates=True)
파일을 불러올 때, 날짜를 인덱스로 설정
- data = pd.read_csv(경로, index_col="컬럼명", parse_dates=True)
#parse_dates=True -> 인덱스 데이터 타입을 자동으로 datetime(날짜 형태)으로 설정
Examine the data
# Print the first 5 rows of the data
fifa_data.head()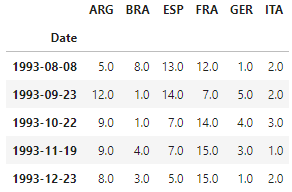
Plot the data
# Set the width and height of the figure
plt.figure(figsize=(16,6))

# Line chart showing how FIFA rankings evolved over time
sns.lineplot(data=fifa_data)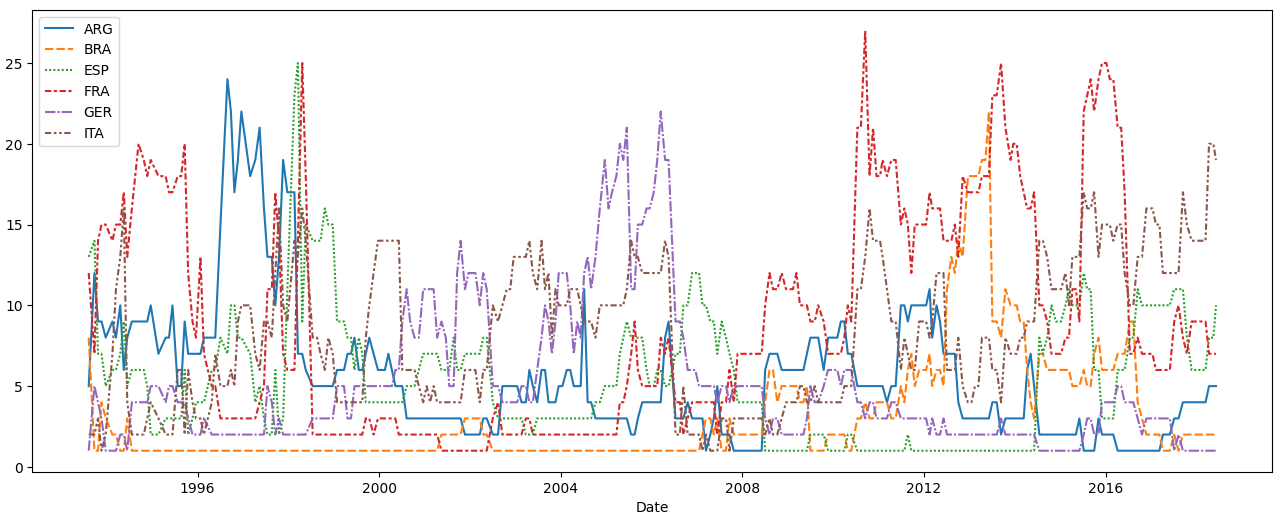
- plt.figure(figsize=(가로, 세로)) #사이즈 지정
- sns.lineplot(data=dataframe) #데이터로 라인 차트 그리기

Let's take the lead