Outlier(이상치)란 무엇인가?
Outlier(이상치)는 일반적으로 데이터에 있는 나머지 객체(데이터 포인트)들과 상당히 동떨어진-비슷하지않은 객체들을 말한다. ( ex. Michael Jordan, Messi, Faker, etc. )
문제는 Outlier들을 어떻게 Define하고 find할 것이냐는 거다.
- Types of Objects : Normal / Outlier / Outlier belonging to micro-cluster / fringe(border)
대충 일반적인 객체 (Normal Object) / 이상치 (Outlier) / 이상치인데 소규모 집단에 속하는, 그냥 이상치로 분류하기는 아쉬운 객체 (Outlier belonging to a micro-cluster) / 이상치랑 구분 잘 해야하는 경계에 있는 객체 (Fringe Object) 이렇게 보면 될 듯하다.
일반적으로 object location feature, 전체 데이터셋의 분포에서 각 객체의 상대적인 성질을 반영하는 것, 을 이용해서 이상치를 감지해낸다.
공통의 프로세스는 아래와 같다고 한다.
- Compute location feature
- Outlierness score based on location features calculated
- Consider top-m as outliers.
Statistics-based outlier detection
- 특정 data distribution이 있다고 가정하고, 그 distribution의 mean과 variance 같은 parameter와 예상되는 이상치의 수에 따라서 outlier를 처리하는 방식이다. (distribution / distribution parameter / # of expected outliers)
단점 : data distribution이 알려지지 않았을 수도 있으며, computing cost가 너무 크다.
Distance-based outlier detection
- 다른 object들에 대한 distance가 특정 threshold를 넘으면 outlier로 본다.
- DB-outlier : 어떠한 Data point의 거리 안에 개 이하의 point가 있으면 해당 Data point를 outlier로 본다.
단점 : Local Density problem; data가 uniform하게 distribute하지 않은 경우, 적절한 과 를 정하는 것이 매우 어렵다.
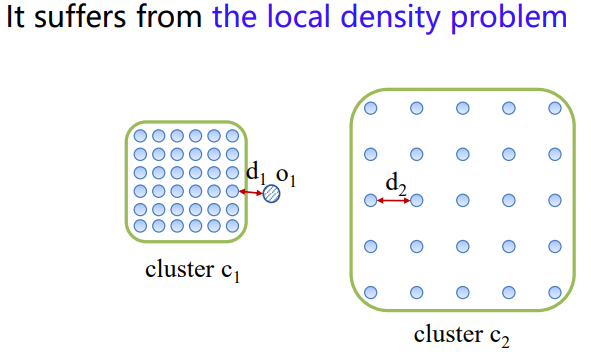
cluster 를 감지하기 위해 을 보다 크게 잡으면, 이 cluster 에 포함된다는 문제가
을 outlier로 만들기 위해 을 보다 작게 잡으면, cluster 가 detect되지 않는다는 문제가 있다.
Density-based outlier detection
- 위의 문제를 해결하기 위해서, density-based를 도입한다?
RWR-based / graph-based
- 그러나 outlier와 fringe object를 구분하지 못한다는 문제가 있다.
Solution : Centrality and Center-Proximity
Outiler Detection에는 크게 3가지 중요한 목표가 있다.
Objective
- Outlier를 정확하게 감지해야한다 - local density / micro-cluster / fringe object problem를 해결
- 사용자에게 outlierness score 및 insight(threshold 등에 대한)를 제공해야한다.
2-1. 사용자가 outlier의 숫자를 직관적으로 결정할 수 있다.
2-2. 사용자가 parameter value setting에 대한 hint를 얻을 수 있다. - 어떤 type/form의 데이터라도 handling할 수 있어야한다.
Strategy
따라서 그에 따른 strategy는 다음과 같은데
- 모든 종류의 object의 성질을 고려할 수 있는 2개의 novel locaiton feature을 정의한다.
(local density / micro-cluster / fringe object problem) - 주어진 데이터로 Intergrated Graph를 만들고, 그것을 global하게 분석하여 outlierness score를 계산한다.
(outlierness score & input date types contrains relax)
1번에서 언급한 2개의 novel lcoation features가 Centrality와 Center-Proximity이며,
2번에서 언급한 Intergrated Graph는 모든 데이터의 similarity를 계산할 수 있다는 사실을 이용해서 만들어 낸다.
Procedures
자세환 과정을 살펴보자면,
- weighted k-NN graph를 model한다.
1-1. directed edge로 개의 nearest object를 connect
1-2. 당연히 모든 object의 out-degree는 같지만, in-degree는 다르다.
1-3. Weight는 Euclidean similarity와 Cosine similarity가 있는데, Euclidean distance에 min-max scale을 적용하고 그것을 1에서 뺀 유사도이다.
- Centrality와 Center-proximity score를 계산하여 Outlierness score를 부여한다.
- Outlierness score가 높은 Top M의 object를 outlier로 감지한다.
Centrality and Center-Proximity
Motivations : cluster의 center에 가까울 수록 1) 더 많은 neighbors, 2) 더 짧은 neighbors와의 거리를 갖고 있을 것이다. 때문에 centrality라는 이름이 붙은 것이다.
Centrality : 1) 자신을 neighbor로 여기는 object의 수가 많고, 2) 그들과의 distance가 작고, 3) 그들의 center-proximity가 클수록 커지는 (어찌보면 당연한) 값이다.
Center-Proximity : 반대로 1) 자신이 neighbor로 여기는 object의 수가 많고, 2) 그들과의 distance가 작고, 3) 그들의 centerality가 클수록 커지는 값이다.
계산되는 예시를 보면, 바로 이해가 될 것이다.
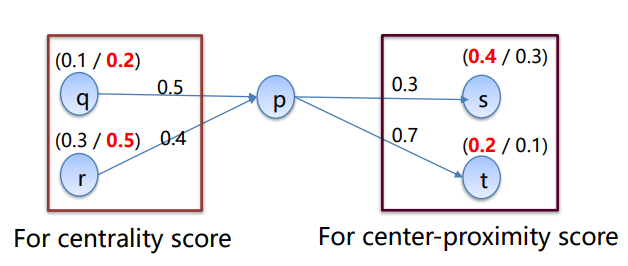
p의 centrality score :
p의 center-proximity score :
글로는 어려워 보였지만, 그림과 예시로 보면 그리 어렵지 않다.
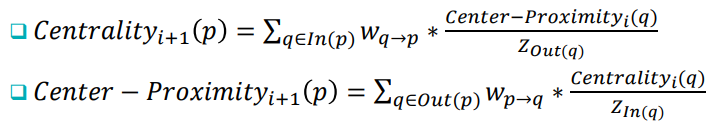
수식도 조금 어려워 보일 수 있지만, 분모의 위치만 살짝 바꾼다면, 그냥 weight의 비율 * center-proximity/centrality에 만 붙인 모양임을 알 수 있다.
Properties
- Mutual Reinforcement Relationship : 상호보완적인 것은 당연한 것이고
- proportion to weights 만큼 neighboring objects에게 영향력을 갖고 있다.
Number of iterations
1 / diameter of graph / Until converge, 이 3가지가 있는데 권장되는 것은 당연히 converge할 때까지 반복하는 것이다. (diameter of graph : grpah에서 가장 긴 path)
Outlierness Score
center-proximity score에 역수를 취해서 outlier가 가장 큰 값을 갖도록 하는데, centrality는 fringe object와 outlier 둘 다 낮은 값이 나오는 문제가 있지만, fringe가 center에 더 가깝기에 center-proximity를 활용하는 것이고 top-M개의 outlier를 잘라낼 것이기에 역수를 취하는 것이다.
Compared with RWR
얼마나 많은 object들이 해당 object를 point하고 있는지, 얼마나 많은 object가 주변에 있는지를 고려하기 때문에 Centrality Score와 비슷하게 똑같이 fringe와 outlier를 구별하지 못한다는 문제가 있다.
Summary
- Outlier Detection : 다른 애들과 동떨어진, 그래서 outlierness score가 높은 애들을 찾아내는 것
- Category : Statistics, Distance, Density, RWR based 등이 있었지만 각각 문제가 있다.
- Centrality & Center-Proximity : 3가지 문제를 다 해결한!