
Recommender systems
Netflix prize부터 각광을 받기 시작한 Recommender systems.
쿠팡, 아마존 같은 쇼핑사이트부터, 유튜브나 넷플릭스 같은 스트리밍 서비스를 제공하는 사이트들까지. 우리의 취향을 파헤치는 이 친구를 알아보자.
Category of Recommendation Algorithms
- User profile (info)
- Content-based
- Collaborative filtering : user-item interactions
Q. 왜 Collaborative filtering이 더 유명할까?
A. 왜냐하면 Content-based와는 달리 domain-agnostic, 즉 도메인 지식을 요구하지 않기 때문이다!
Background
Types of user-item matrix data
- Explicit feedback : rating이나 좋아요, 싫어요 와 같이 확실히 선호도가 반영된 피드백
- Implicit feedback : 클릭이나 구매같은 겉으로(명시적으로) 선호도가 드러나지 않은 피드백
How to evaluate?
- Rating : RMSE
- Classification : precision, recall, F1-score
- Ranking perspective : NDCG, MRR와 같이 매긴 추천의 순서(랭킹) 또한 신경쓰는 것이다.
Content-Based Approach
User의 Profile과 "similar"한 profile을 Recommend하는 방식이다
- Contents : characteristics of an item - different for domain.
ex) genre, actor, director in movie, etc ... - Profile : target user의 history에 포함된 item contents 들의 요약된 version.
그렇다면 어떻게 "similar"한 정도를 계산할 수 있을까?
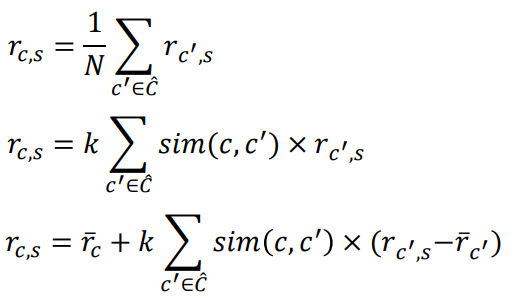
라고 하는데, 이것을 해석해보자면
아이템 s의 target user c에 대한 usefulness weight는
user c의 선호를 포함한 Item contents 와
item s의 contents 를 인자로 받아
similarity score를 계산한 값이라는 뜻이다.
포인트는 그냥 w의 개수인 k의 값이 서로 같아야한다는 것이다.
- Similarity Funciton : Cosine similarity, Pearson Correlation, ect.
Collaborative Filtering (CF), KNN-based
k-NN에 의해 highly rate된 items들을 추천하는 형식
- Find k-NN whose preferences are similar to target user c
1-1. Calculate Similarity between users (pearson correlation coeffcient / Cosine Simliarity)
1-2. Select k neighbors : k is empirically chosen. 경험적으로. 그래서 KNN-based method를 Heuristic-based, memory-based, similarity-based라고도 부른다. - Rating prediction : 1) 단순 평균, 2) 가중 평균, 3) target user c의 평균을 고려한 가중 평균
Latent Factor Models
방금전까지 배운 KNN-based는 말했다시피 heuristic-based라고 불리우는, 사람에 의해서, 경험에 의해서 만들어진 function들이다. 그러나 이러한 방식들은 데이터가 커지면 커질 수록 허점이 들어나거나 실수가 발생하기 마련이기에, Model-based methods가 현재는 대부분 활용되고 있다.
- Linear models : matrix factorization, SVD, ...
- Non-Linear models : Autoencoder, DNN, ...
위 두가지로 나뉘는데, 이 post에서는 Linear model 중에서 matrix factorization에 대해서 다뤄볼 것이다.
Latent Factor?
그래서 Latent Factor은 무엇일까?
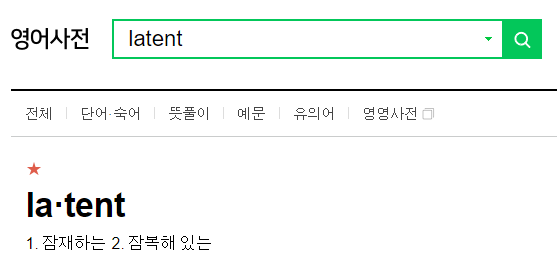
항상 모르는 단어는 검색하는게 최고다.
겉으로 보이는 explicit한 factor들(ex. genre, actor, director, company, ...)과는 달리 말그대로 잠재되어있는 성질들(ex. Serious vs Funny, Male target vs Female target, ...)을 말하는데, 정의를 그대로 적어보자면
A feature that describe aharacteristics of users and items hidden in data
이다.
이게 왜 중요하냐면, "Rating은 user의 latent factor와 item의 latent factor 사이의 interaction의 결과물이다"라는 Assumption을 깔고 가기 때문이다.
어찌 생각해보면 당연한 내용인 것 같다. content들에는 수많은 factor들이 내재되어있을 것이고 우리는 그 수많은 factor들을 다 일일이 의식적으로 고려하지는 않지만, 수많은 latent factor들이 나의 latent factor들과 잘 맞으면 높은 rating을 주기 때문이다.
어찌되었건, 앞에서 말한 그 "interaction" 혹은 "잘 맞는다"의 관계가 linear인가 non-linear인가에 따라서 종류가 나눠지는 것 같다.
또한 우리는 latent matrices에서 각 factor가 정확히 어떠한 explicit meaning을 가지고 있는지 알지 못하지만, 분명히 "some meaning"이 들어있기는 하다.
user의 latent matrix의 값은 user가 해당 factor을 얼마나 "care about"하냐는 것이고
item의 latent matrix의 값은 item이 해당 factor을 얼마나 "satisfy"하냐는 것이다.
Approach
그래서 이 method는 latent factor 와 를 "Learn"하려고 한다.
한마디로 하나의 sparse한 Rating Matrix를 2개의 dense한 "thin matrices"로 factorization하는 과정이다.
Objective Function은 인데, 수식으로 쓰니까 보기가 어렵다.
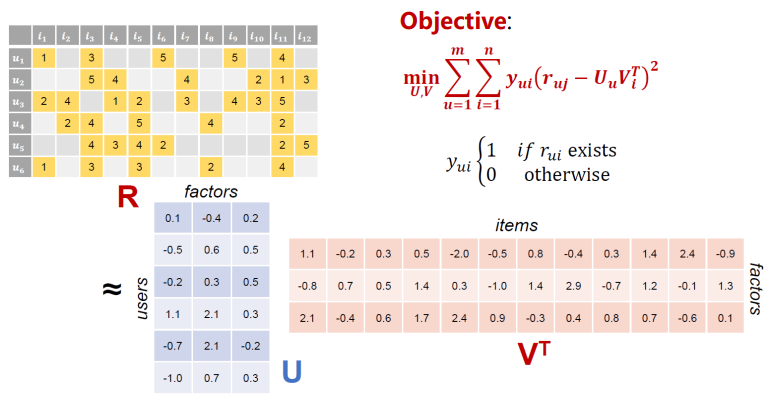
그림으로 보니까 너무 편하다. 다시 한 번 말하자면, Sparse한 Rating Matrix 을 2개의 Thin하고 Dense한 matrices 와 로 factorization하는 것이다.
Objective Function은 그냥 간단하게 실제 값 와 근삿값인 user factors와 item factors의 내적 의 차를 제곱한 값을 가 있을 때만 최소화 시킨다는 것이다.
그런데... 실제로는 비어있지 않은 r값들에 대해서만 너무 overfit되려는 경항이 있기 때문에 regularization term을 붙여 지나친 overfit을 방지한다.
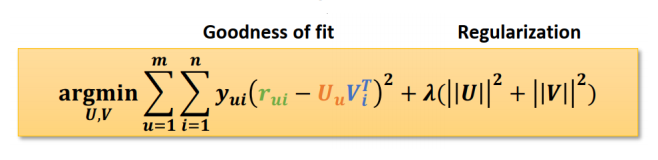
Goodness of fit은 prediction error를 줄이고, Regularization은 overfitting 문제를 줄이기 위해 사용된다!
2 Ways to Train(Optimization)
만약 cost function이 굉장히 simple한 2차 함수라면, 우리는 direct하게 optimal한 point를 찾을 수 있다. 어떻게? 그냥 Objective function의 derivative가 0이되는 지점을 찾으면 된다.
그러나 만약 cost function이 복잡한 상황이라면, 위의 방법으로는 해결할 수 없다.
그리고 대부분의 경우에서 cost function은 단순하지 않다.
때문에
Gradient Descent (stochastic)
- Choose initial point randomly
- 각 parameter에 대해서 partial derivative를 통해 현 지점의 gradient를 compute한다.
- 해당 gradient에 step size를 곱한 값을 빼주어 각 parameter를 업데이트하고 step 2로 다시 돌아간다. Until convergence!
다만 이 방법의 문제점은 entire data point에 대해서 gradient를 다 계산한다는 것이고 이것은 too expensive, too long time의 문제가 있다.
따라서, 위 과정을 딱 one data instance에 대해서 시행하는 Stochastic Gradient Descent를 사용한다.
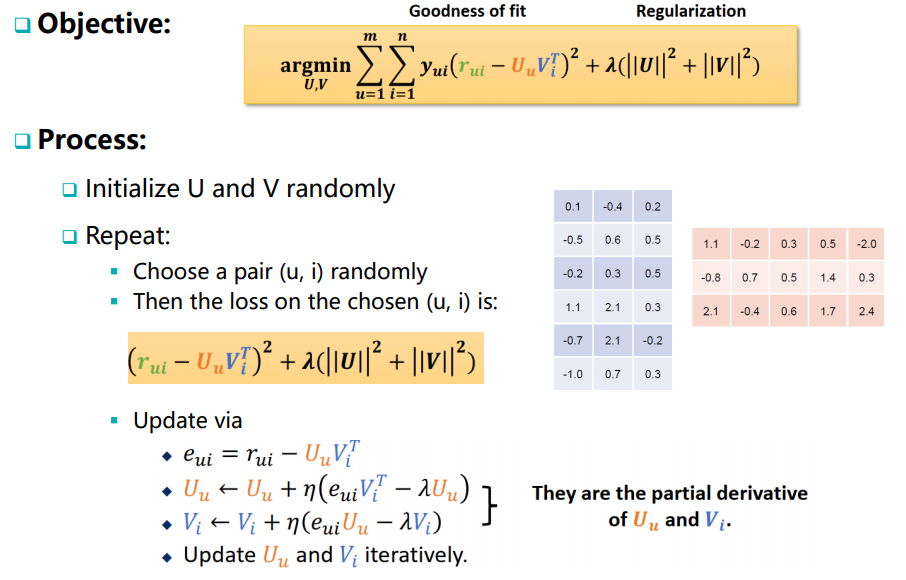
Objective Function은 동일하며, 위에서 언급한 process 그대로,
1. Randomly initialize하고,
2. 하나의 pair (u,i)를 random하게 골라서
3. 주어진 objective function에 대해 loss를 계산하여
4. partial derivative를 통해 Update를 하고 2번으로 돌아간다. Until Covergence.
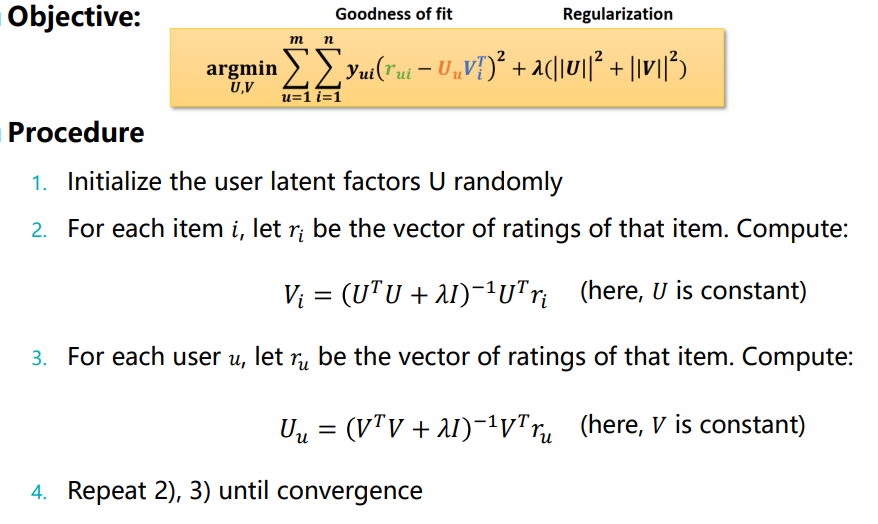
Alternating Least Sqaures
편미분을 통해 gradient를 계산해 업데이트를 하려니 열이 받는다?
나머지 parameter를 상수로 만들어버리면 변수가 하나밖에 없으니 그냥 Least Sqaure를 하면된다!
물론 딱봐도 문제가 많아보이니, 위 과정을 모든 parameter에 대해, Converge할 때까지 반복하면 된다.....
Recommender System, 별거 없네?
Non-linear에서 Autoencoder와 다양한 딥러닝들이 여러분을 기다리고 있습니다 ^o^