이 글은 CloudNet@팀의 AWS EKS Workshop Study(AEWS) 3기 스터디 내용을 바탕으로 작성되었습니다.
AEWS는 CloudNet@의 '가시다'님께서 진행하는 스터디로, EKS를 학습하는 과정입니다.
EKS를 깊이 있게 이해할 기회를 주시고, 소중한 지식을 나눠주시는 가시다님께 다시 한번 감사드립니다.
이 글이 EKS를 학습하는 분들께 도움이 되길 바랍니다.
1. Prometheus 개요
1.1 Prometheus란?
Prometheus 는 SoundCloud에서 시작된 오픈소스 시스템 모니터링 및 경고 도구입니다.
Kubernetes 환경을 포함하여 다양한 시스템의 메트릭을 수집하고, 시계열(Time Series) 데이터를 저장 및 분석하는 기능을 제공합니다.
1.2 Prometheus 주요 기능
- 시계열 데이터베이스(TSDB) 기반의 다차원 데이터 모델
- PromQL (Prometheus Query Language) 을 이용한 유연한 쿼리 기능
- Push & Pull 모델 지원 (기본적으로 Pull 방식)
- 서비스 디스커버리를 통한 동적 타겟 검색
- Exporter, AlertManager 등과의 연동 가능
- 다양한 대시보드 및 시각화 도구(Grafana 등) 지원
1.3 Prometheus 주요 구성 요소
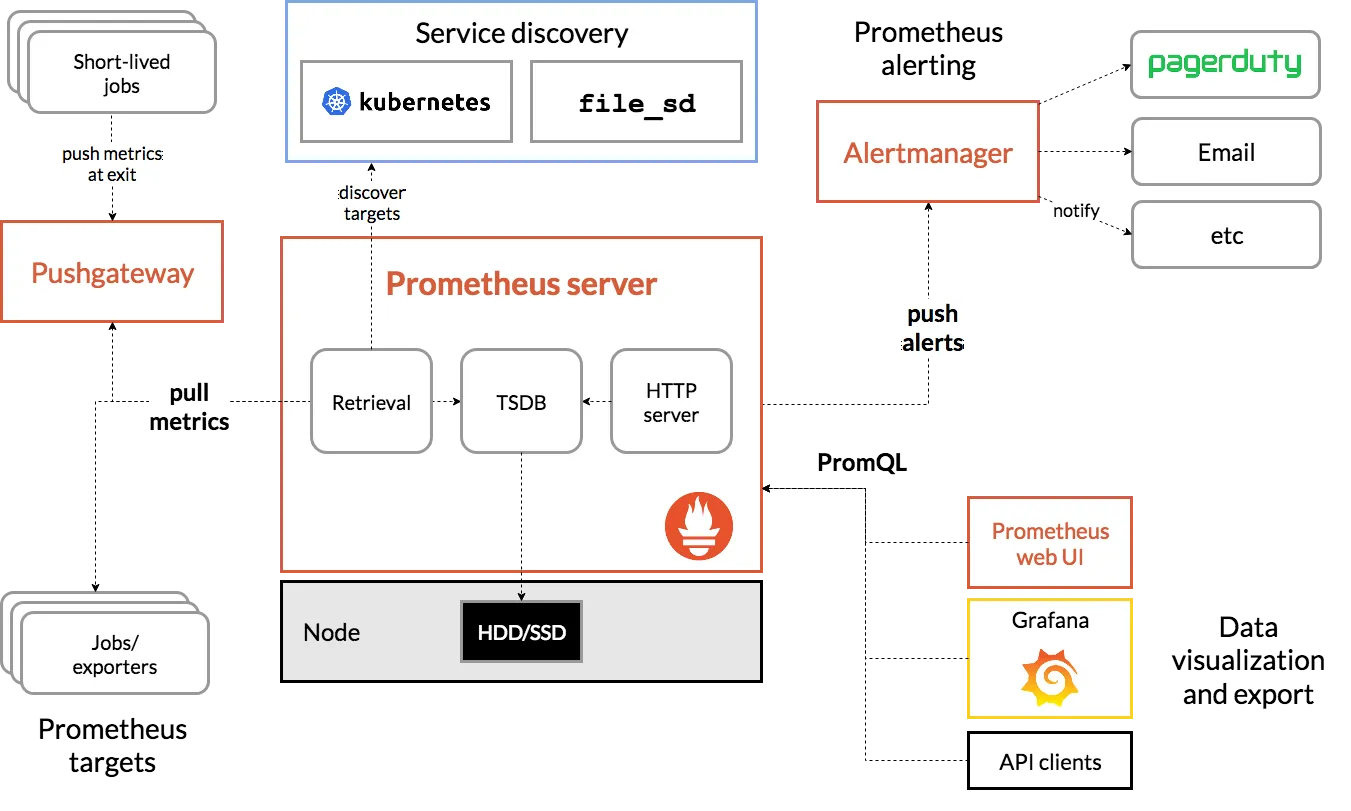
https://prometheus.io/docs/introduction/overview/
- Prometheus Server: 메트릭(Time series 데이터)을 스크랩하고 저장하는 핵심 컴포넌트
- Client Libraries: 애플리케이션 코드 계측
- Exporter: 애플리케이션 또는 시스템의 메트릭을 Prometheus 형식으로 변환. HAProxy, StatsD, Graphite 등의 서비스를 위한 특수 목적 Exporter
- Push Gateway: 단기 실행(Job) 프로세스를 위한 메트릭 수집기
- AlertManager: 정의된 조건에 따라 알람을 생성하고 전송하는 모듈
- 다양한 지원 도구: 메트릭을 시각화하는 도구(Grafana) 등
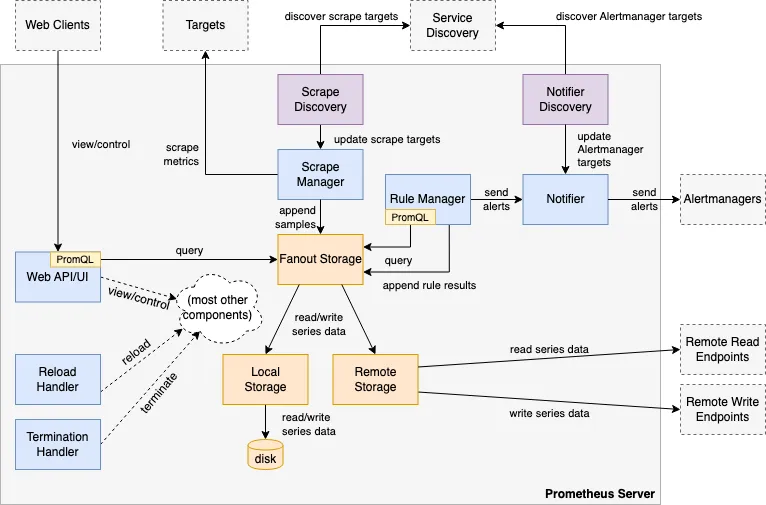
https://github.com/prometheus/prometheus/blob/86a7064/documentation/internal_architecture.md
2. Prometheus 3.0 출시
Prometheus 3.0 버전은 이전 버전(2.18 및 2.0) 대비 CPU 및 메모리 성능이 향상되었습니다.
- 관련 블로그: Prometheus 공식 블로그
- 기술 뉴스: GeekNews
3. Prometheus 직접 설치 및 구성 (EC2 환경)
3.1 Prometheus 설치
# 최신 버전 다운로드
wget https://github.com/prometheus/prometheus/releases/download/v3.2.0/prometheus-3.2.0.linux-amd64.tar.gz
# 압축 해제 및 이동
tar -xvf prometheus-3.2.0.linux-amd64.tar.gz
cd prometheus-3.2.0.linux-amd64
ls -l
# 실행 파일 이동
mv prometheus /usr/local/bin/
mv promtool /usr/local/bin/
mkdir -p /etc/prometheus /var/lib/prometheus
mv prometheus.yml /etc/prometheus/
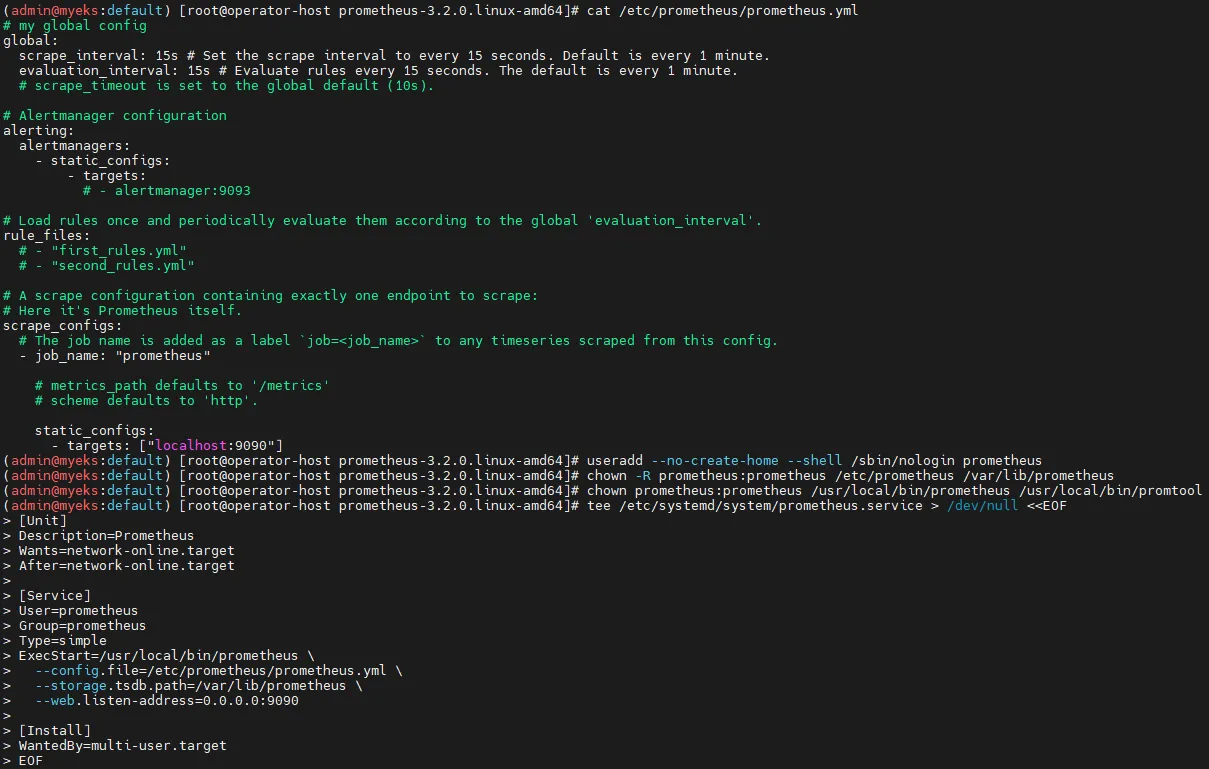
cat /etc/prometheus/prometheus.yml
# Prometheus 전용 사용자 생성
useradd --no-create-home --shell /sbin/nologin prometheus
chown -R prometheus:prometheus /etc/prometheus /var/lib/prometheus
chown prometheus:prometheus /usr/local/bin/prometheus /usr/local/bin/promtool
# Prometheus 서비스 등록
tee /etc/systemd/system/prometheus.service > /dev/null <<EOF
[Unit]
Description=Prometheus
Wants=network-online.target
After=network-online.target
[Service]
User=prometheus
Group=prometheus
Type=simple
ExecStart=/usr/local/bin/prometheus \
--config.file=/etc/prometheus/prometheus.yml \
--storage.tsdb.path=/var/lib/prometheus \
--web.listen-address=0.0.0.0:9090
[Install]
WantedBy=multi-user.target
EOF
# 서비스 실행
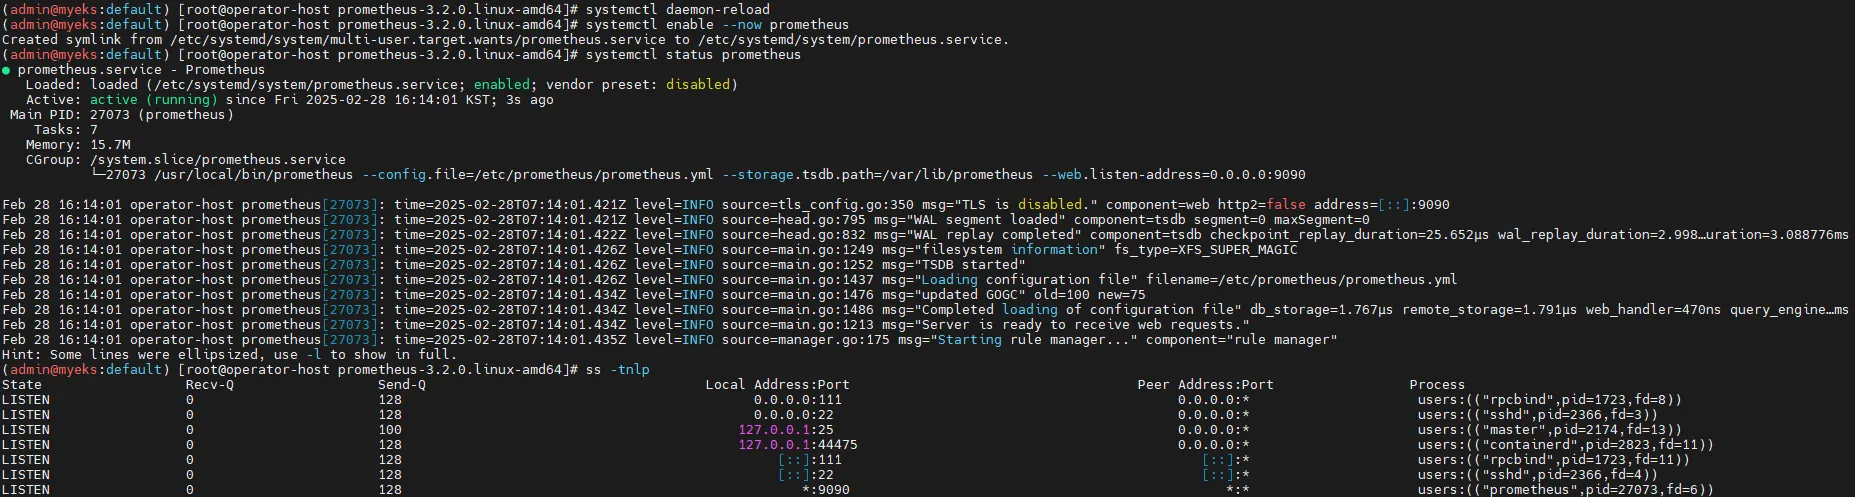
systemctl daemon-reload
systemctl enable --now prometheus
systemctl status prometheus
ss -tnlp
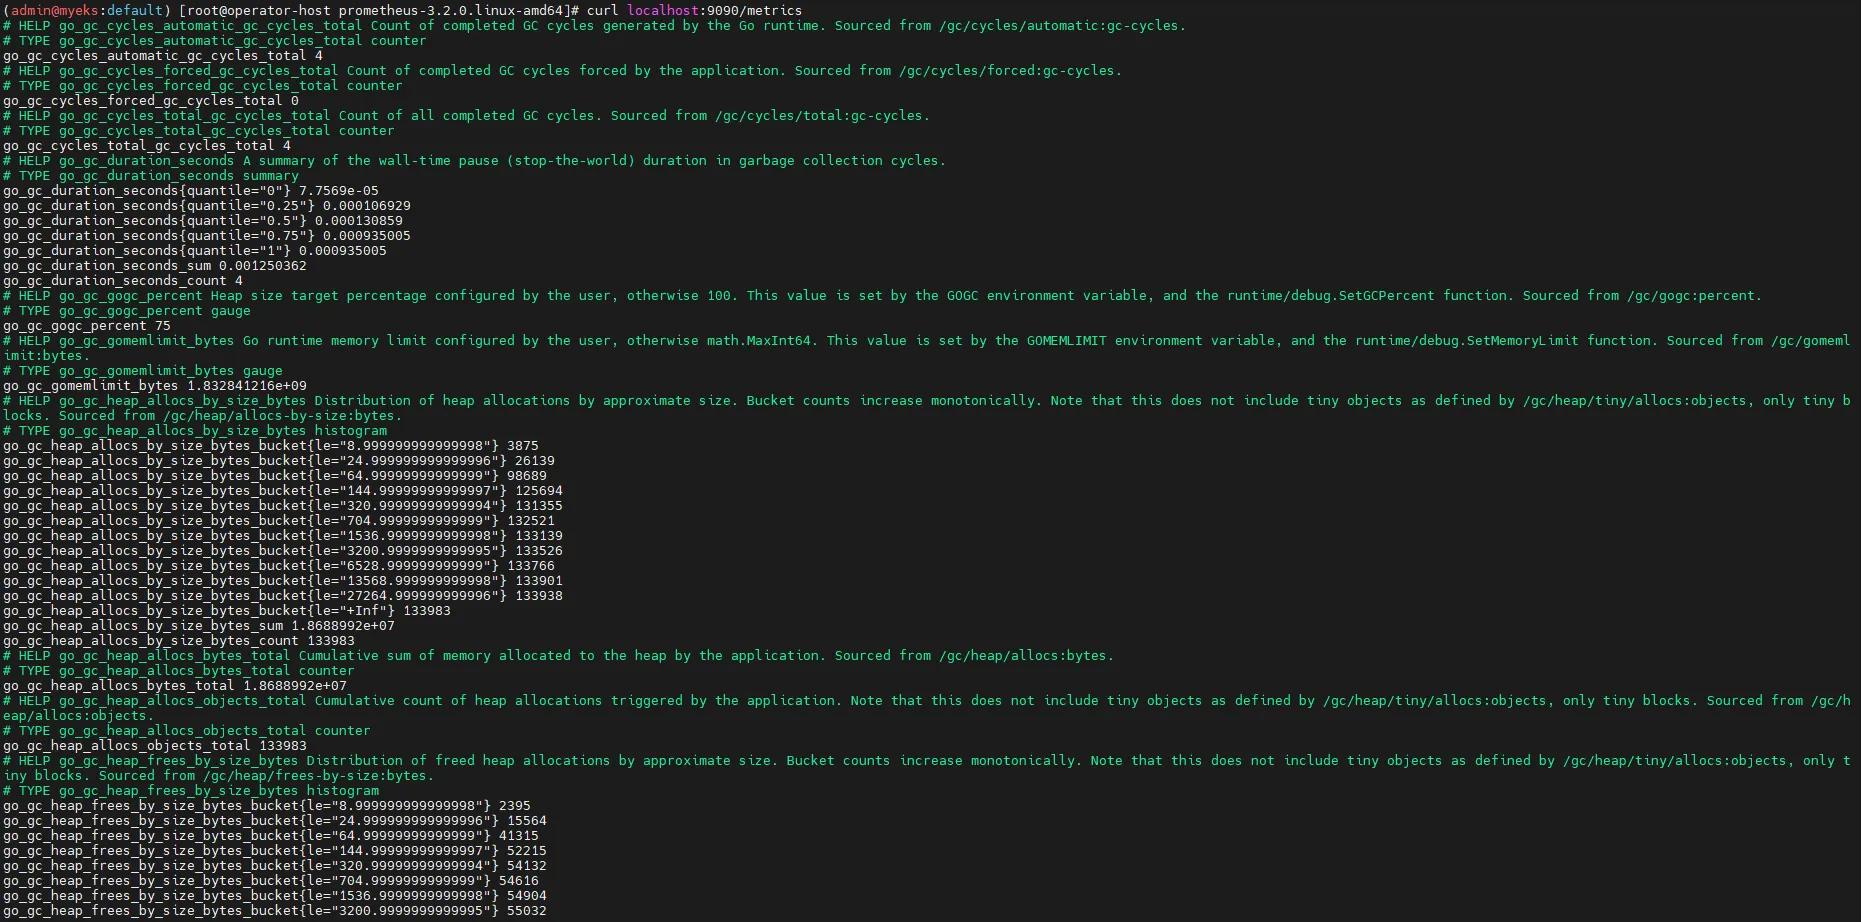
# 메트릭 확인
curl localhost:9090/metrics
echo -e "http://$(curl -s ipinfo.io/ip):9090"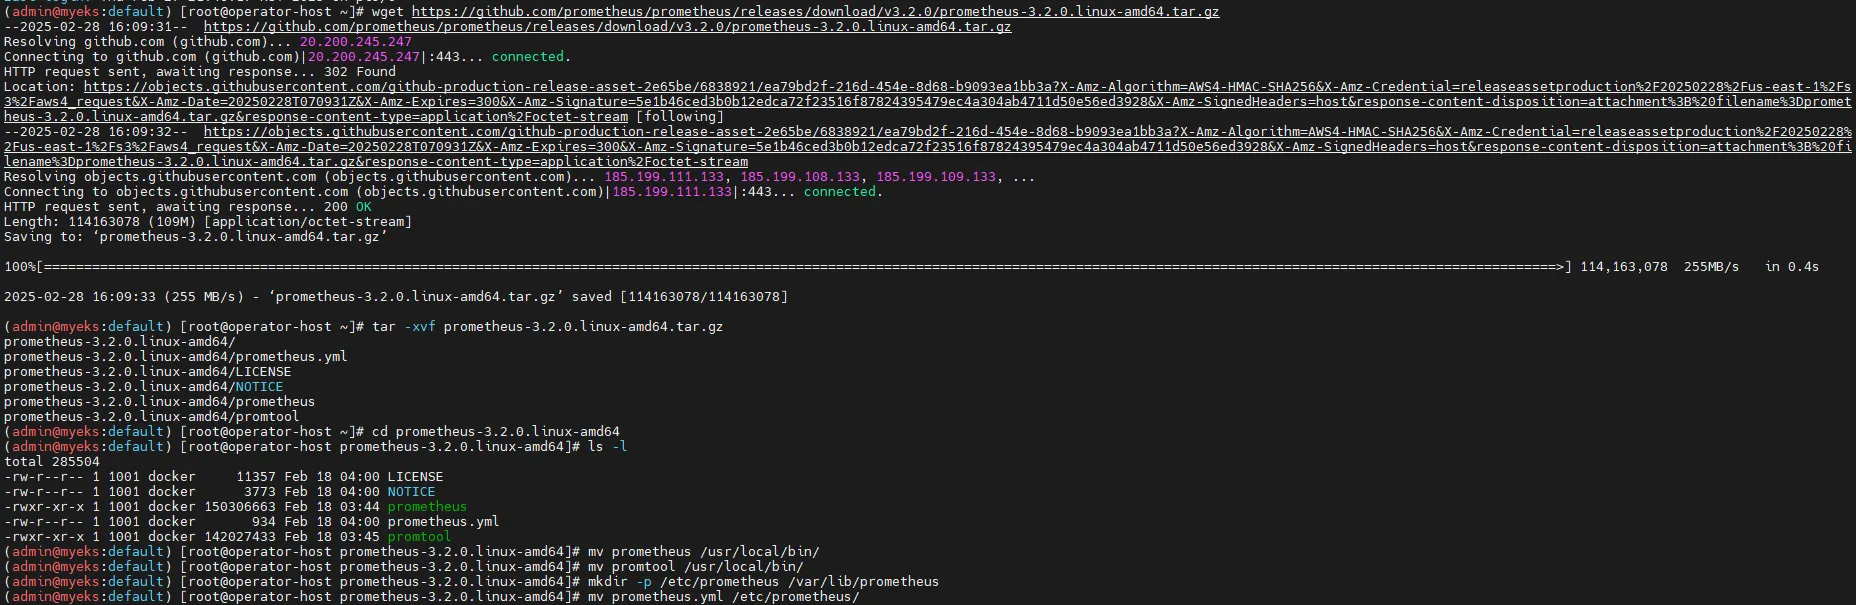
3.2 Node Exporter 설치 (서버 메트릭 수집)
# 최신 버전 다운로드
cd ~
wget https://github.com/prometheus/node_exporter/releases/download/v1.9.0/node_exporter-1.9.0.linux-amd64.tar.gz
tar xvfz node_exporter-1.9.0.linux-amd64.tar.gz
cd node_exporter-1.9.0.linux-amd64
cp node_exporter /usr/local/bin/
# 사용자 계정 생성
groupadd -f node_exporter
useradd -g node_exporter --no-create-home --shell /sbin/nologin node_exporter
chown node_exporter:node_exporter /usr/local/bin/node_exporter
# 서비스 등록
tee /etc/systemd/system/node_exporter.service > /dev/null <<EOF
[Unit]
Description=Node Exporter
Documentation=https://prometheus.io/docs/guides/node-exporter/
Wants=network-online.target
After=network-online.target
[Service]
User=node_exporter
Group=node_exporter
Type=simple
Restart=on-failure
ExecStart=/usr/local/bin/node_exporter \
--web.listen-address=:9200
[Install]
WantedBy=multi-user.target
EOF
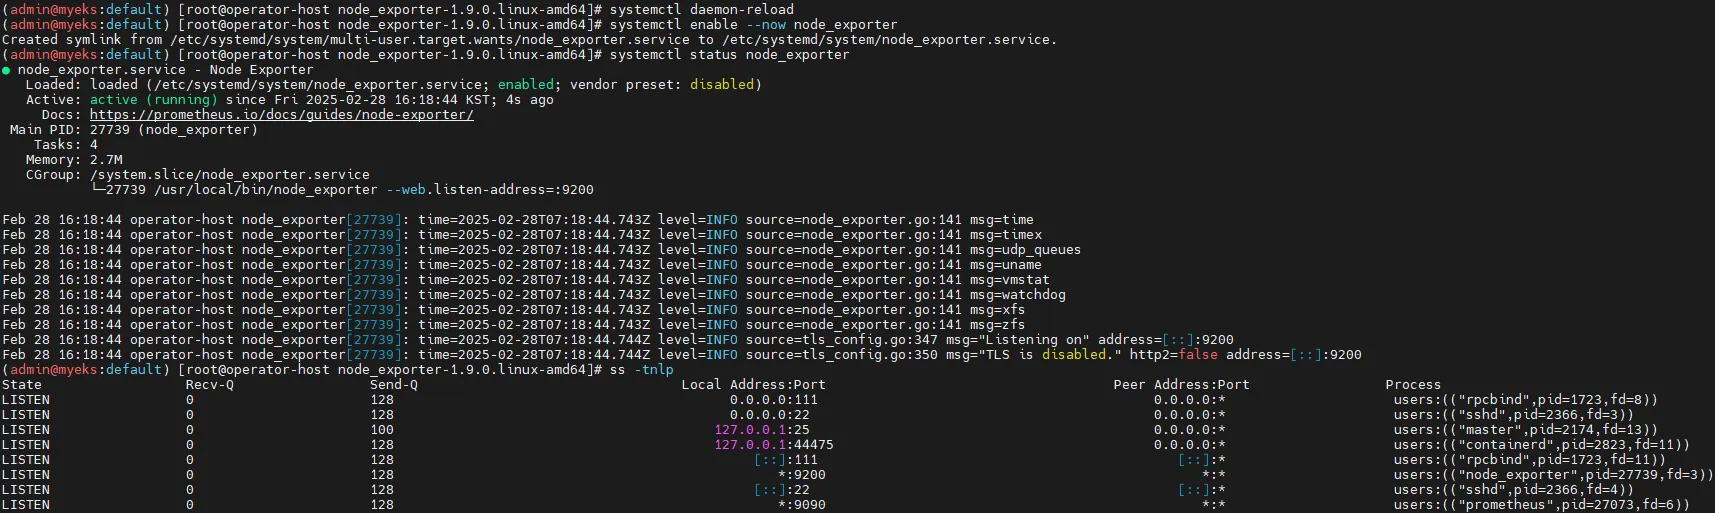
# 서비스 실행
systemctl daemon-reload
systemctl enable --now node_exporter
systemctl status node_exporter
ss -tnlp
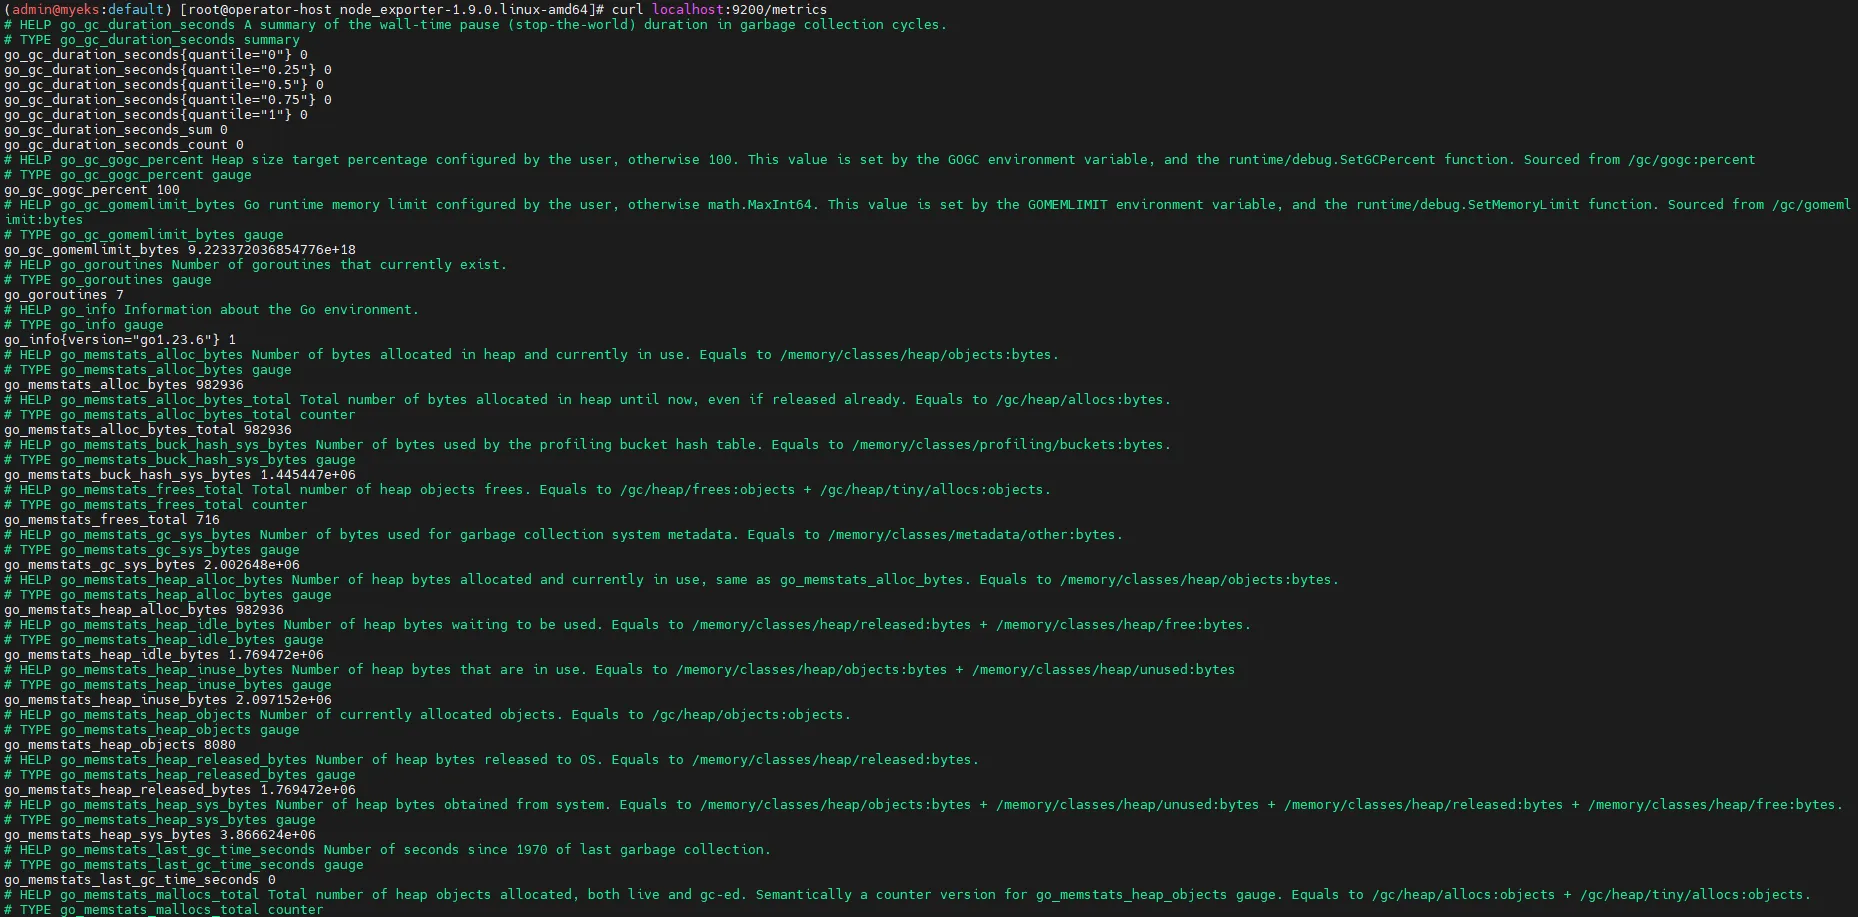
# 메트릭 확인
curl localhost:9200/metrics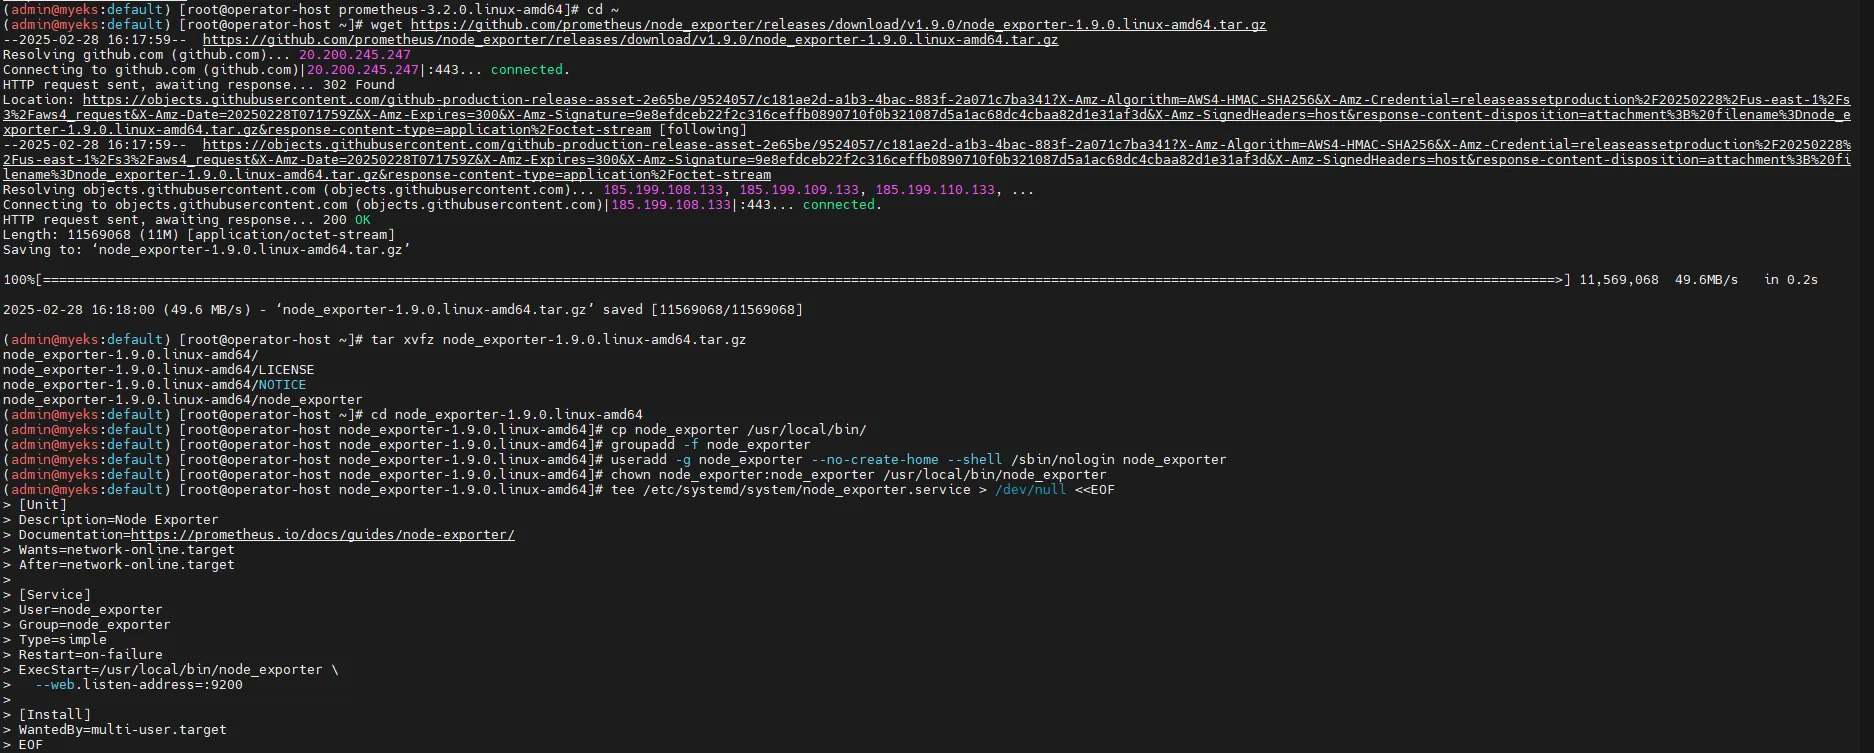
3.3 Prometheus에 Node Exporter 추가
Prometheus 설정에 Node Exporter를 수집 대상 타깃으로 추가합니다.
# prometheus.yml 수정
cat << EOF >> /etc/prometheus/prometheus.yml

  - job_name: 'node_exporter'
    static_configs:
      - targets: ["127.0.0.1:9200"]
        labels:
          alias: 'myec2'
EOF

# Prometheus 재시작
systemctl restart prometheus.service
systemctl status prometheus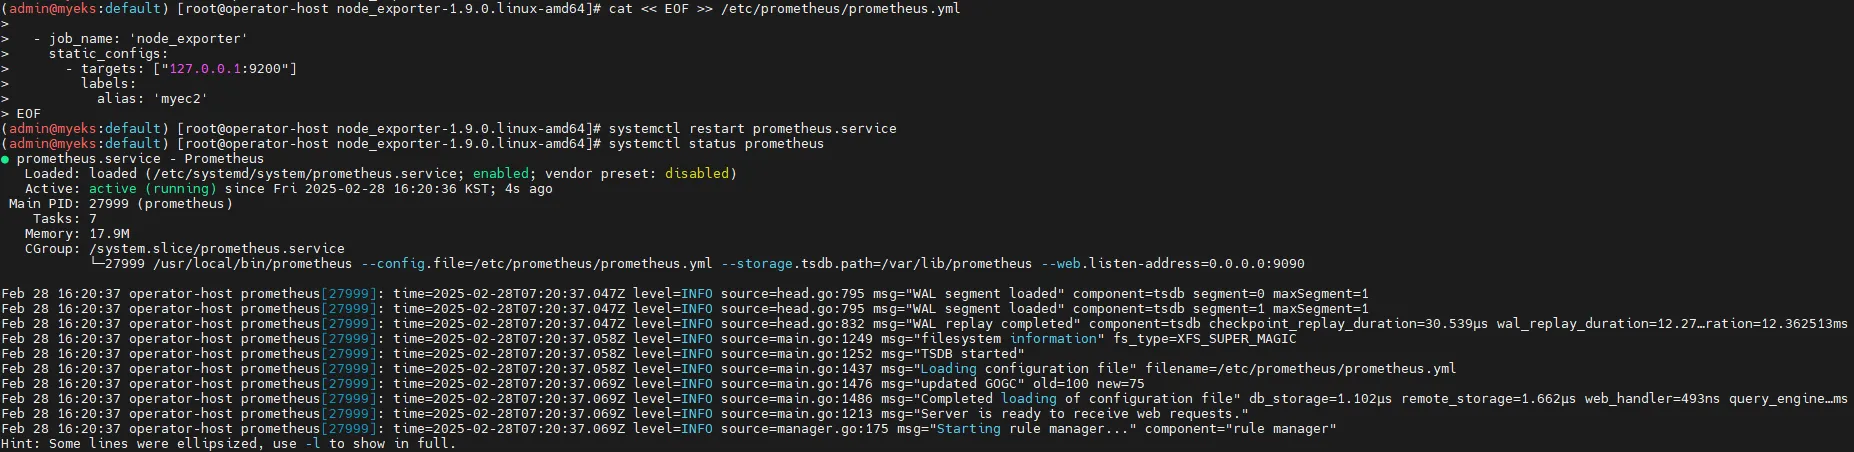
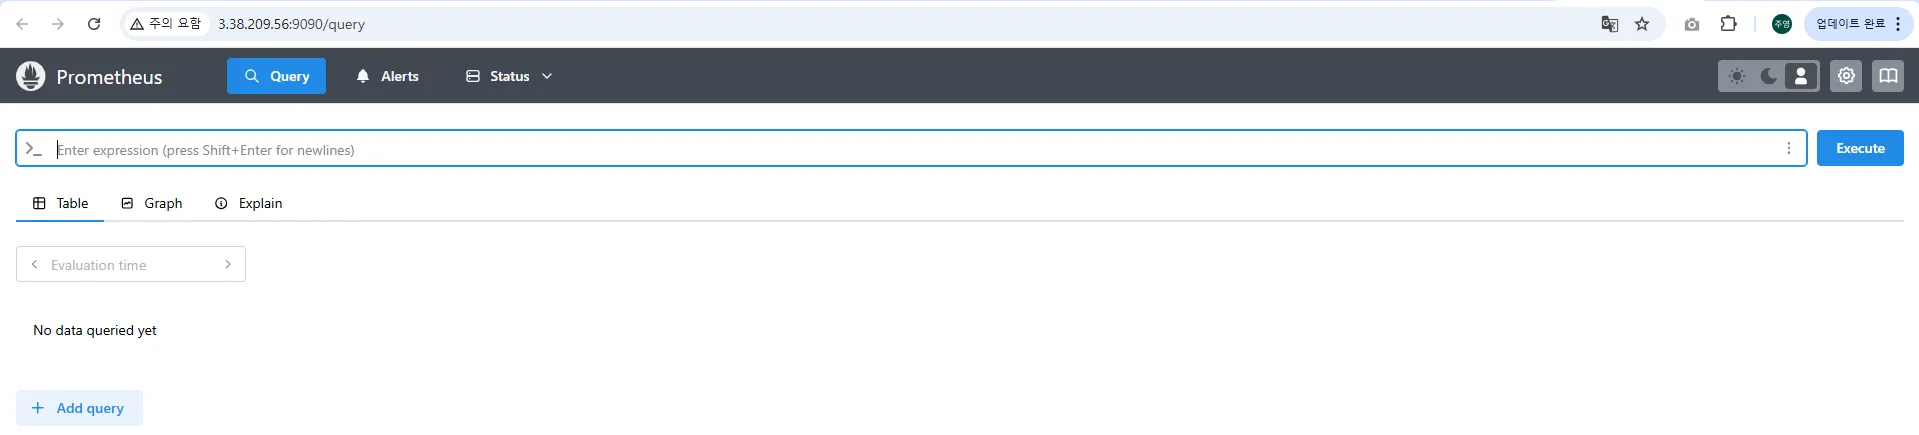
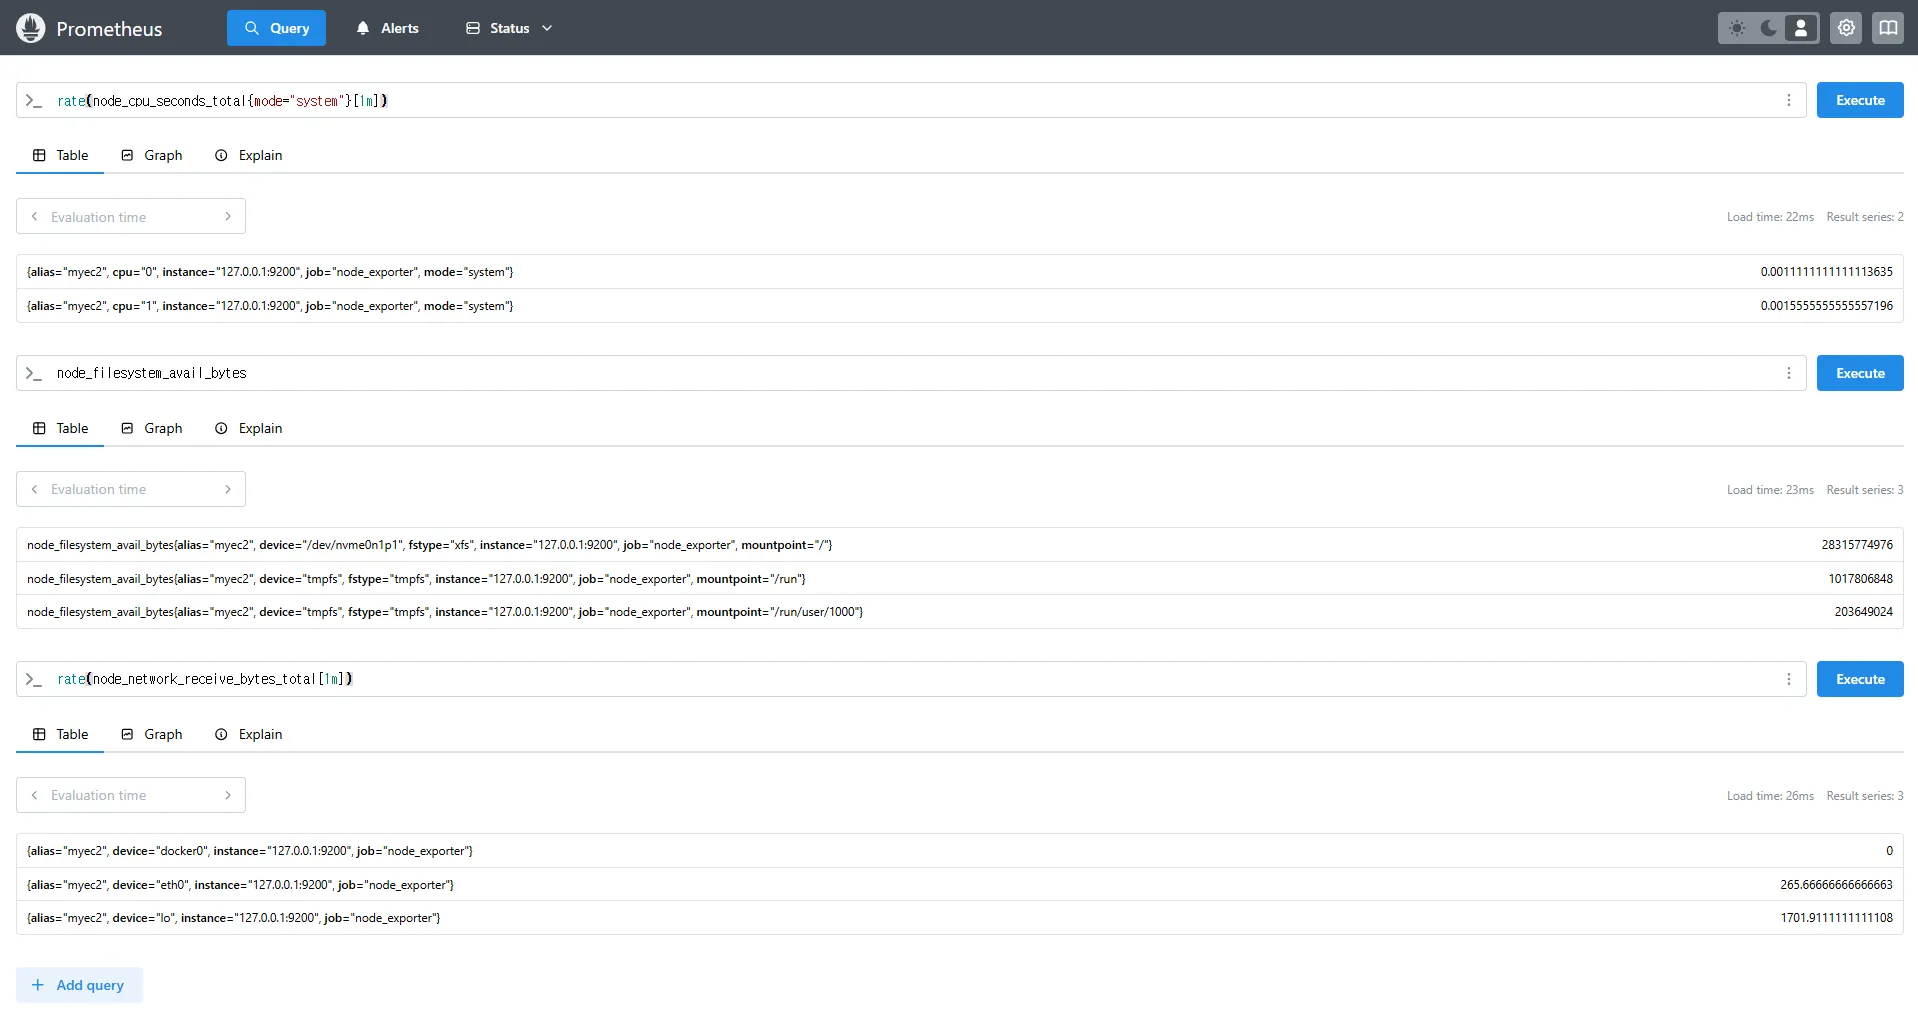
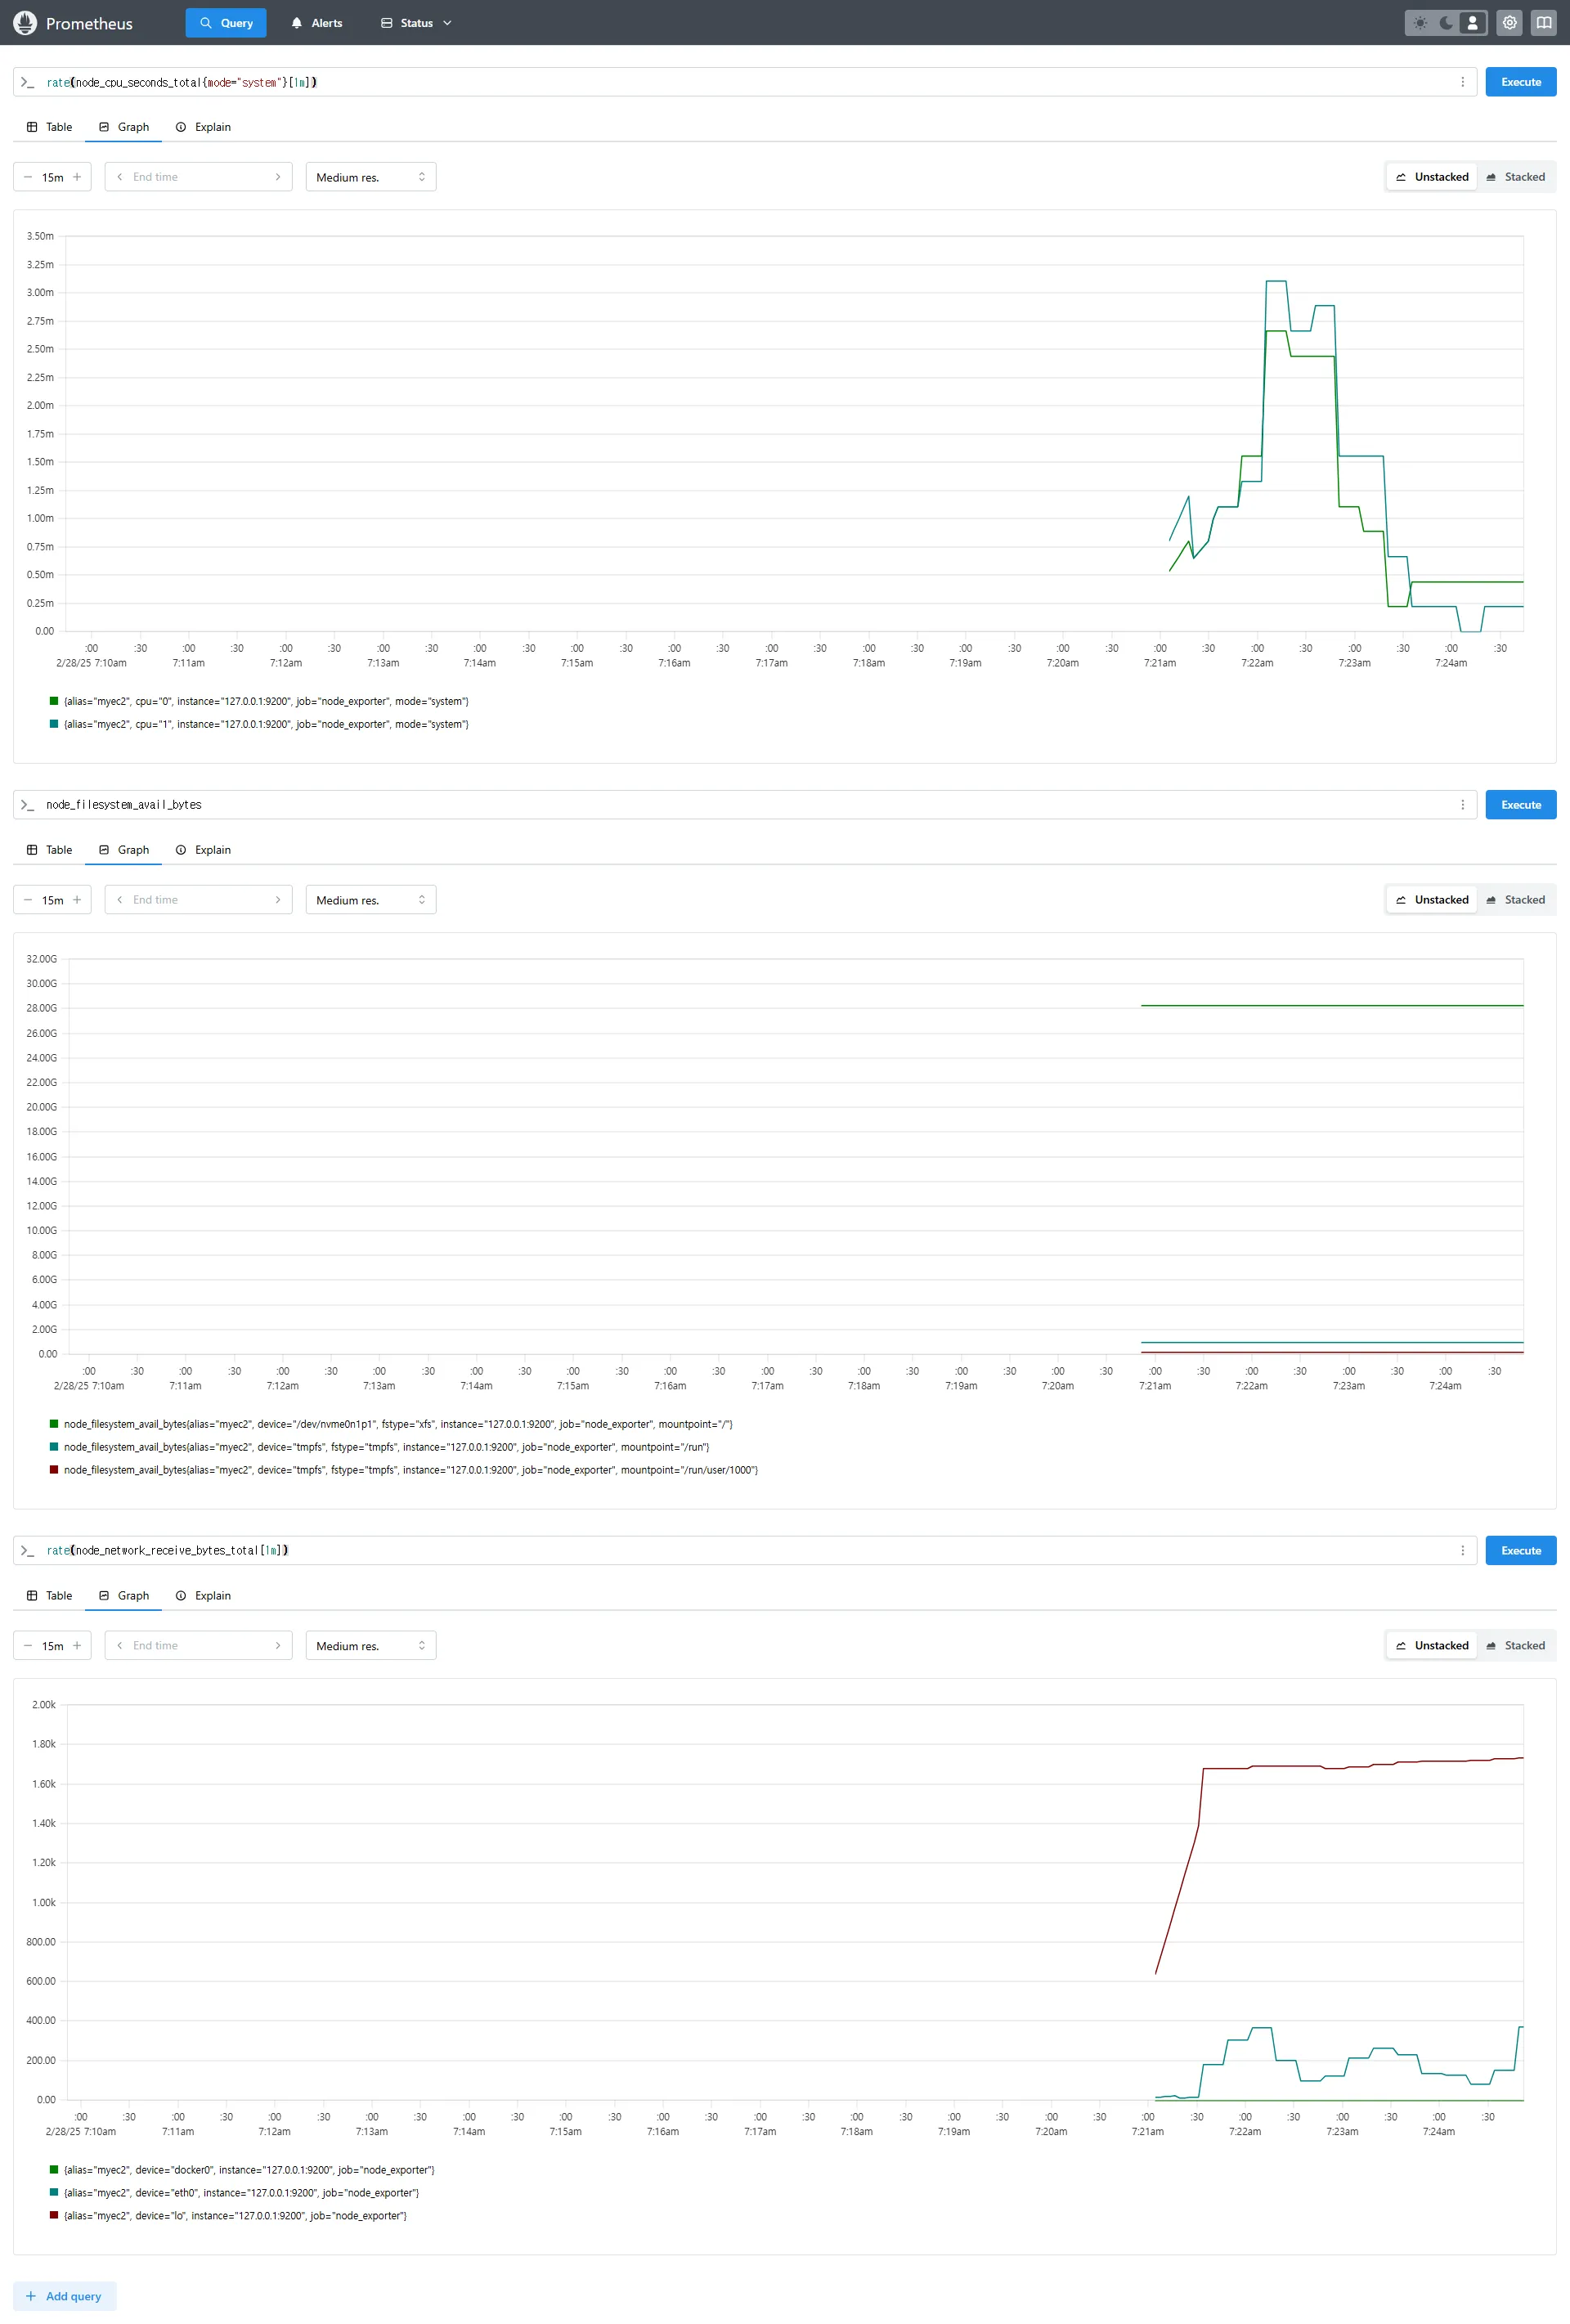
3.4 Prometheus 웹 UI에서 쿼리
rate(node_cpu_seconds_total{mode="system"}[1m])
node_filesystem_avail_bytes
rate(node_network_receive_bytes_total[1m])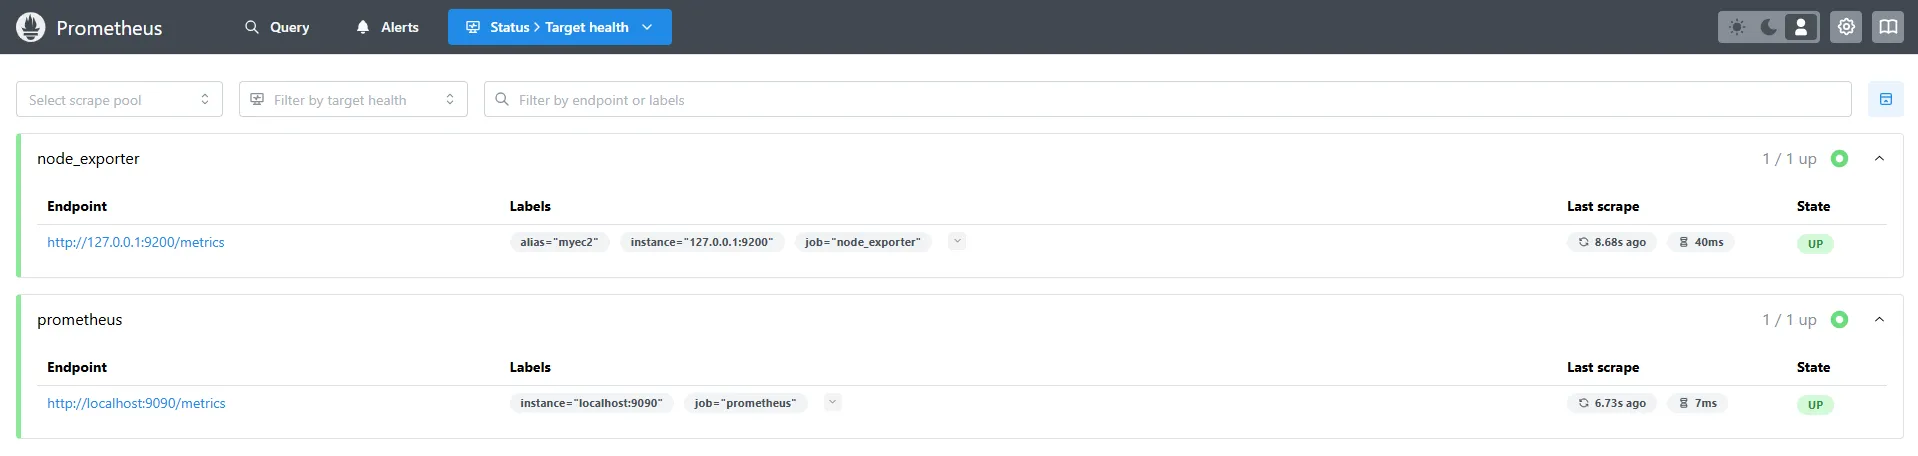
4. Prometheus Stack 설치 (Grafana 포함)
4.1 Helm을 이용한 kube-prometheus-stack 배포
# 모니터링
watch kubectl get pod,pvc,svc,ingress -n monitoring
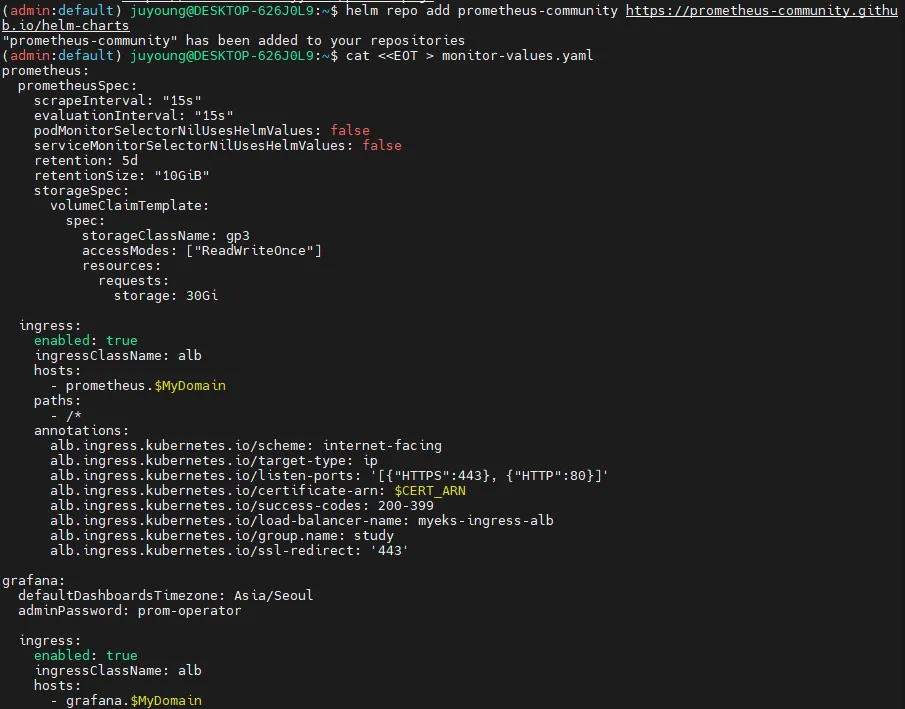
# Helm 저장소 추가
helm repo add prometheus-community https://prometheus-community.github.io/helm-charts
# values 파일 생성
cat <<EOT > monitor-values.yaml
prometheus:
prometheusSpec:
scrapeInterval: "15s"
evaluationInterval: "15s"
podMonitorSelectorNilUsesHelmValues: false
serviceMonitorSelectorNilUsesHelmValues: false
retention: 5d
retentionSize: "10GiB"
storageSpec:
volumeClaimTemplate:
spec:
storageClassName: gp3
accessModes: ["ReadWriteOnce"]
resources:
requests:
storage: 30Gi
ingress:
enabled: true
ingressClassName: alb
hosts:
- prometheus.$MyDomain
paths:
- /*
annotations:
alb.ingress.kubernetes.io/scheme: internet-facing
alb.ingress.kubernetes.io/target-type: ip
alb.ingress.kubernetes.io/listen-ports: '[{"HTTPS":443}, {"HTTP":80}]'
alb.ingress.kubernetes.io/certificate-arn: $CERT_ARN
alb.ingress.kubernetes.io/success-codes: 200-399
alb.ingress.kubernetes.io/load-balancer-name: myeks-ingress-alb
alb.ingress.kubernetes.io/group.name: study
alb.ingress.kubernetes.io/ssl-redirect: '443'
grafana:
defaultDashboardsTimezone: Asia/Seoul
adminPassword: prom-operator
ingress:
enabled: true
ingressClassName: alb
hosts:
- grafana.$MyDomain
paths:
- /*
annotations:
alb.ingress.kubernetes.io/scheme: internet-facing
alb.ingress.kubernetes.io/target-type: ip
alb.ingress.kubernetes.io/listen-ports: '[{"HTTPS":443}, {"HTTP":80}]'
alb.ingress.kubernetes.io/certificate-arn: $CERT_ARN
alb.ingress.kubernetes.io/success-codes: 200-399
alb.ingress.kubernetes.io/load-balancer-name: myeks-ingress-alb
alb.ingress.kubernetes.io/group.name: study
alb.ingress.kubernetes.io/ssl-redirect: '443'
persistence:
enabled: true
type: sts
storageClassName: "gp3"
accessModes:
- ReadWriteOnce
size: 20Gi
alertmanager:
enabled: false
defaultRules:
create: false
kubeControllerManager:
enabled: false
kubeEtcd:
enabled: false
kubeScheduler:
enabled: false
prometheus-windows-exporter:
prometheus:
monitor:
enabled: false
EOT
cat monitor-values.yaml
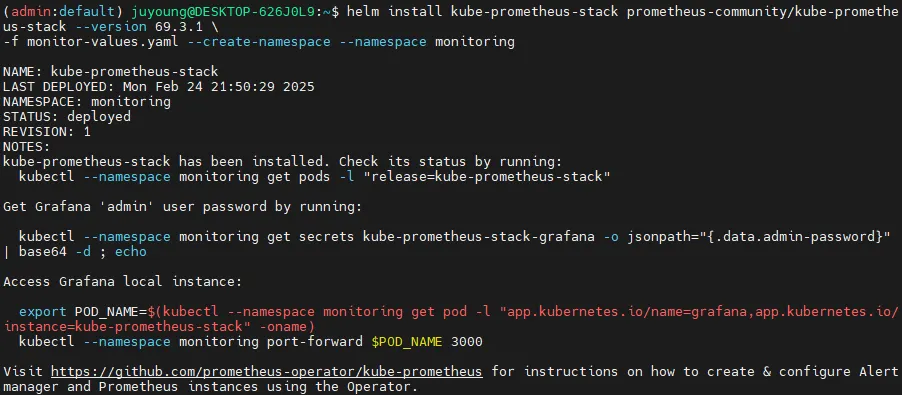
# Prometheus Stack 배포
helm install kube-prometheus-stack prometheus-community/kube-prometheus-stack --version 69.3.1 \
-f monitor-values.yaml --create-namespace --namespace monitoring
# 배포 확인
## alertmanager-0 : 사전에 정의한 정책 기반(예: 노드 다운, 파드 Pending 등)으로 시스템 경고 메시지를 생성 후 경보 채널(슬랙 등)로 전송
## grafana-0 : 프로메테우스는 메트릭 정보를 저장하는 용도로 사용하며, 그라파나로 시각화 처리
## prometheus-0 : 모니터링 대상이 되는 파드는 ‘exporter’라는 별도의 사이드카 형식의 파드에서 모니터링 메트릭을 노출, pull 방식으로 가져와 내부의 시계열 데이터베이스에 저장
## node-exporter : 노드익스포터는 물리 노드에 대한 자원 사용량(네트워크, 스토리지 등 전체) 정보를 메트릭 형태로 변경하여 노출
## operator : 시스템 경고 메시지 정책(prometheus rule), 애플리케이션 모니터링 대상 추가 등의 작업을 편리하게 할수 있게 CRD 지원
## kube-state-metrics : 쿠버네티스의 클러스터의 상태(kube-state)를 메트릭으로 변환하는 파드
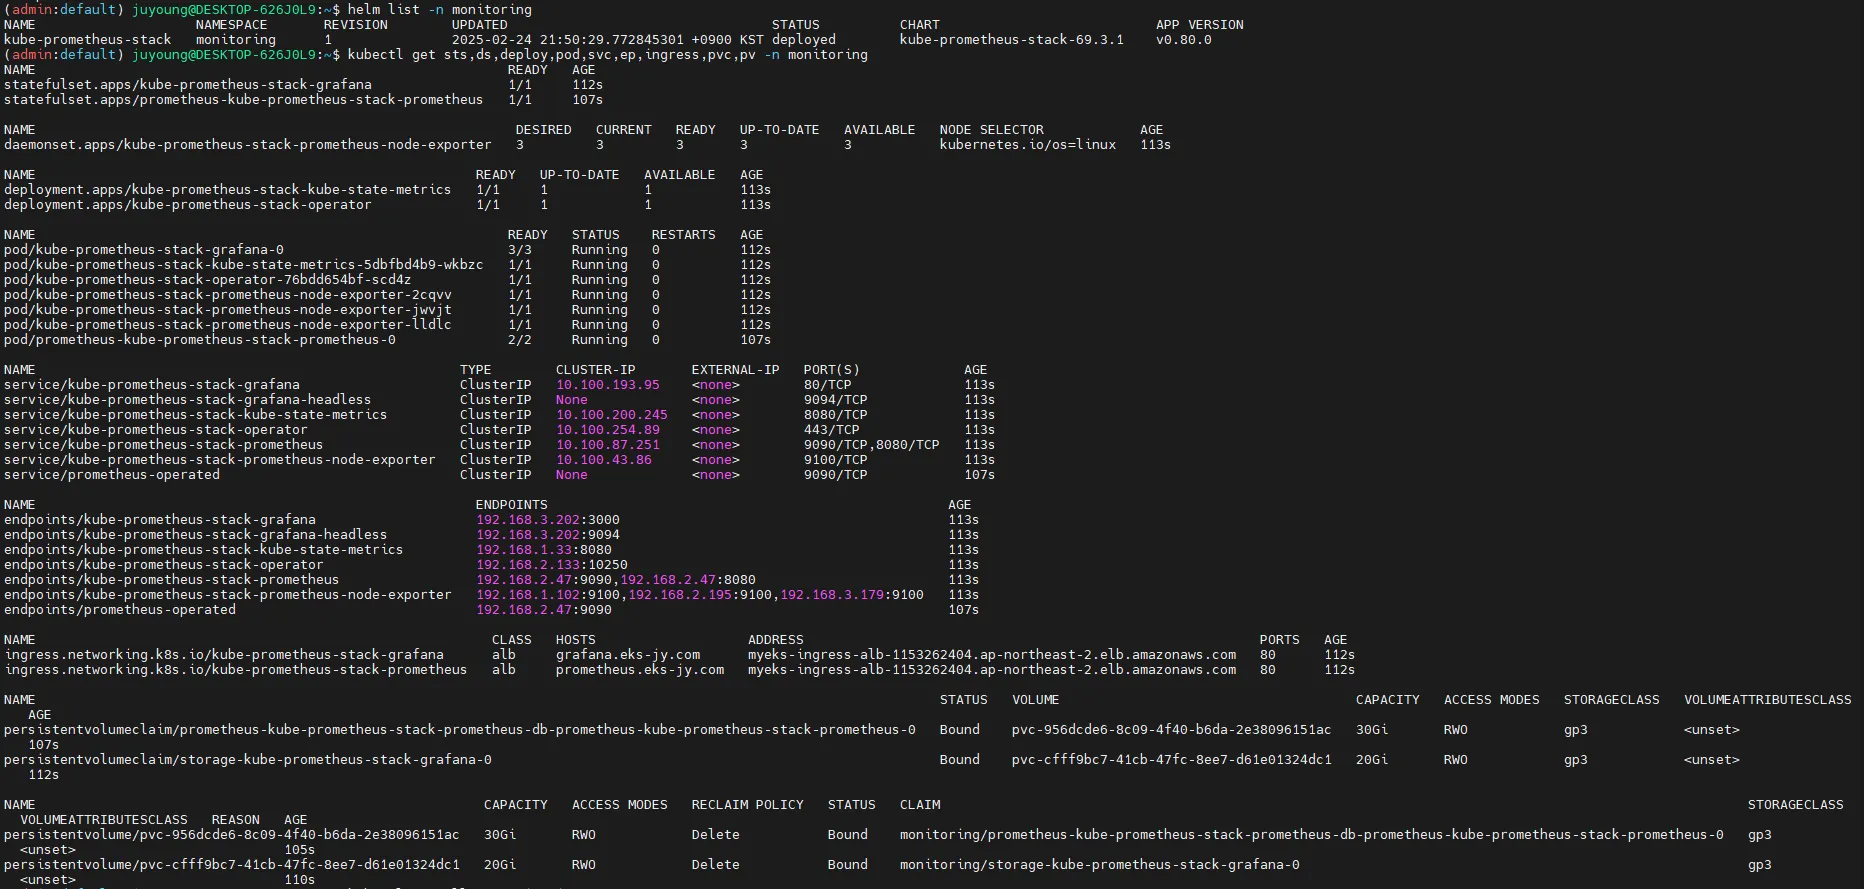
helm list -n monitoring
kubectl get sts,ds,deploy,pod,svc,ep,ingress,pvc,pv -n monitoring
kubectl get-all -n monitoring
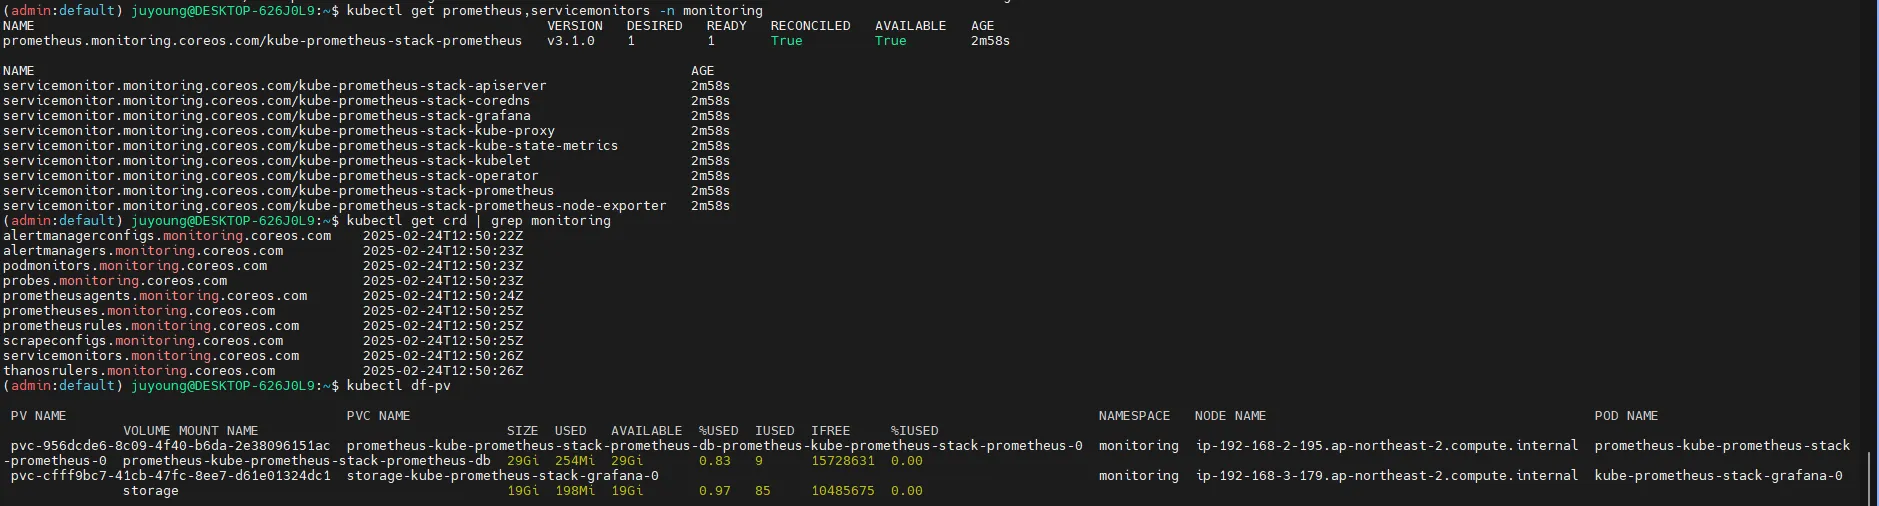
kubectl get prometheus,servicemonitors -n monitoring
kubectl get crd | grep monitoring
kubectl df-pv
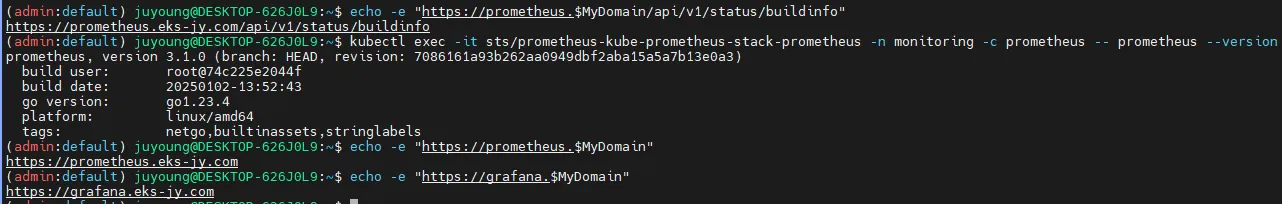
# 프로메테우스 버전 확인
echo -e "https://prometheus.$MyDomain/api/v1/status/buildinfo"
open https://prometheus.$MyDomain/api/v1/status/buildinfo # macOS
kubectl exec -it sts/prometheus-kube-prometheus-stack-prometheus -n monitoring -c prometheus -- prometheus --version
prometheus, version 3.1.0 (branch: HEAD, revision: 7086161a93b262aa0949dbf2aba15a5a7b13e0a3)
...

4.2 Prometheus 및 Grafana 웹 UI 접속
# 프로메테우스 웹 접속
echo -e "https://prometheus.$MyDomain"
open "https://prometheus.$MyDomain" # macOS
# 그라파나 웹 접속
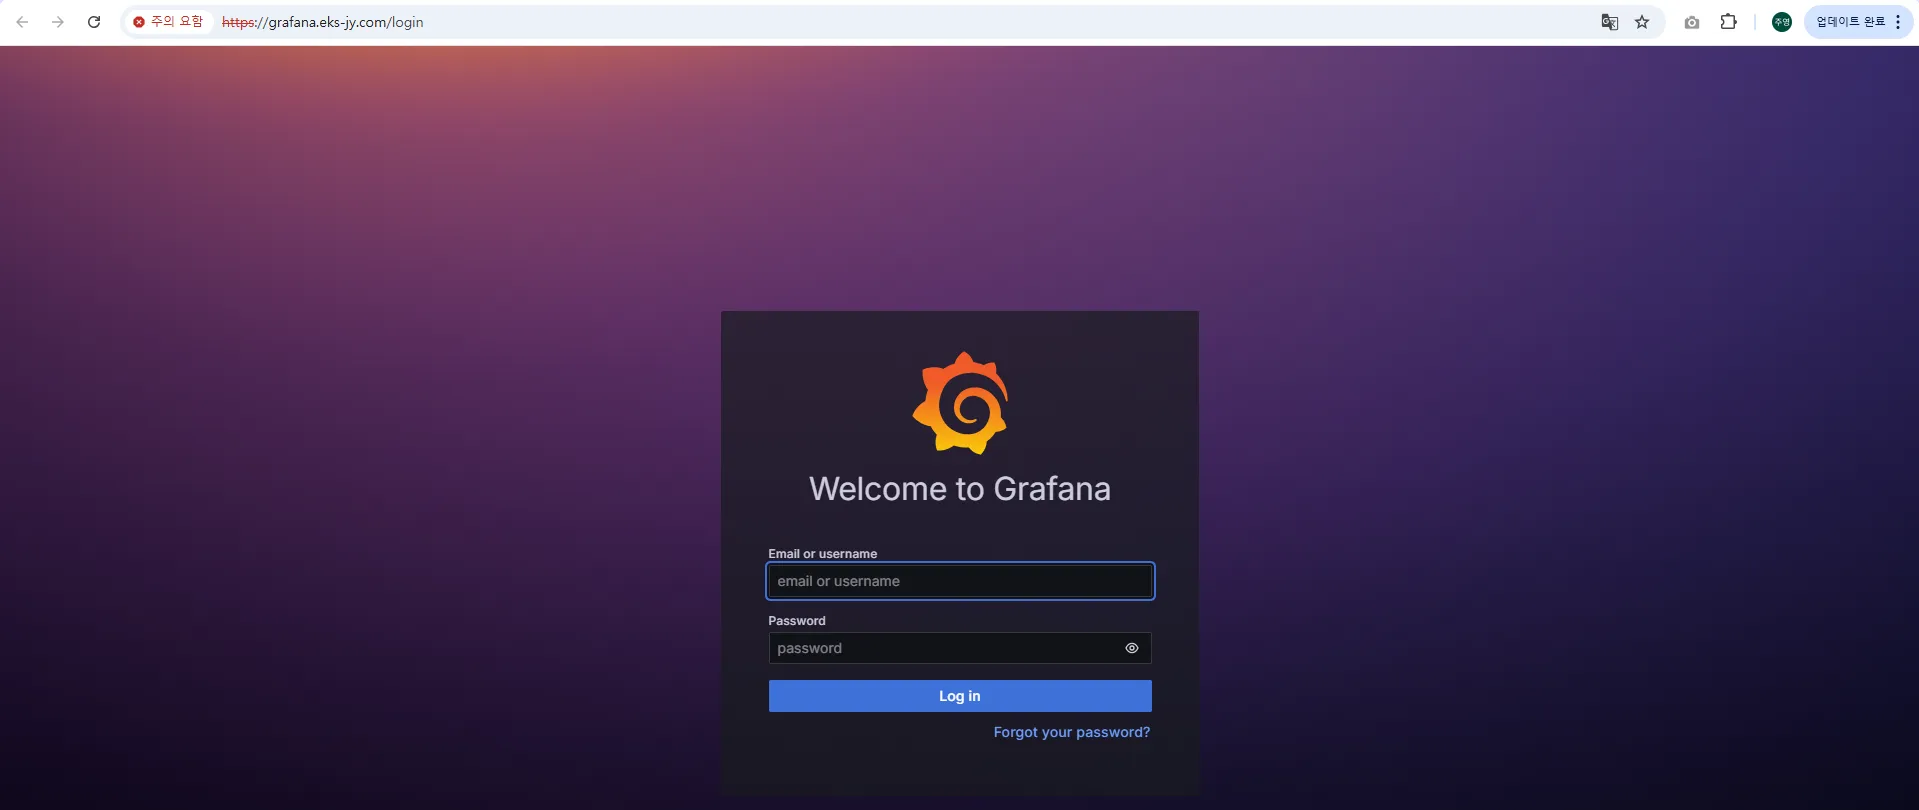
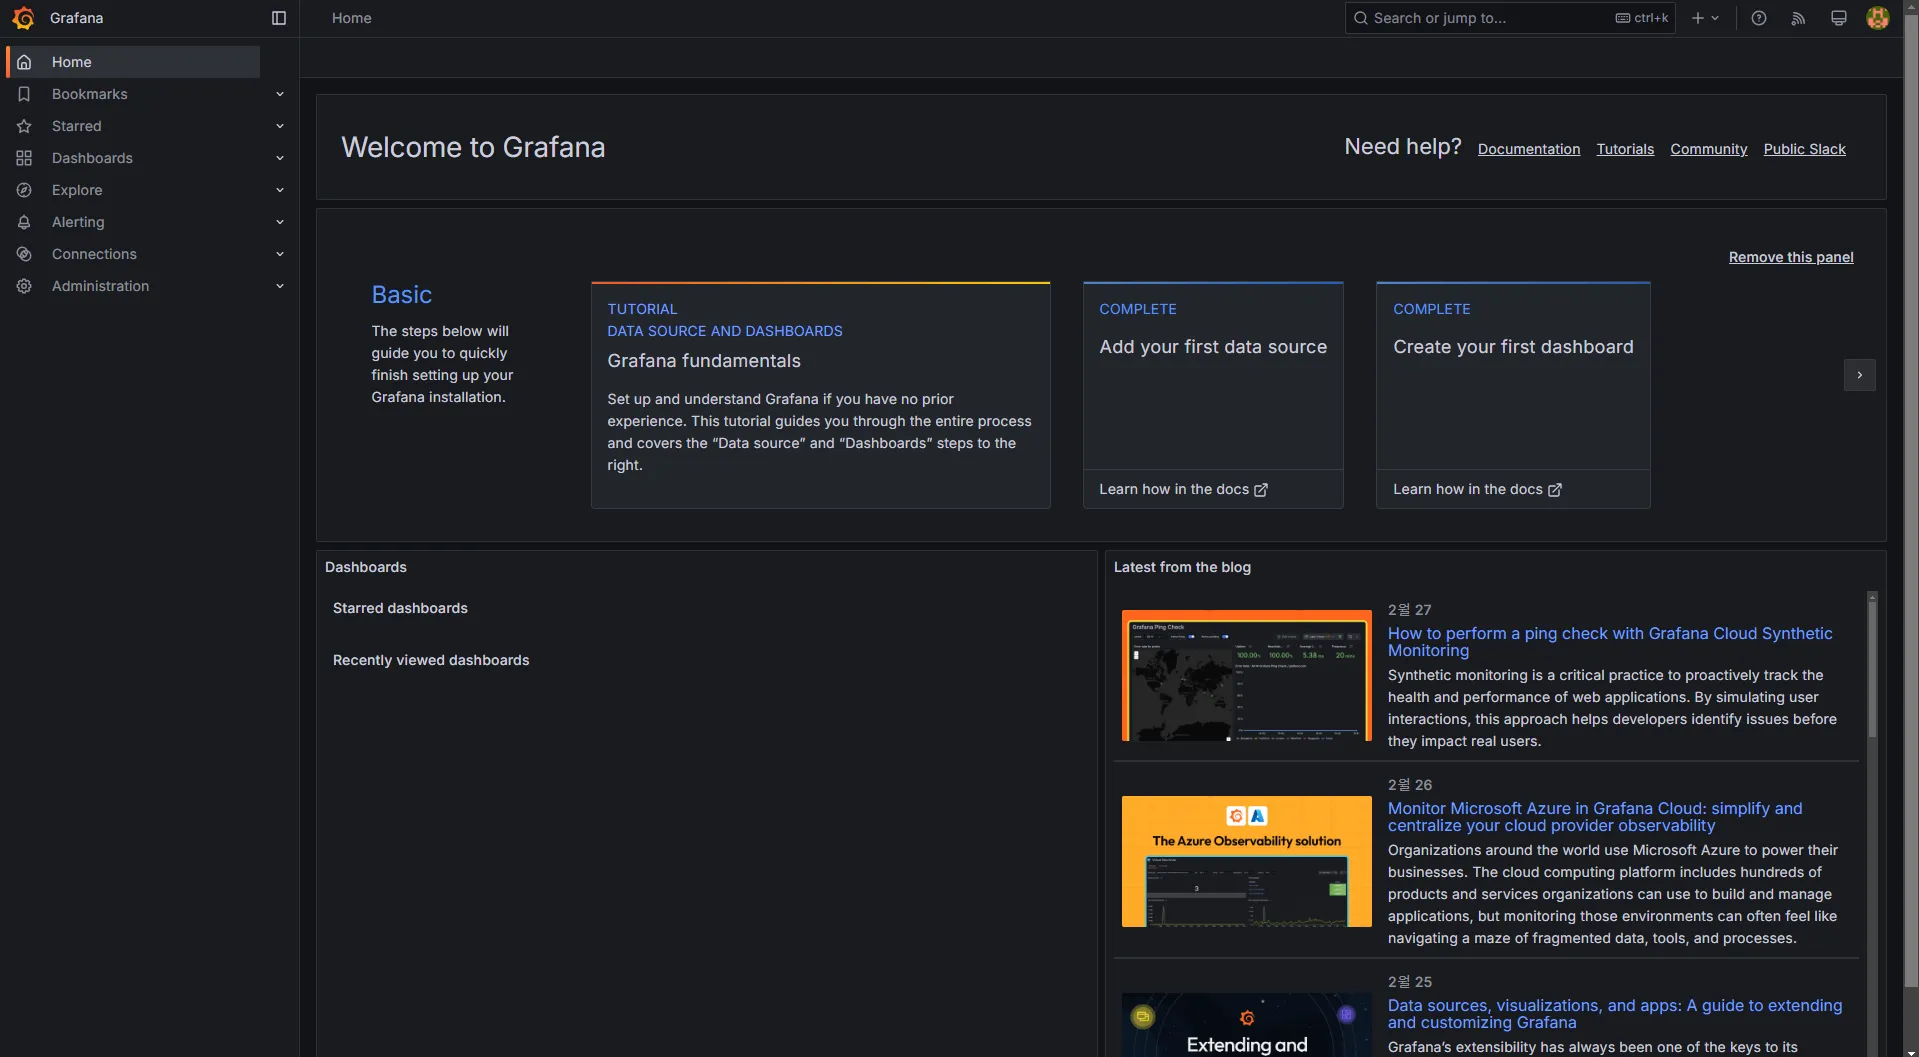
echo -e "https://grafana.$MyDomain"
open "https://grafana.$MyDomain" # macOS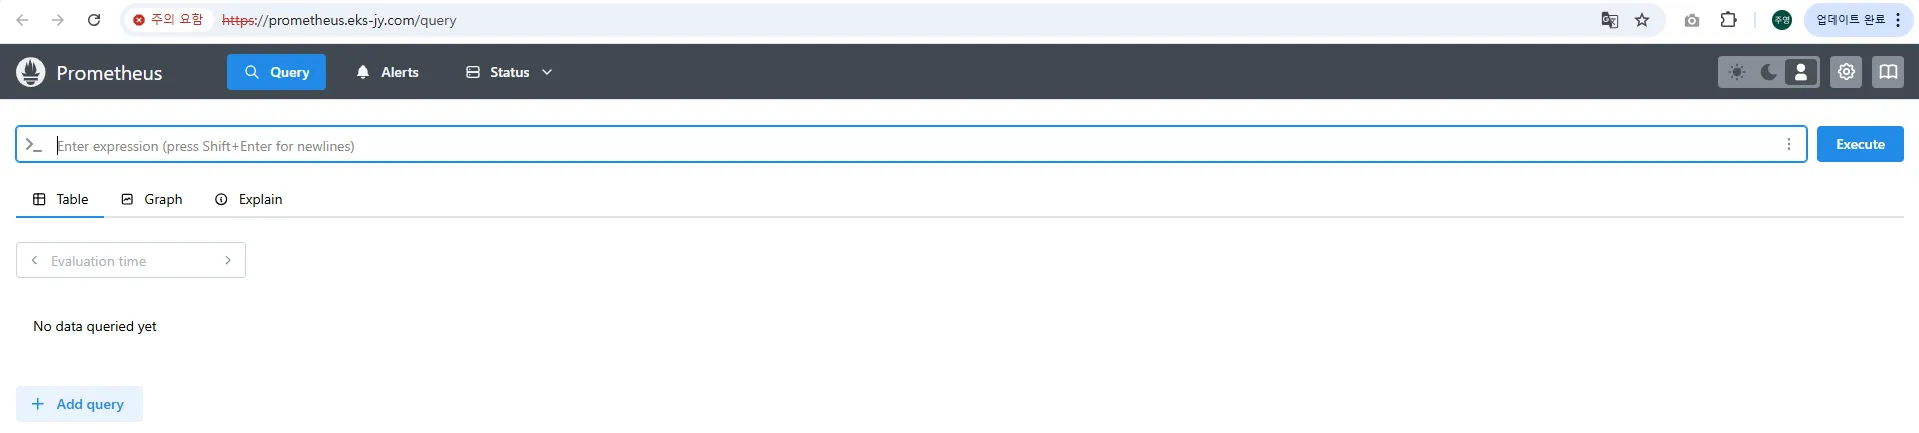
4.3 Prometheus 삭제 방법
# Helm을 이용한 삭제
helm uninstall -n monitoring kube-prometheus-stack

# CRD 삭제
kubectl delete crd alertmanagerconfigs.monitoring.coreos.com
kubectl delete crd alertmanagers.monitoring.coreos.com
kubectl delete crd podmonitors.monitoring.coreos.com
kubectl delete crd probes.monitoring.coreos.com
kubectl delete crd prometheuses.monitoring.coreos.com
kubectl delete crd prometheusrules.monitoring.coreos.com
kubectl delete crd servicemonitors.monitoring.coreos.com
kubectl delete crd thanosrulers.monitoring.coreos.com
5. EKS에서 AWS CNI Metrics 수집을 위한 사전 설정
5.1 개요
Amazon EKS는 클러스터 네트워크를 관리하기 위해 AWS CNI를 사용합니다. AWS CNI는 EKS 클러스터 내에서 Pod가 사용할 수 있는 IP 주소를 할당하고, 네트워크 인터페이스를 관리하는 역할을 합니다.
AWS CNI의 성능 및 상태를 모니터링하기 위해 Prometheus를 활용할 수 있으며, 이를 위해 PodMonitor를 설정하여 CNI 관련 메트릭을 수집할 수 있습니다.
5.2 AWS CNI Metrics 수집을 위한 주요 개념
AWS CNI 메트릭을 Prometheus에서 수집하려면 다음의 설정이 필요합니다.
-
PodMonitor 생성
- Prometheus Operator를 사용하여 AWS CNI가 실행 중인 Pod에서 메트릭을 수집합니다.
- PodMonitor는 특정 네임스페이스 내의 Pod를 대상으로 메트릭을 가져오는 역할을 합니다.
-
ServiceMonitor와 PodMonitor의 차이점
- ServiceMonitor: Kubernetes의 Service 객체를 대상으로 메트릭을 수집합니다.
- PodMonitor: 개별 Pod를 대상으로 메트릭을 수집하며, 특정 라벨을 통해 타겟을 식별합니다.
- AWS CNI는 특정 Service를 제공하지 않으므로, PodMonitor를 사용해야 합니다.
5.3 PodMonitor를 활용한 AWS CNI Metrics 수집
Prometheus가 AWS CNI 관련 메트릭을 수집할 수 있도록 PodMonitor를 생성해야 합니다.
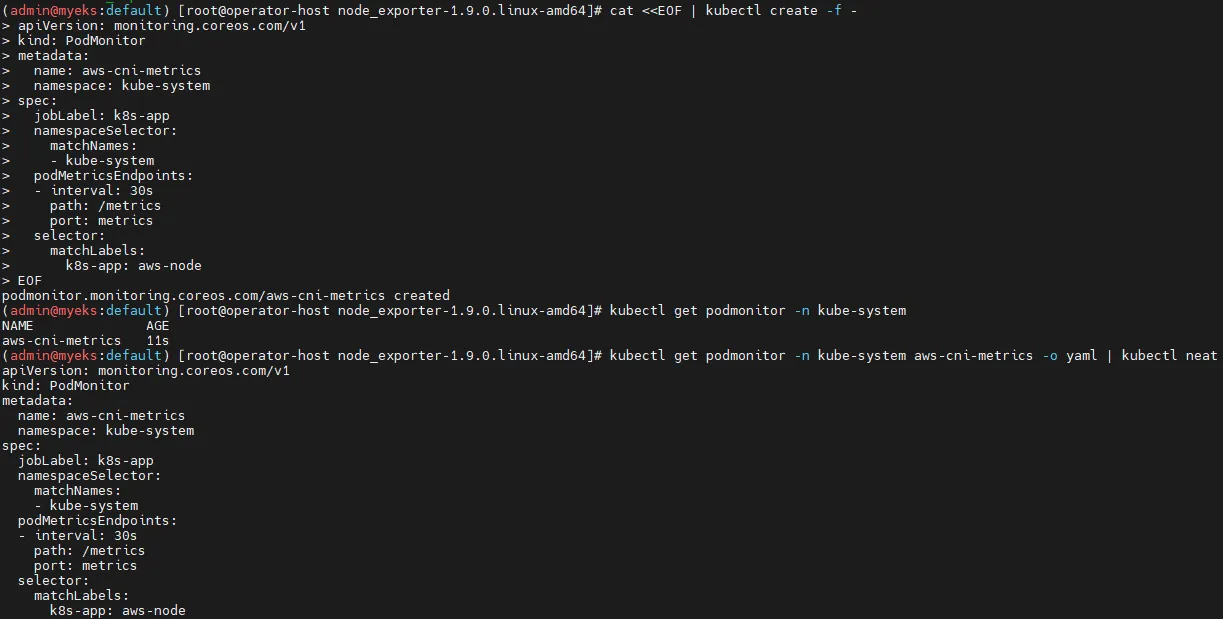
# PodMonitor 배포
cat <<EOF | kubectl create -f -
apiVersion: monitoring.coreos.com/v1
kind: PodMonitor
metadata:
  name: aws-cni-metrics
  namespace: kube-system
spec:
  jobLabel: k8s-app
  namespaceSelector:
    matchNames:
    - kube-system
  podMetricsEndpoints:
  - interval: 30s
    path: /metrics
    port: metrics
  selector:
    matchLabels:
      k8s-app: aws-node
EOF

# PodMonitor 배포 확인
kubectl get podmonitor -n kube-system
kubectl get podmonitor -n kube-system aws-cni-metrics -o yaml | kubectl neat- PodMonitor 설정 설명
apiVersion: monitoring.coreos.com/v1: Prometheus Operator의 CRD(Custom Resource Definition)를 사용kind: PodMonitor: Prometheus가 Pod 기반으로 메트릭을 수집하도록 설정namespace: kube-system: AWS CNI가 실행되는 네임스페이스jobLabel: k8s-app: Prometheus의 잡(Job) 라벨을 지정하여 AWS CNI 관련 메트릭을 수집namespaceSelector.matchNames:kube-system네임스페이스 내에서 대상 Pod를 찾도록 지정podMetricsEndpoints: 메트릭을 수집할 엔드포인트를 정의path: /metrics: 메트릭 데이터를 가져올 HTTP 경로port: metrics: Pod 내부에서 노출된 메트릭 포트를 참조
selector.matchLabels:k8s-app=aws-node라벨이 적용된 Pod만 대상으로 지정
PodMonitor가 생성되면 Prometheus가 자동으로 AWS CNI 관련 메트릭을 수집하게 됩니다.
5.4 AWS CNI Metrics 확인
PodMonitor가 정상적으로 적용되었는지 확인하려면, Prometheus에서 AWS CNI 메트릭을 조회해야 합니다.
AWS CNI는 각 노드에서 실행되는 aws-node Pod 내부의 61678 포트를 통해 메트릭을 제공합니다.
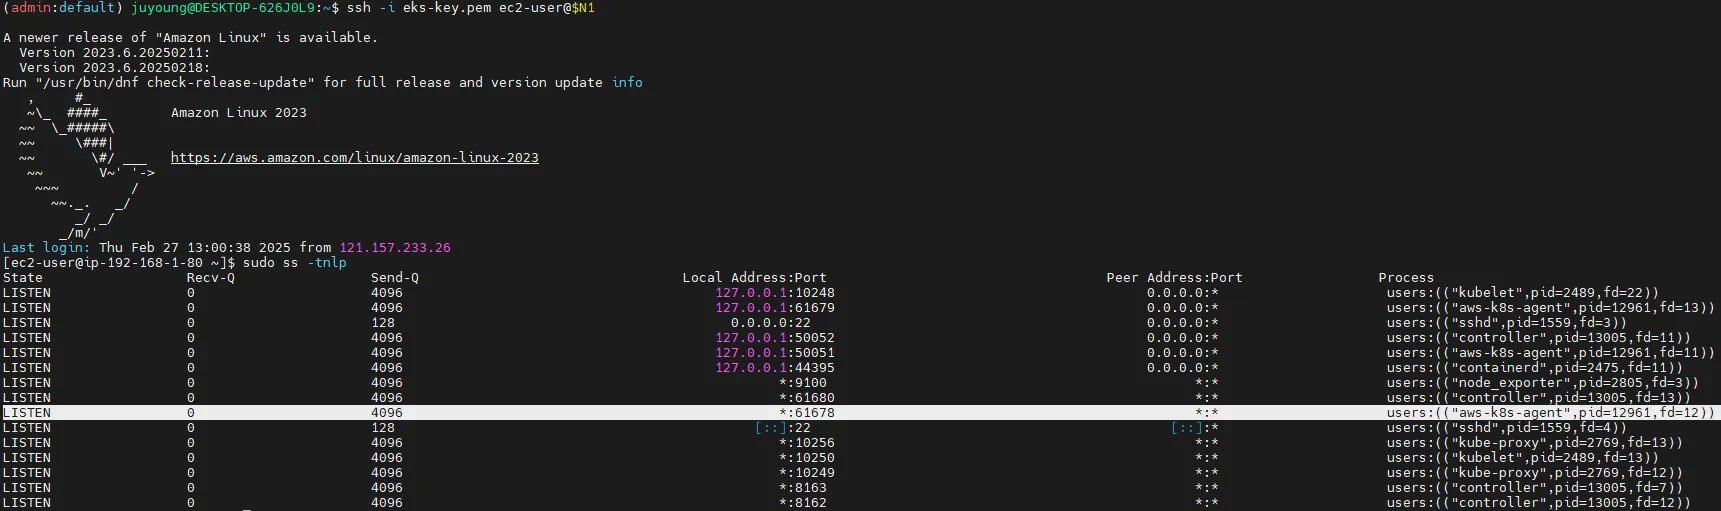
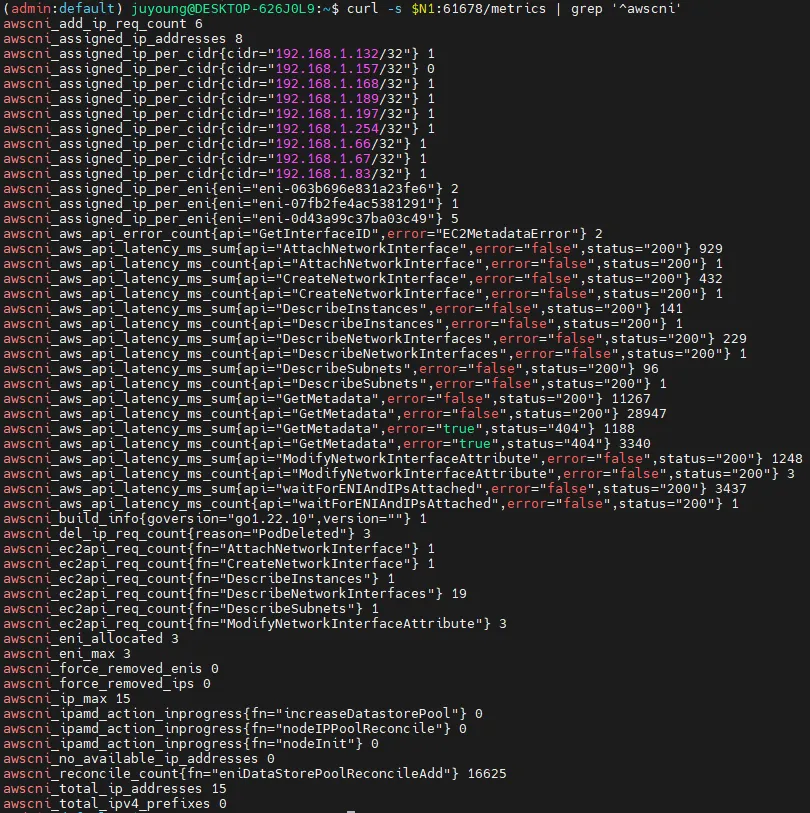
# AWS CNI의 메트릭 데이터를 직접 확인
curl -s $N1:61678/metrics | grep '^awscni'
결과 예시
awscni_add_ip_req_count 10
awscni_assigned_ip_addresses 8
awscni_assigned_ip_per_cidr{cidr="192.168.1.117/32"} 1
awscni_assigned_ip_per_cidr{cidr="192.168.1.131/32"} 1
awscni_assigned_ip_per_cidr{cidr="192.168.1.184/32"} 1
awscni_assigned_ip_per_cidr{cidr="192.168.1.210/32"} 0
awscni_assigned_ip_per_cidr{cidr="192.168.1.243/32"} 1
awscni_assigned_ip_per_cidr{cidr="192.168.1.247/32"} 1
awscni_assigned_ip_per_cidr{cidr="192.168.1.38/32"} 1- 대표적인 AWS CNI 메트릭
awscni_add_ip_req_count: 추가 IP 요청 횟수awscni_assigned_ip_addresses: 현재 할당된 IP 개수awscni_assigned_ip_per_cidr: 각 CIDR 블록에 할당된 IP 개수
PodMonitor가 정상적으로 적용되었는지 확인하려면, Prometheus에서 AWS CNI 메트릭을 조회해야 합니다.
5.5 Prometheus에서 AWS CNI Metrics 확인
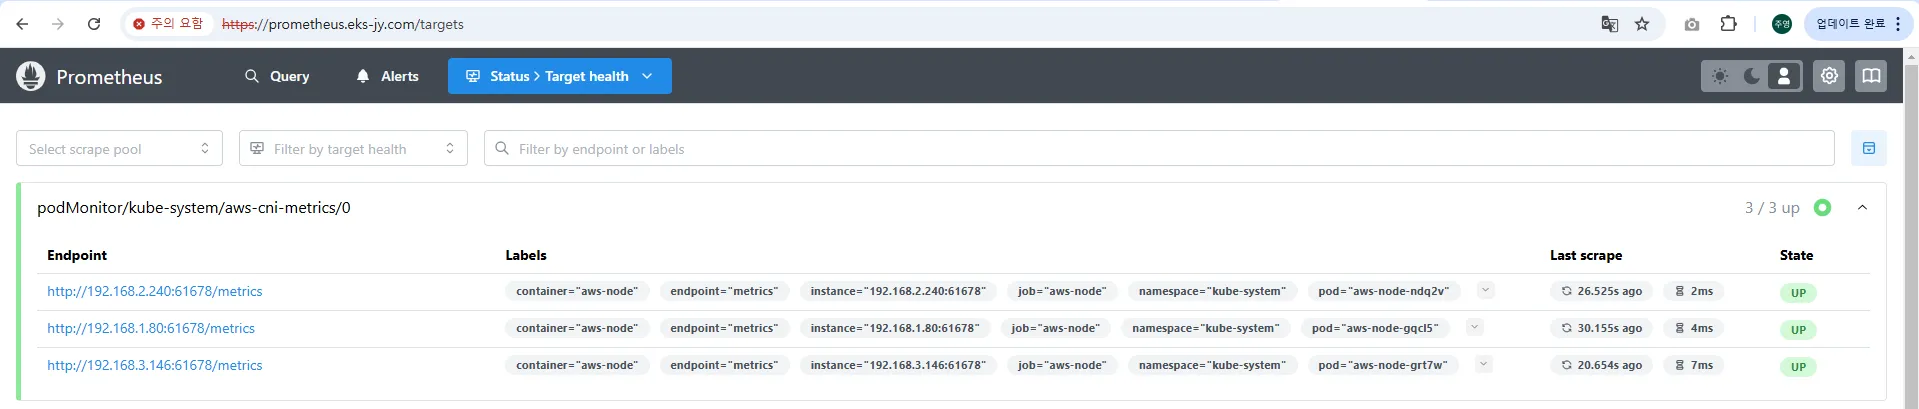
PodMonitor가 정상적으로 동작하면 Prometheus의 Target 목록에서 AWS CNI 메트릭 수집 여부를 확인할 수 있습니다.
Prometheus UI에서 aws-cni-metrics라는 Target이 추가되었는지 확인합니다.
6. 프로메테우스 기본 사용: 모니터링 및 그래프 조회
6.1 개요
Prometheus는 메트릭 기반의 모니터링 도구로, Kubernetes 클러스터 및 다양한 애플리케이션의 상태를 실시간으로 분석할 수 있습니다.
각 애플리케이션은 /metrics 엔드포인트를 통해 Prometheus가 수집할 수 있는 정보를 제공하며, 이를 기반으로 성능 모니터링 및 경고(Alerting) 기능을 수행할 수 있습니다.
6.2 모니터링 대상의 메트릭 수집
6.2.1 메트릭 엔드포인트와 Prometheus의 역할
- Prometheus는 HTTP GET 요청을 사용하여 메트릭을 수집합니다.
- 각 모니터링 대상이 되는 애플리케이션은
/metrics엔드포인트를 통해 내부 상태를 노출합니다. - Prometheus는 해당 정보를 TSDB(Time Series Database)에 저장하고 시계열 데이터를 기반으로 분석합니다.
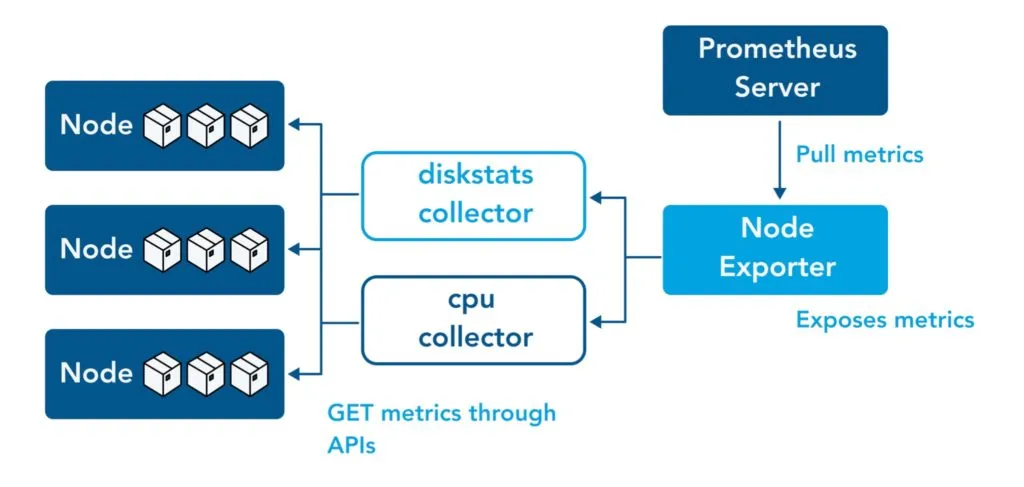
6.2.2 Prometheus와 Node Exporter
- Kubernetes 환경에서는 노드 상태 정보를 모니터링하기 위해
node-exporter를 사용합니다. node-exporter는 9100번 포트에서 실행되며, 각 노드의 CPU, 메모리, 네트워크 상태 등을 노출합니다.- Prometheus 서버는
http://<IP>:9100/metrics엔드포인트에 접근하여 데이터를 수집해야 합니다.
6.2.3 노드 메트릭 확인
다음 명령어를 실행하여 Prometheus가 메트릭을 수집할 수 있는지 확인할 수 있습니다.
# 아래 처럼 프로메테우스가 각 서비스의 포트 접속하여 메트릭 정보를 수집
# Kubernetes 클러스터 내의 노드 정보 확인
kubectl get node -owide
# Node Exporter 서비스 및 엔드포인트 확인
kubectl get svc,ep -n monitoring kube-prometheus-stack-prometheus-node-exporter

# (노드 익스포터 경우) 노드의 9100번 포트의 /metrics 접속 시 다양한 메트릭 정보를 확인할수 있음 : 마스터 이외에 워커노드도 확인 가능
ssh ec2-user@$N1 curl -s localhost:9100/metrics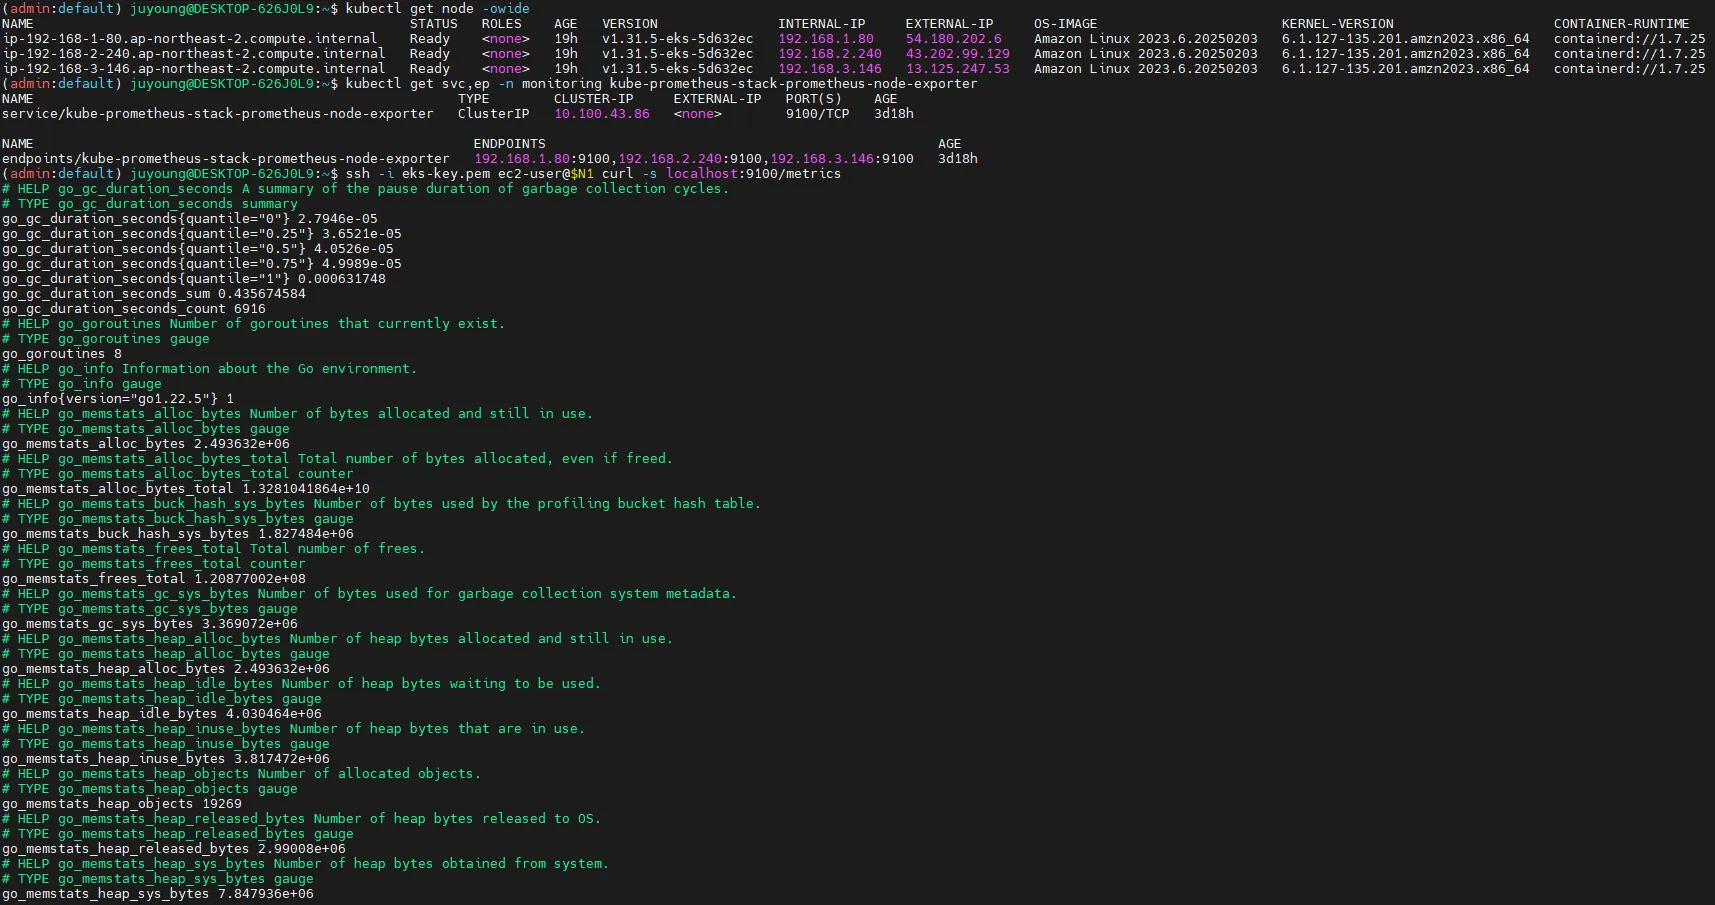
6.3 Prometheus 웹 UI 접속 및 주요 기능
6.3.1 Prometheus Ingress 설정 확인
Prometheus가 웹 브라우저에서 접근 가능하도록 Ingress를 설정해야 합니다.
# Ingress 설정 확인
kubectl get ingress -n monitoring kube-prometheus-stack-prometheus
kubectl describe ingress -n monitoring kube-prometheus-stack-prometheus

# Prometheus 웹 UI 접속 URL 확인
echo -e "Prometheus Web URL = https://prometheus.$MyDomain"
open "https://prometheus.$MyDomain" macOS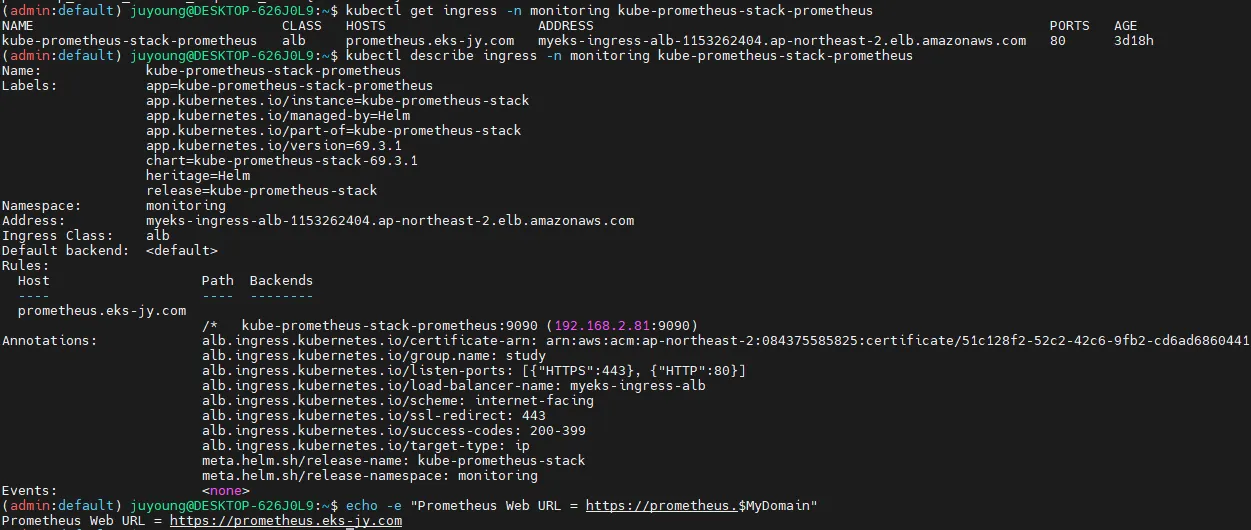
Ingress가 정상적으로 설정되었다면, 브라우저에서 https://prometheus.$MyDomain로 접속할 수 있습니다.
6.3.2 Prometheus 웹 UI 주요 메뉴

- 쿼리(Query)
- Prometheus의 자체 쿼리 언어인 PromQL을 사용하여 메트릭을 조회합니다.
- 시계열 데이터를 기반으로 특정 값을 확인하거나 그래프로 시각화할 수 있습니다.
- 경고(Alerts)
- 사전에 정의한 Prometheus Rules에 따라 특정 임계값을 초과하면 경고를 생성합니다.
- Alertmanager와 연동하여 Slack, Email 등으로 알림을 보낼 수 있습니다.
- 상태(Status)
- 현재 Prometheus의 실행 상태, 모니터링 대상(Targets), 설정(Configuration) 등을 확인할 수 있습니다.
- 쿼리 입력 옵션
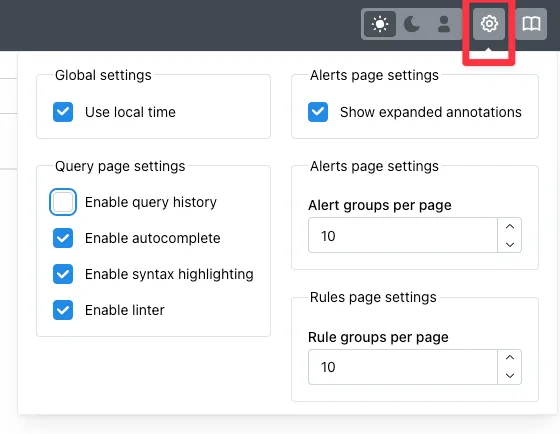
- Use local time : 출력 시간을 로컬 타임으로 변경
- Enable query history : PromQL 쿼리 히스토리 활성화
- Enable autocomplete : 자동 완성 기능 활성화
- Enable highlighting : 하이라이팅 기능 활성화. Syntax Highlight
- Enable linter : 문법 오류 감지, 자동 코스 스타일 체크
6.4. Prometheus 설정 및 상태 확인
6.4.1 Prometheus 설정(Configuration) 확인
Prometheus의 설정 및 동작 상태를 확인할 수 있습니다.
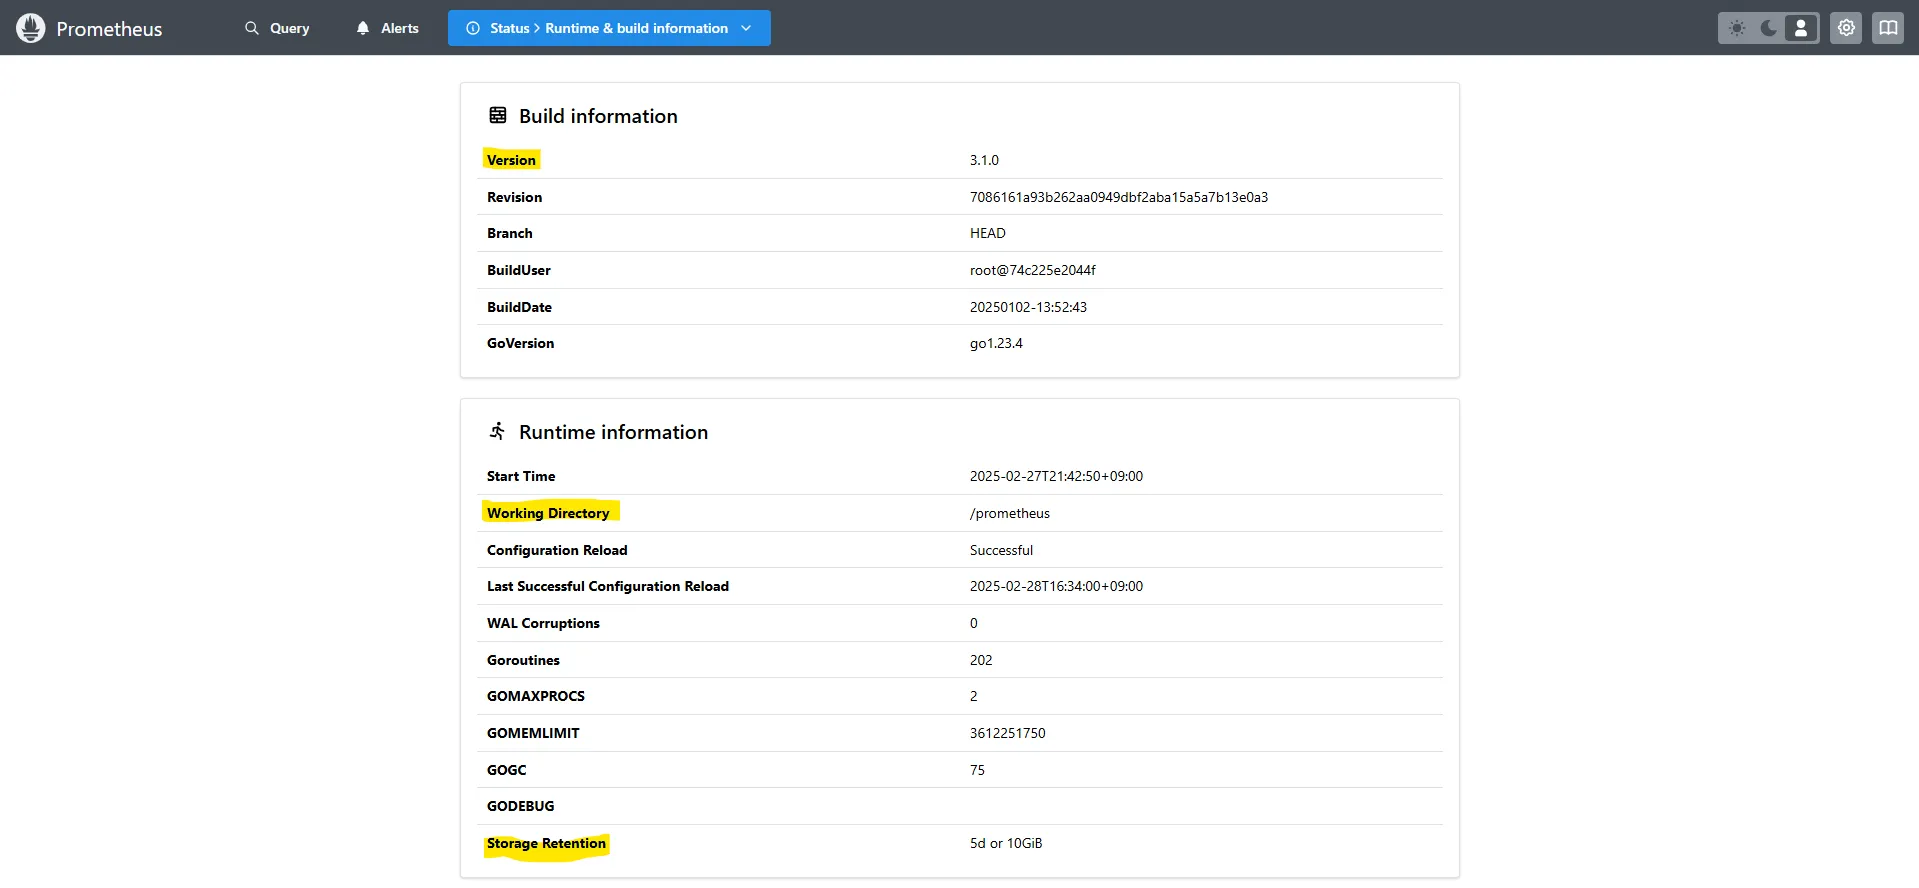
-
Runtime & Build Information
- Prometheus 웹 > Status > Runtime & build information
- Prometheus의 실행 상태와 빌드 정보를 확인할 수 있습니다.
- 데이터 보존 기간(Storage retention)을 확인하여 메트릭이 보관되는 일수를 관리할 수 있습니다.
-
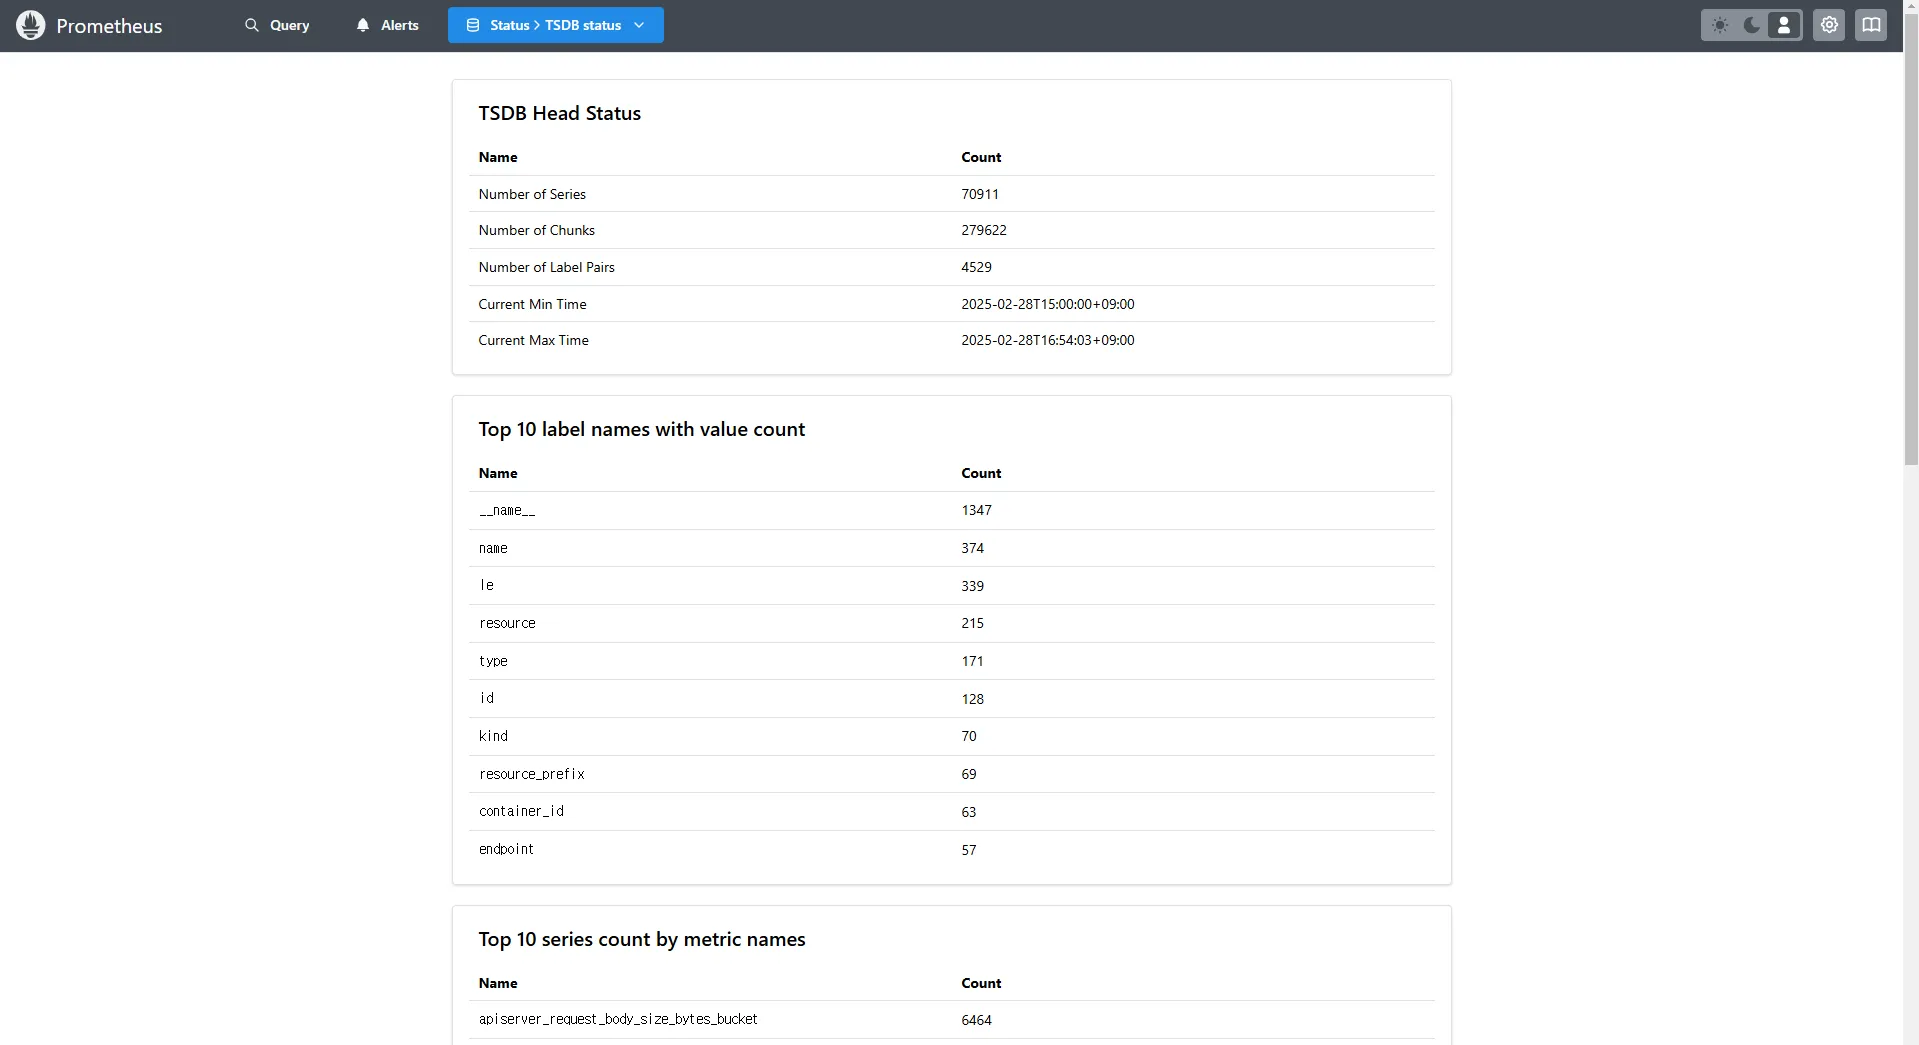
TSDB status
- Prometheus 웹 > Status > TSDB status
- TSDB(Time Series Database)의 상태를 확인하여 저장된 시계열 데이터를 관리할 수 있습니다.
-
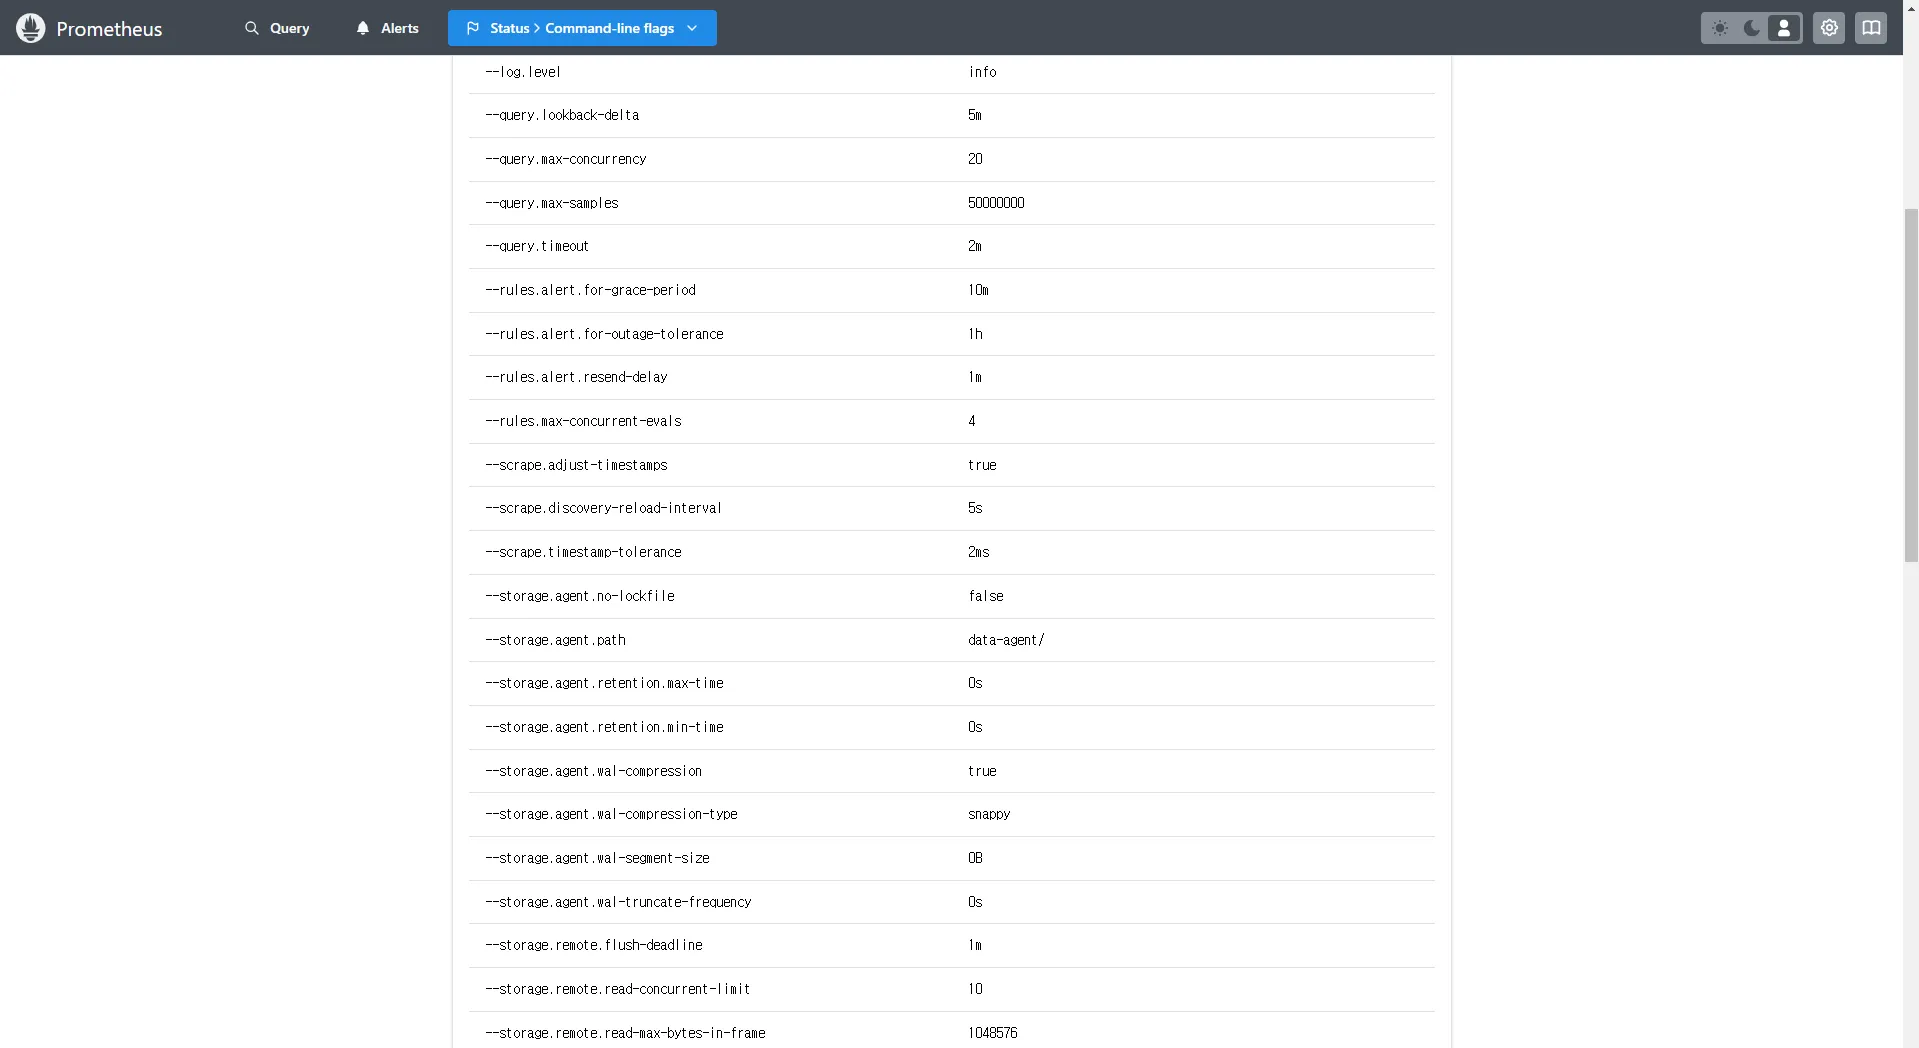
Command-Line Flags
- Prometheus 웹 > Status > Command-line flags
- Prometheus가 실행될 때 적용된 설정 값을 확인할 수 있습니다.
- 주요 설정:
--log.level: 로그 레벨 설정 (info)--storage.tsdb.retention.size: TSDB 저장 용량 (10GiB)--storage.tsdb.retention.time: 메트릭 저장 기간 (5d)
-
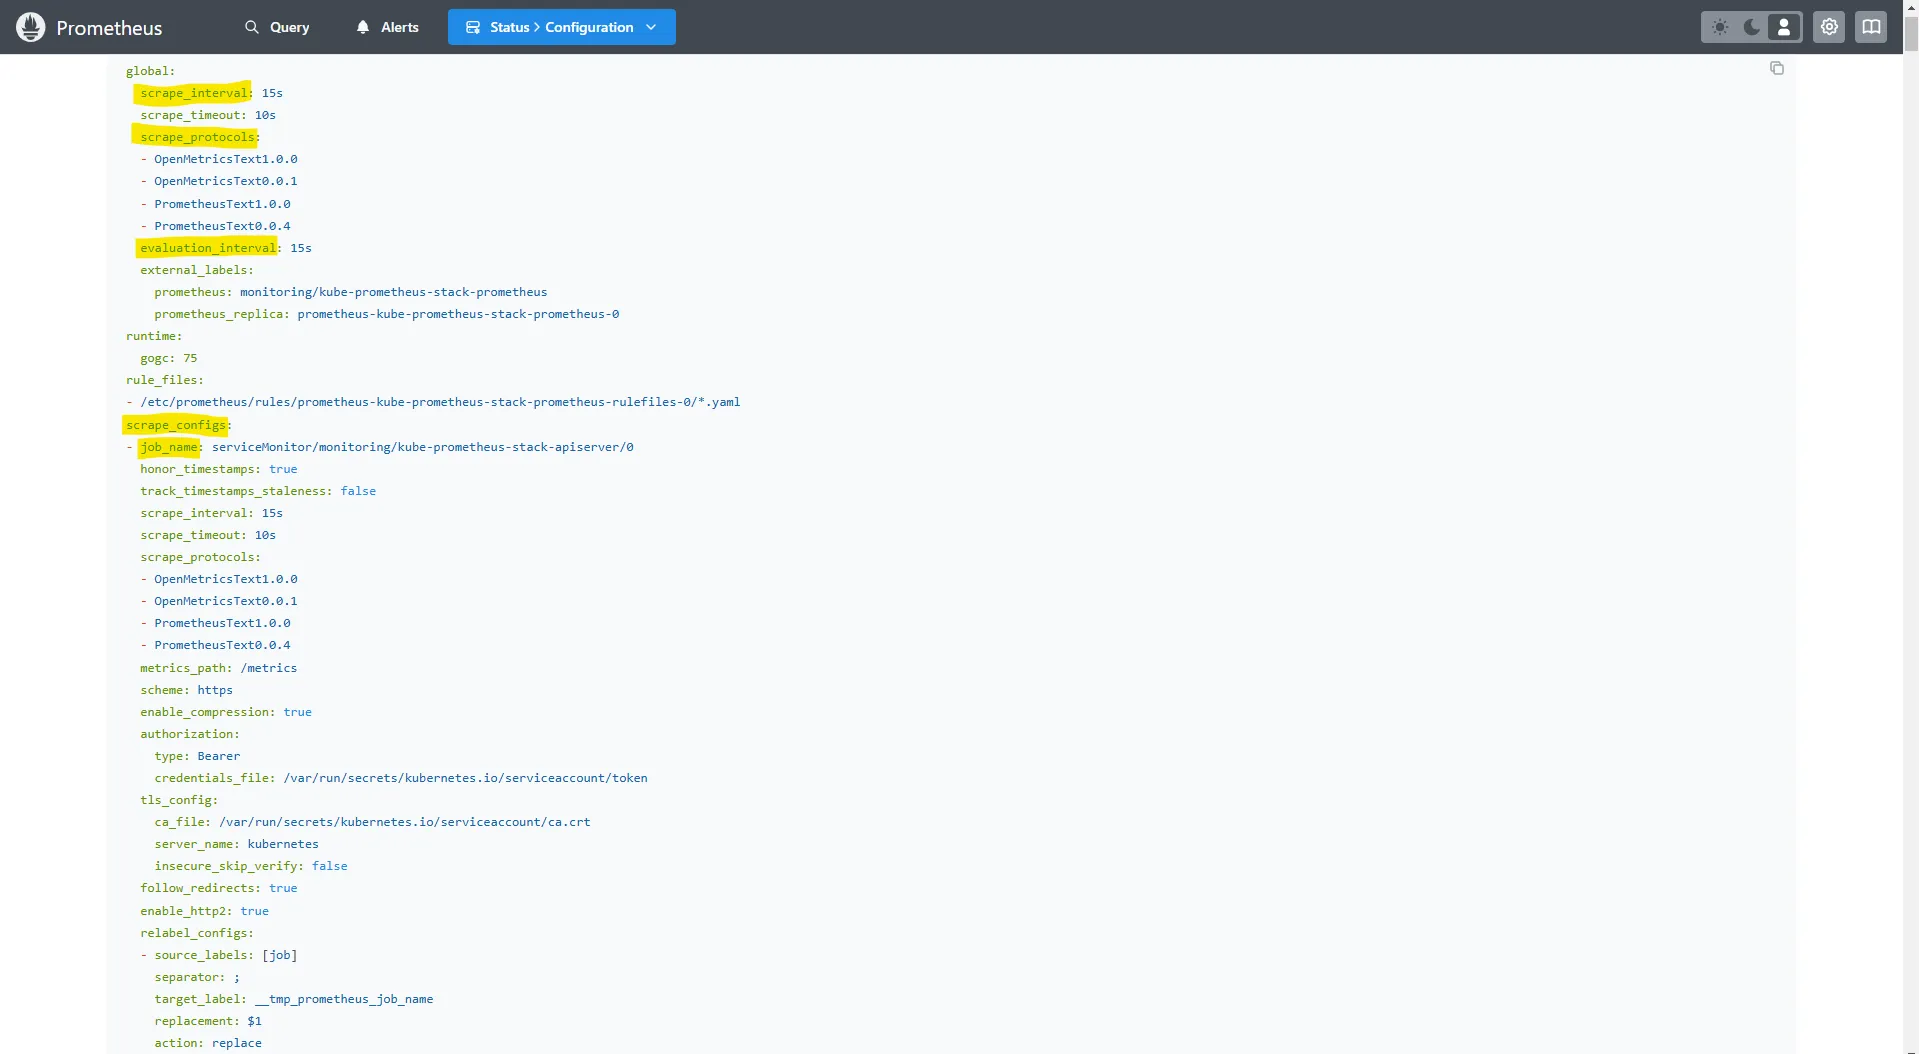
Configuration
- Prometheus 웹 > Status > Configuration
global:
  scrape_interval: 15s     # 메트릭 가져오는(scrape) 주기
  scrape_timeout: 10s      # 메트릭 가져오는(scrape) 타임아웃
  scrape_protocols:        # Prometheus도 있지만 OpenMetrics나 OpenTelemetry 메트릭의 프로토콜도 지원할 수 있게끔 제공됨
  - OpenMetricsText1.0.0
  - OpenMetricsText0.0.1
  - PrometheusText1.0.0
  - PrometheusText0.0.4
  evaluation_interval: 15s # alert 보낼지 말지 판단하는 주기
...
scrape_configs:
...
- job_name: serviceMonitor/monitoring/kube-prometheus-stack-prometheus-node-exporter/0   # serviceMonitor로 동적으로 job이 추가됨. 동적으로 내가 수집하는 대상들이 추가됨. 적용되려면 리로드를 해야하는데 자동 reloader가 있음
  scrape_interval: 30s
  scrape_timeout: 10s
  metrics_path: /metrics
  scheme: http   # http or https. 인증이 추가될 수 있음
  ...
  relabel_configs:
  - source_labels: [job]
    separator: ;
    target_label: __tmp_prometheus_job_name
    replacement: $1
    action: replace
  - source_labels: [__meta_kubernetes_service_label_app_kubernetes_io_instance, __meta_kubernetes_service_labelpresent_app_kubernetes_io_instance]
    separator: ;
    regex: (kube-prometheus-stack);true   # 라벨 등에 이런 값이 없으면 등록이 안된다는 규칙
    replacement: $1
    action: keep
  - source_labels: [__meta_kubernetes_service_label_app_kubernetes_io_name, __meta_kubernetes_service_labelpresent_app_kubernetes_io_name]
    separator: ;
    regex: (prometheus-node-exporter);true
    replacement: $1
    action: keep
  ...
kubernetes_sd_configs:    # 서비스 디스커버리(SD) 방식을 이용하고, 파드의 엔드포인트 List 자동 반영
  - role: endpoints       # 서비스에 연결된 엔드포인트(Pod IP + Port) 탐색
    kubeconfig_file: ""   # Prometheus가 실행 중인 환경의 기본 kubeconfig 사용
    follow_redirects: true # 엔드포인트를 변경할 경우 이를 따라감
    enable_http2: true
    namespaces:
      own_namespace: false # 자신이 실행 중인 네임스페이스가 아닌 곳에서도 탐색 가능
      names:
      - monitoring        # 서비스 엔드포인트가 속한 네임 스페이스 이름을 지정 : monitoring 네임스페이스에 있는 서비스만 타겟팅, 서비스 네임스페이스가 속한 포트 번호를 구분하여 메트릭 정보를 가져옴
...


- job_name: podMonitor/kube-system/aws-cni-metrics/0
  honor_timestamps: true
  ...
  relabel_configs:
  - source_labels: [job]
    separator: ;
    target_label: __tmp_prometheus_job_name
    replacement: $1
    action: replace # job 라벨 값을 __tmp_prometheus_job_name에 저장
  - source_labels: [__meta_kubernetes_pod_label_k8s_app, __meta_kubernetes_pod_labelpresent_k8s_app]
    separator: ;
    regex: (aws-node);true
    replacement: $1
    action: keep    # Pod의 k8s_app 라벨 값이 aws-node인 경우만 유지
  ...
kubernetes_sd_configs:
- role: pod               # 클러스터 내 모든 개별 Pod 탐색
  kubeconfig_file: ""
  follow_redirects: true
  enable_http2: true
  namespaces:
    own_namespace: false
    names:
    - kube-system
...
Prometheus는 scrape_configs 설정을 통해 특정 대상의 메트릭을 주기적으로 수집합니다.
-
Service Discovery
-
Prometheus 웹 > Status > Service Discovery
-
Prometheus가 모니터링할 대상을 자동으로 탐색하여 수집하는 기능
-
Kubernetes 환경에서는 Prometheus가 ServiceMonitor와 PodMonitor를 활용하여 대상(Service 및 Pod)을 자동으로 발견하고, 해당 대상의 메트릭을 수집할 수 있도록 설정
-
Service Discovery 동작 방식
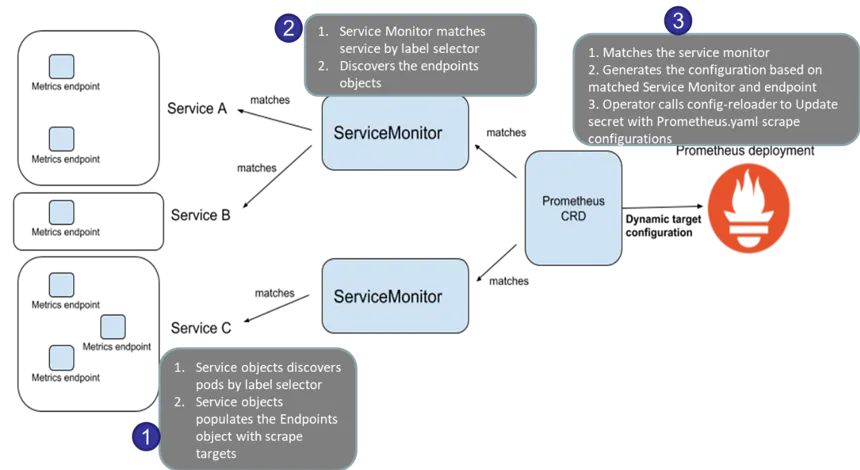
- Prometheus 설정 파일(Configuration)에서 ServiceMonitor 또는 PodMonitor가 정의되어 있는지 확인합니다.
- 설정된 기준에 맞는 서비스 또는 파드(Pod)를 Kubernetes 클러스터에서 검색합니다.
- 검색된 서비스 또는 파드의 메트릭 엔드포인트가 정상적으로 열려 있는지 확인합니다.
- 정상적인 엔드포인트가 확인되면, 해당 대상을 Prometheus의 Targets 목록에 추가합니다.
- 이후 Prometheus는 주기적으로 해당 대상의 메트릭을 스크래핑(scrape)하여 저장합니다.
-
ServiceMonitor 및 PodMonitor의 차이점
- ServiceMonitor: Kubernetes의 Service를 기준으로 대상(Service)을 식별하여 메트릭을 수집
- PodMonitor: Kubernetes의 Pod를 직접 모니터링하며, 특정 Pod에 대한 메트릭을 수집할 때 사용
-
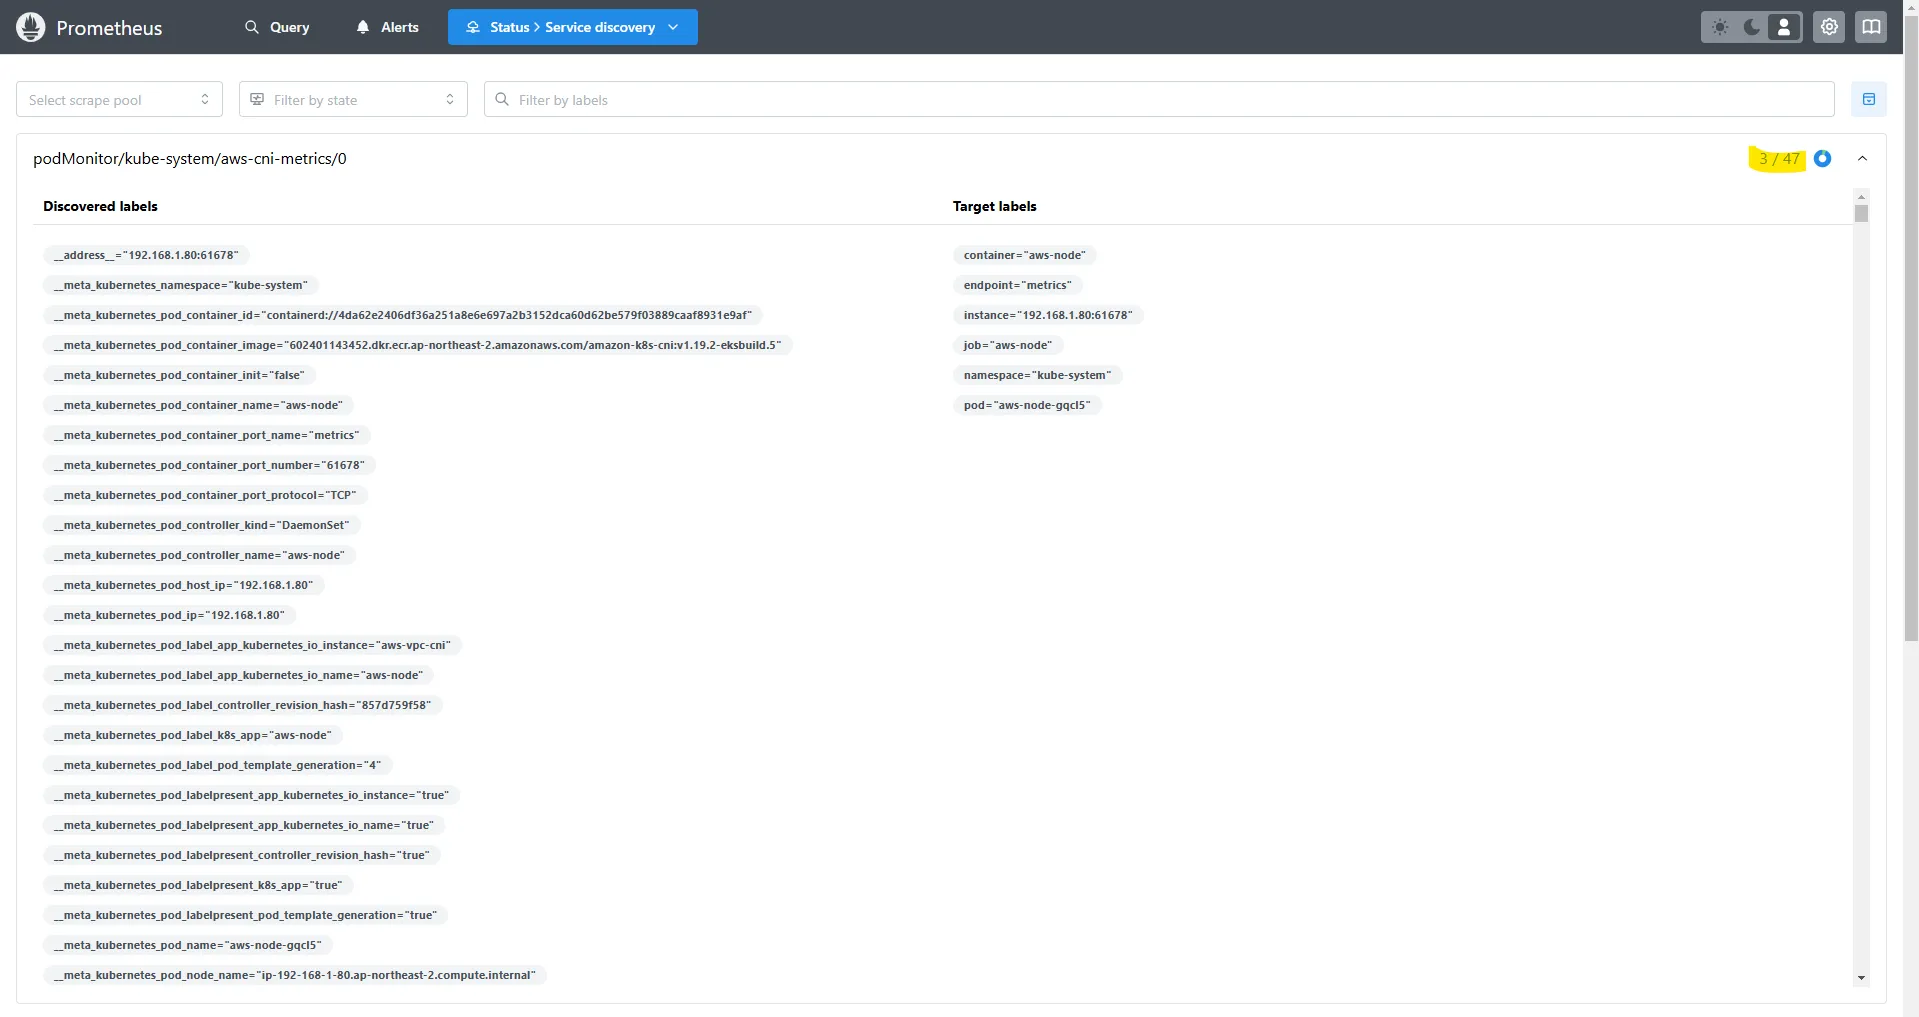
=> 특정 네임스페이스에 47개의 Pod이 있지만, 라벨이 일치하는 Pod이 3개뿐이라면 3/47 개만 발견되고 나머지는 제외됩니다.
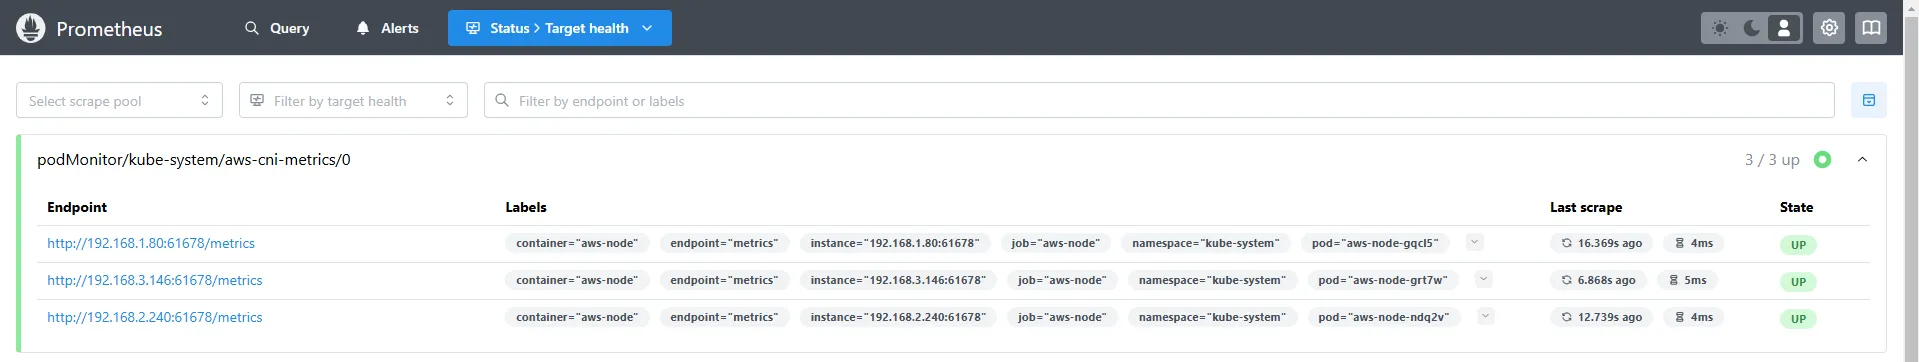
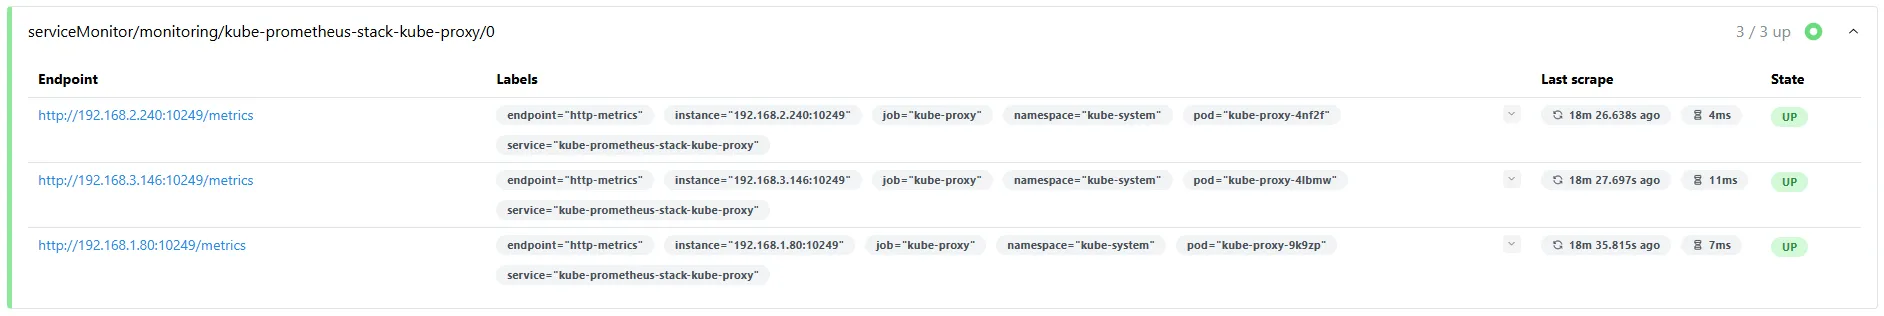
6.4.2 Prometheus의 전체 메트릭 대상(Targets) 확인
- Target health
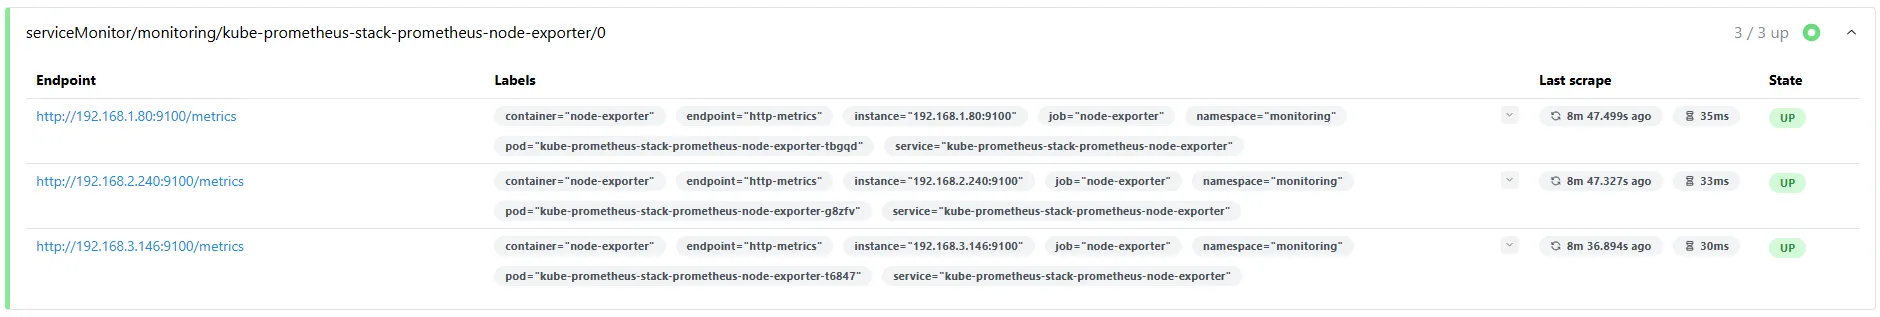
- Prometheus 웹 > Status > Target health
- 해당 스택은 ‘node-exporter’, cAdvisor, 쿠버네티스 전반적인 현황 이외에 다양한 메트릭을 포함
# serviceMonitor/monitoring/kube-prometheus-stack-kube-proxy/0 (3/3 up) 중 노드1에 Endpoint 접속 확인 (접속 주소는 실습 환경에 따라 다름)
ssh $N1 curl -s http://localhost:10249/metrics
rest_client_response_size_bytes_bucket{host="006fc3f3f0730a7fb3fdb3181f546281.gr7.ap-northeast-2.eks.amazonaws.com",verb="POST",le="4.194304e+06"} 1
rest_client_response_size_bytes_bucket{host="006fc3f3f0730a7fb3fdb3181f546281.gr7.ap-northeast-2.eks.amazonaws.com",verb="POST",le="1.6777216e+07"} 1
rest_client_response_size_bytes_bucket{host="006fc3f3f0730a7fb3fdb3181f546281.gr7.ap-northeast-2.eks.amazonaws.com",verb="POST",le="+Inf"} 1
rest_client_response_size_bytes_sum{host="006fc3f3f0730a7fb3fdb3181f546281.gr7.ap-northeast-2.eks.amazonaws.com",verb="POST"} 626
rest_client_response_size_bytes_count{host="006fc3f3f0730a7fb3fdb3181f546281.gr7.ap-northeast-2.eks.amazonaws.com",verb="POST"} 1
...
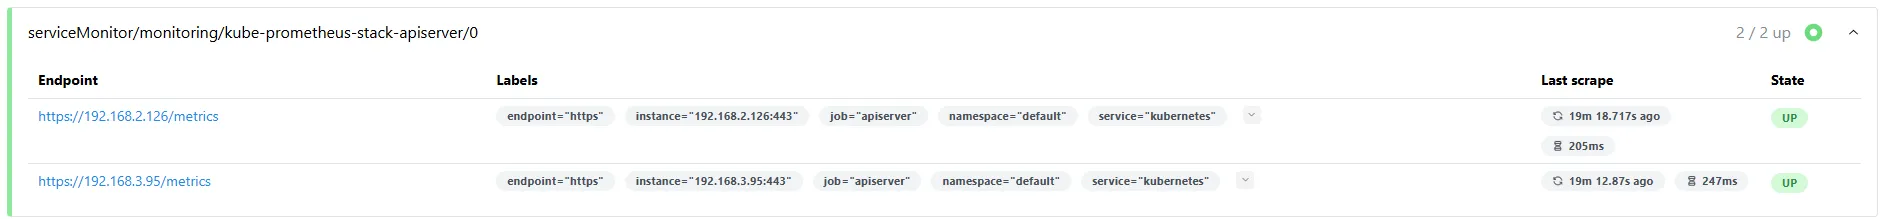
# [운영서버 EC2] serviceMonitor/monitoring/kube-prometheus-stack-api-server/0 (2/2 up) 중 Endpoint 접속 확인 (접속 주소는 실습 환경에 따라 다름)
>> 해당 IP주소는 어디인가요?, 왜 apiserver endpoint는 2개뿐인가요? , 아래 메트릭 수집이 되게 하기 위해서는 어떻게 하면 될까요?
curl -s https://192.168.1.53/metrics | tail -n 5
...
=> owned-eni
# [운영서버 EC2] 그외 다른 타켓의 Endpoint 로 접속 확인 가능 : 예시) 아래는 coredns 의 Endpoint 주소 (접속 주소는 실습 환경에 따라 다름)
curl -s http://192.168.1.75:9153/metrics | tail -n 5
# TYPE process_virtual_memory_bytes gauge
process_virtual_memory_bytes 7.79350016e+08
# HELP process_virtual_memory_max_bytes Maximum amount of virtual memory available in bytes.
# TYPE process_virtual_memory_max_bytes gauge
process_virtual_memory_max_bytes 1.8446744073709552e+19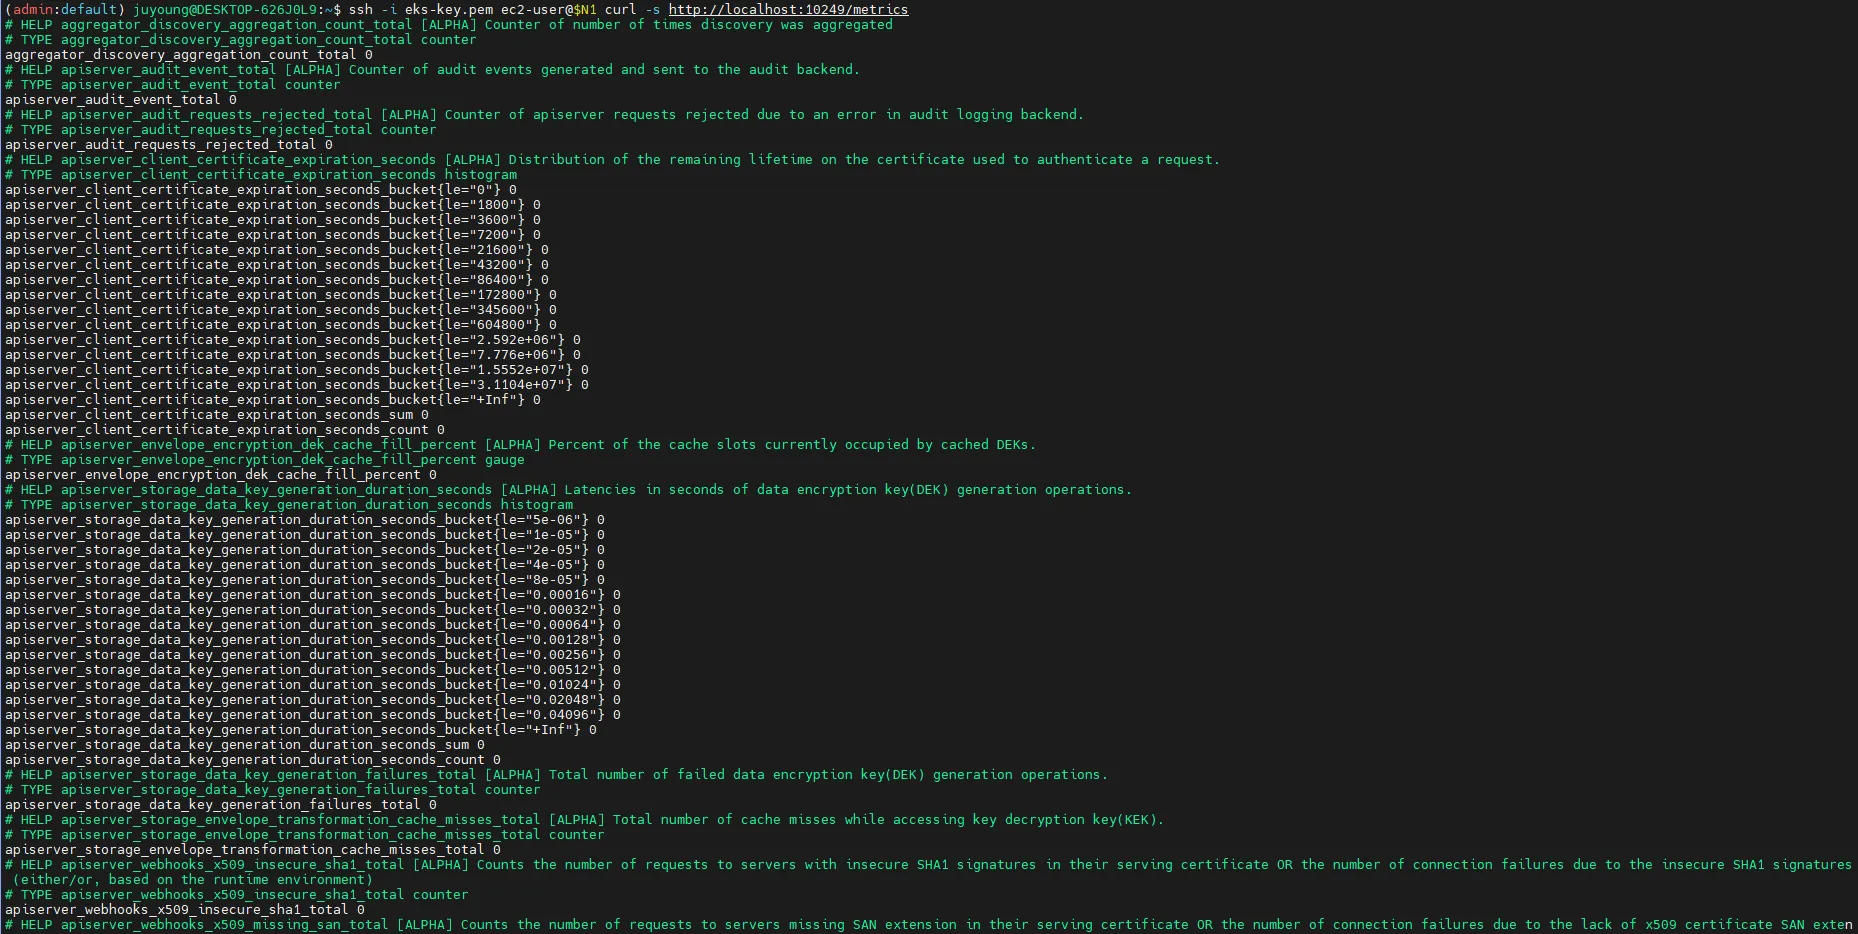
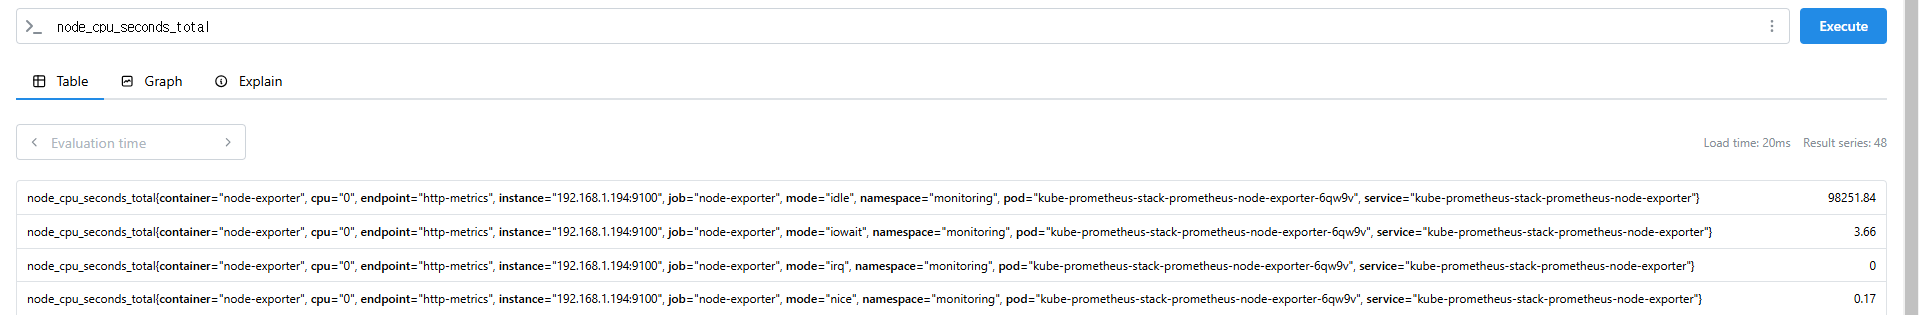
6.4.3 PromQL을 사용한 메트릭 및 그래프 조회
# 클러스터 전체 CPU 사용량
node_cpu_seconds_total
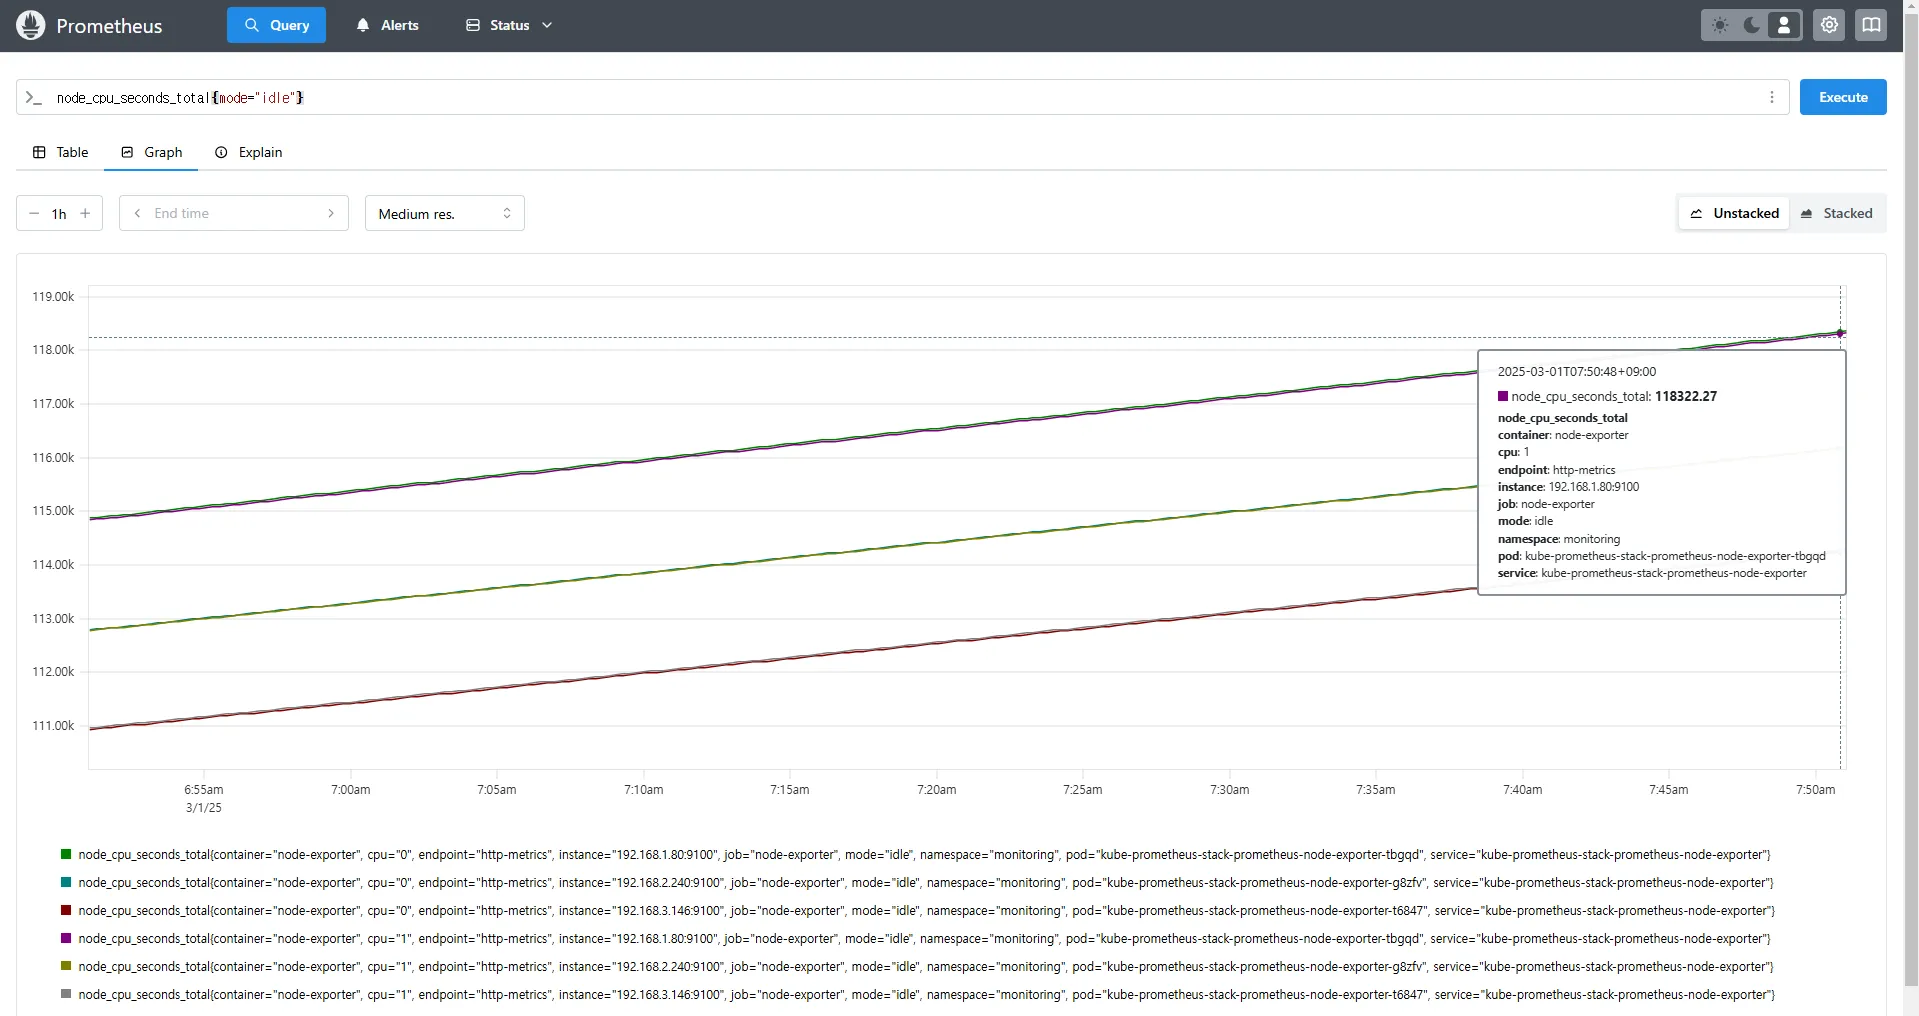
# 특정 모드(CPU Idle)만 필터링
node_cpu_seconds_total{mode="idle"}
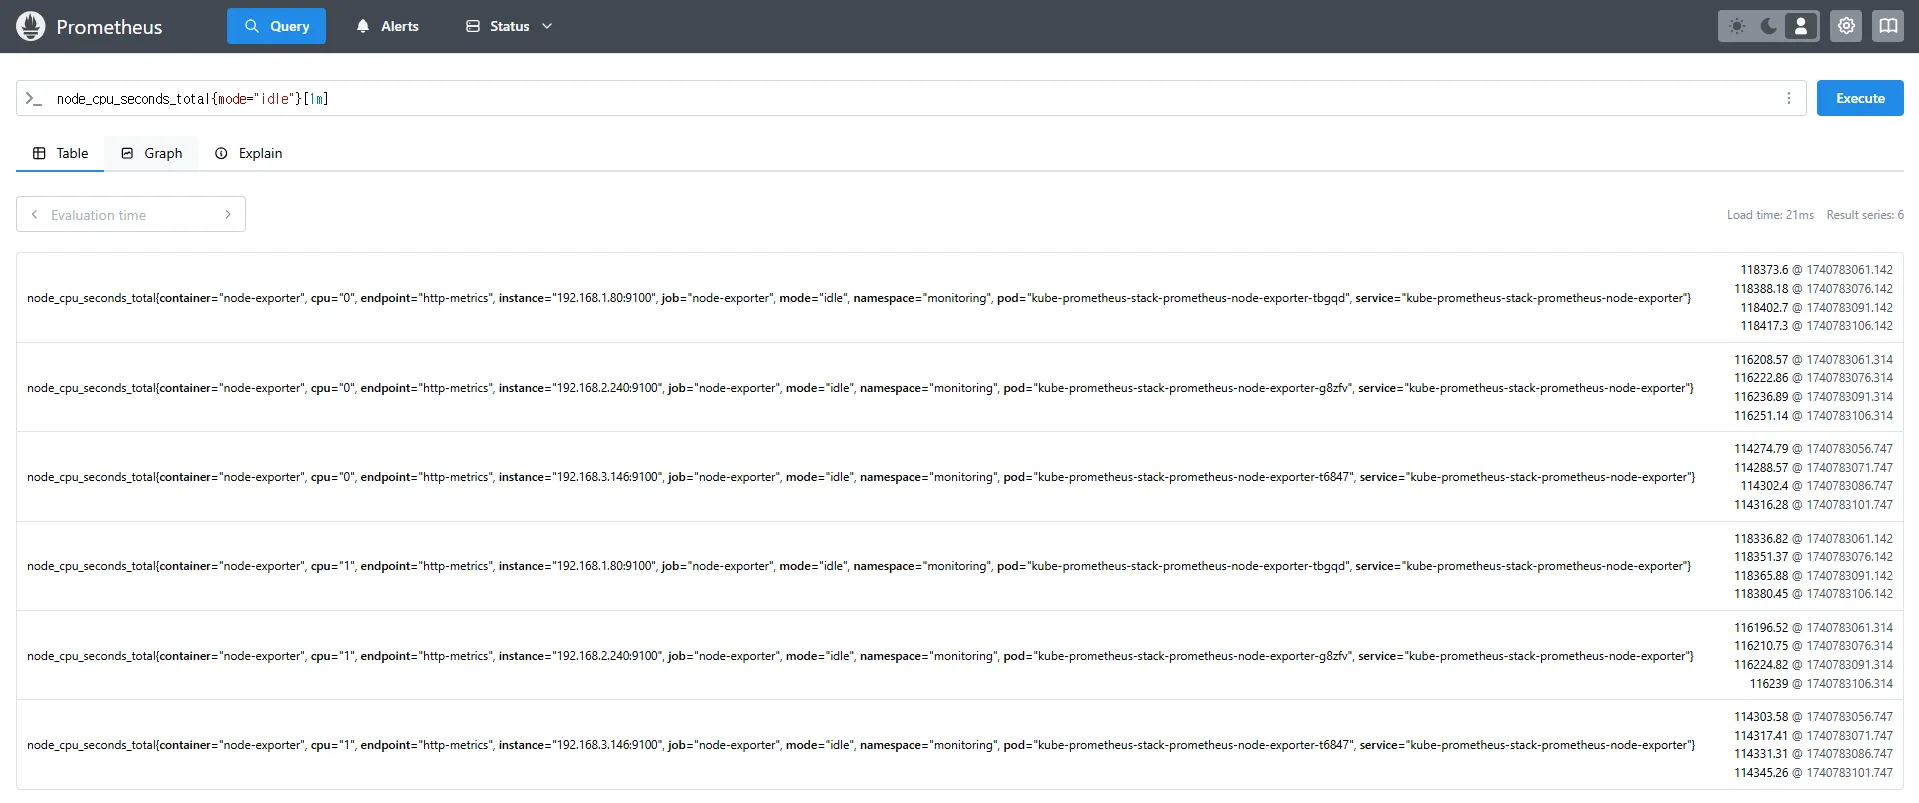
# 지난 1분 동안의 CPU Idle 상태 변화량
(node_cpu_seconds_total{mode="idle"}[1m])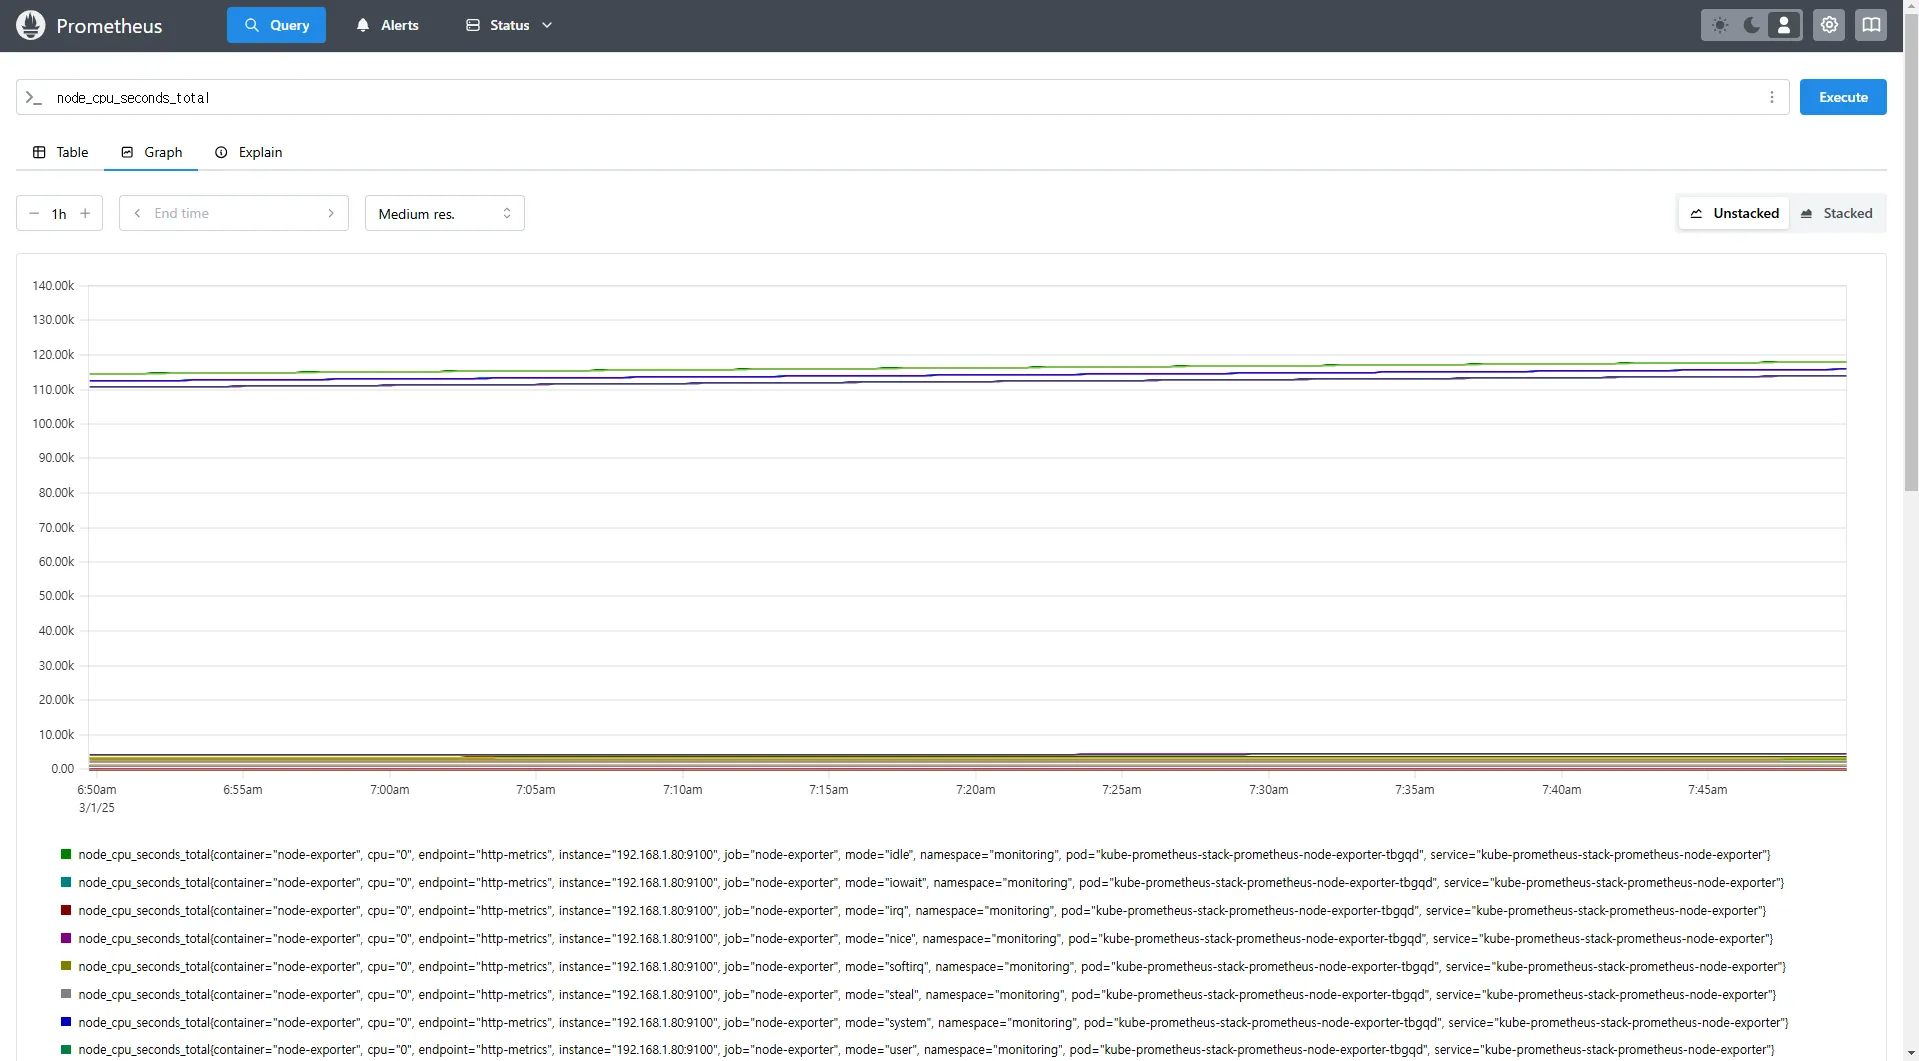
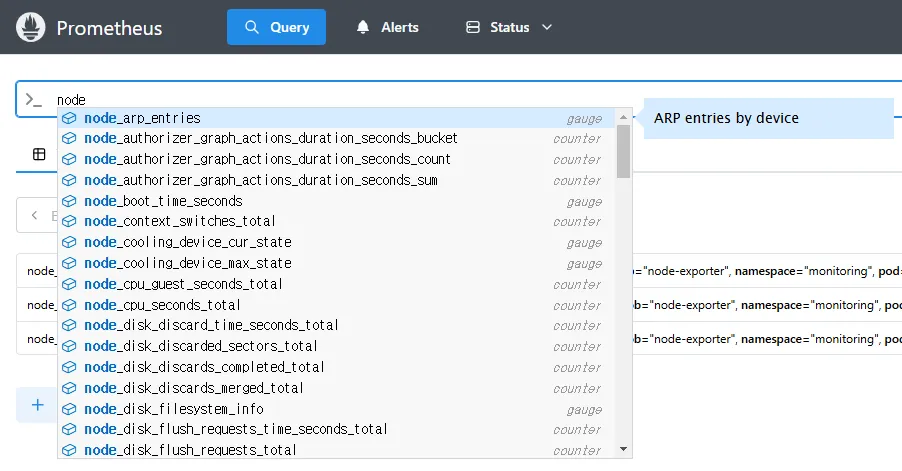
# 노드 메트릭
node 입력 후 자동 출력되는 메트릭 확인 후 선택
node_boot_time_seconds
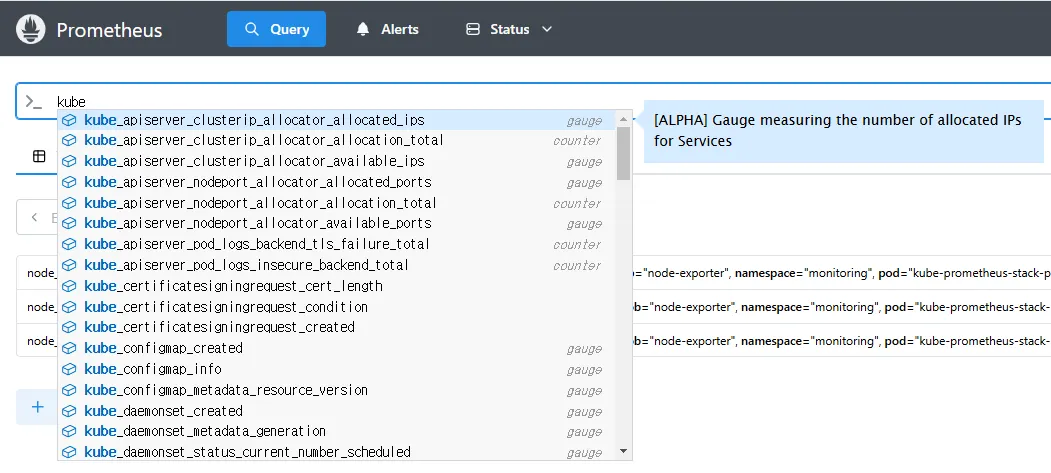
# kube 메트릭
kube 입력 후 자동 출력되는 메트릭 확인 후 선택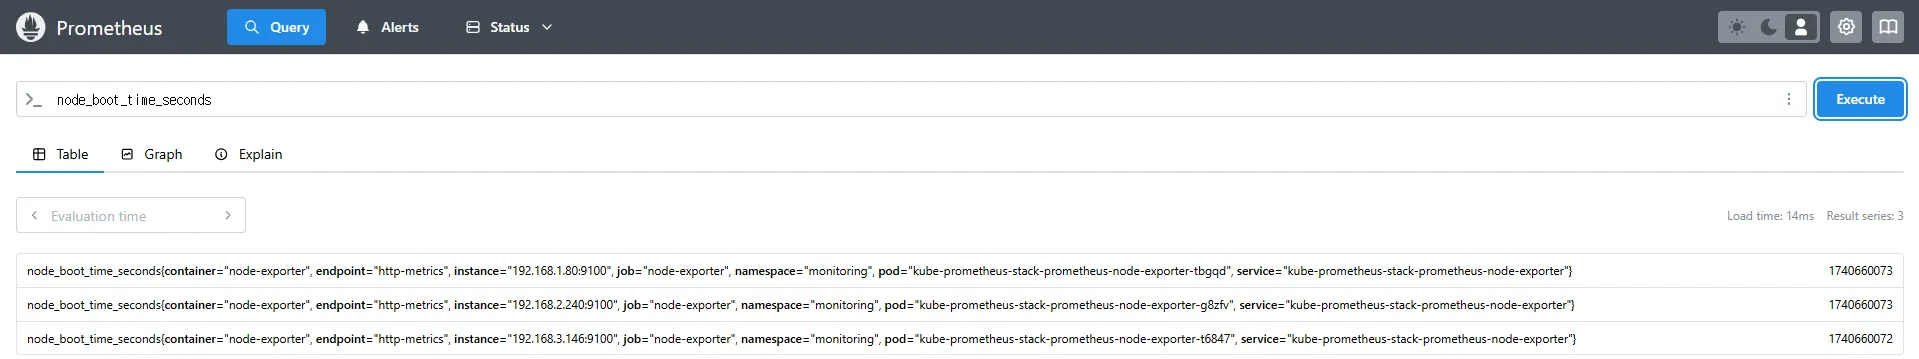
7. Prometheus 중급 쿼리: node-exporter, kube-state-metrics, kube-proxy
Kubernetes 환경에서 Prometheus를 활용하여 다양한 시스템 및 애플리케이션의 메트릭을 수집할 수 있습니다. 이 문서에서는 node-exporter, kube-state-metrics, kube-proxy를 활용하여 Kubernetes 클러스터 내에서 시스템 및 애플리케이션 상태를 모니터링하는 방법을 설명합니다.
7.1 Node Exporter: 시스템 메트릭 수집
7.1.1 Node Exporter 개요
Node Exporter는 Prometheus가 Linux 시스템의 다양한 하드웨어 및 운영 체제(OS) 메트릭을 수집할 수 있도록 지원하는 모니터링 도구입니다.
주요 기능은 다음과 같습니다.
- /proc, /sys 디렉터리의 데이터를 기반으로 CPU, 메모리, 디스크, 네트워크 등의 시스템 메트릭을 수집합니다.
- Prometheus 서버가 주기적으로 데이터를 스크래핑할 수 있도록 웹 엔드포인트(
:9100/metrics)를 제공합니다.
7.1.2 Node Exporter 쿼리 예제
아래 PromQL 쿼리를 활용하여 Node Exporter의 주요 메트릭을 확인할 수 있습니다.
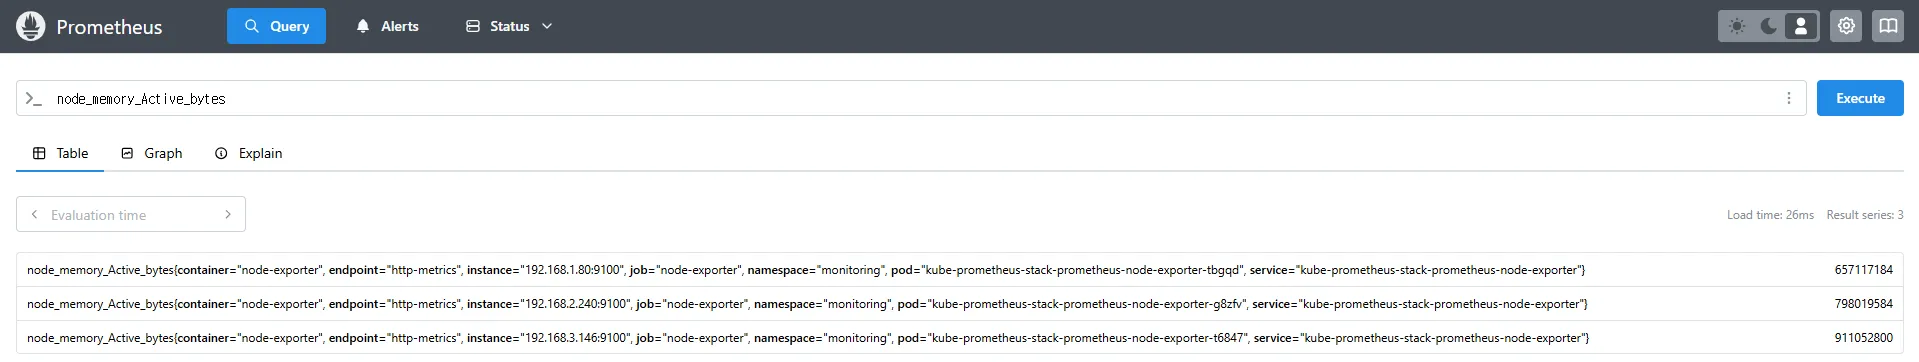
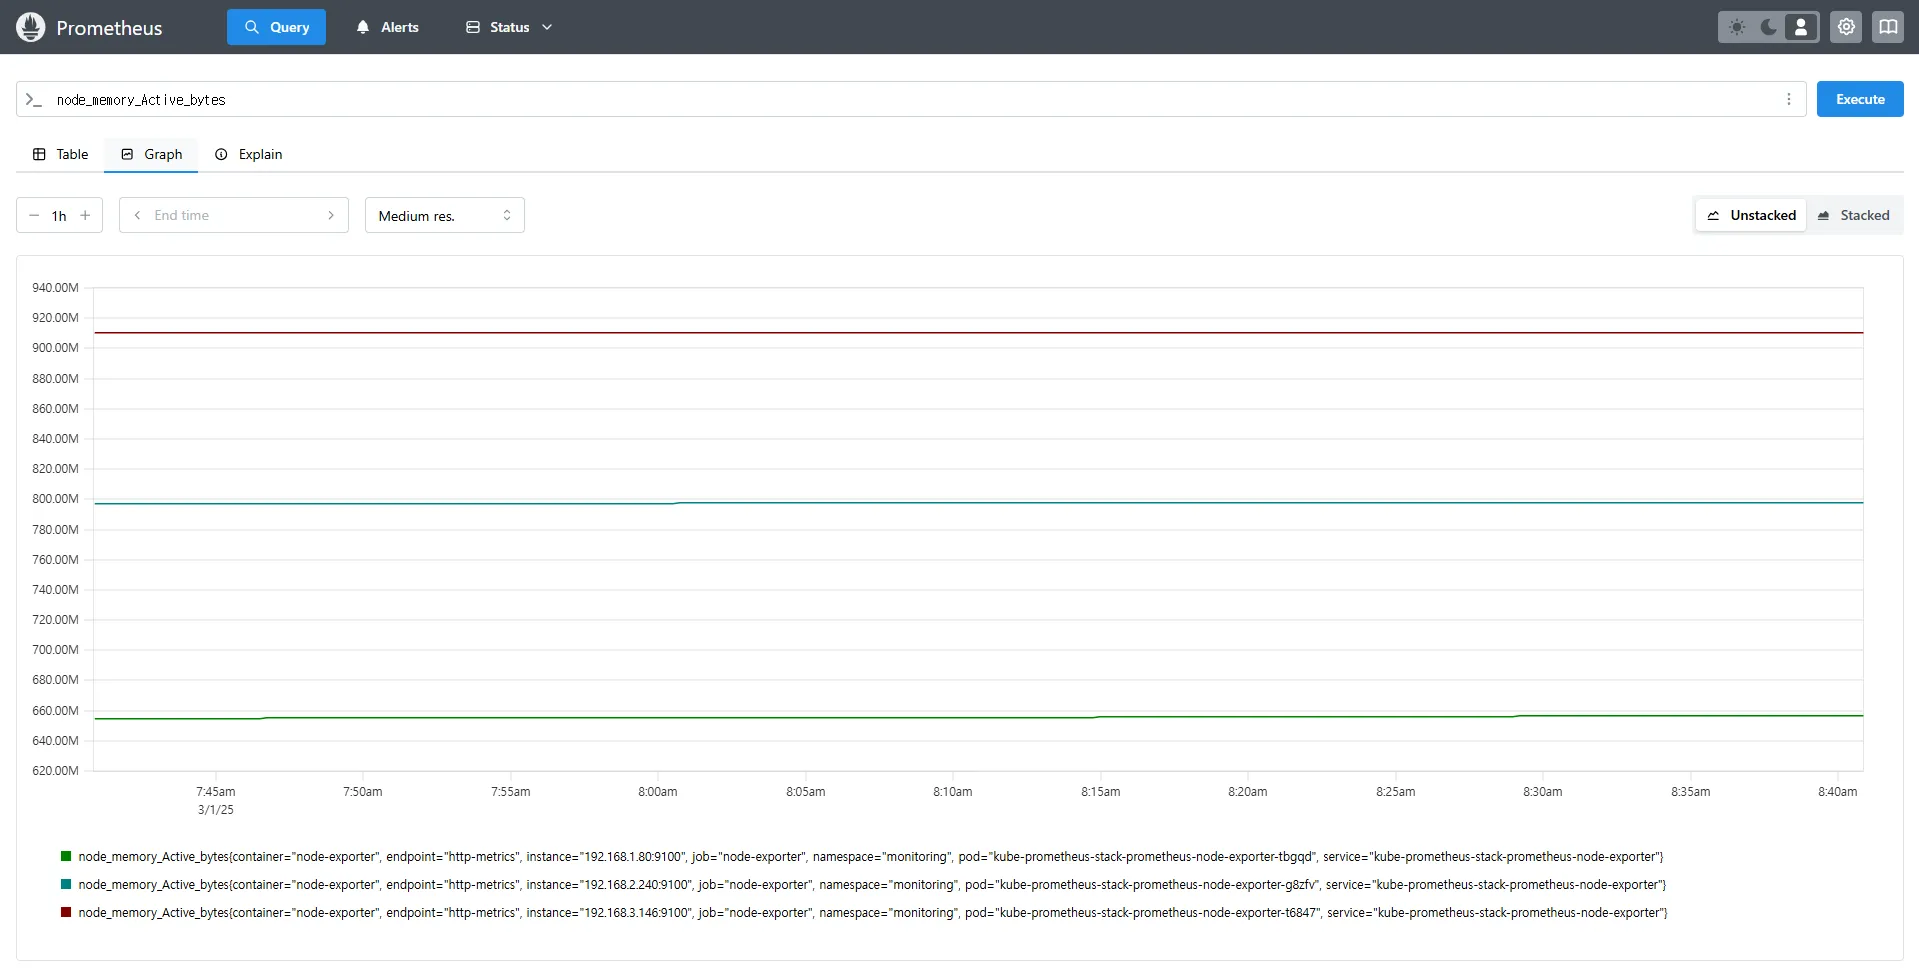
# Table 아래 쿼리 입력 후 Execute 클릭 -> Graph 확인
## 출력되는 메트릭 정보는 node-exporter 를 통해서 노드에서 수집된 정보
node_memory_Active_bytes
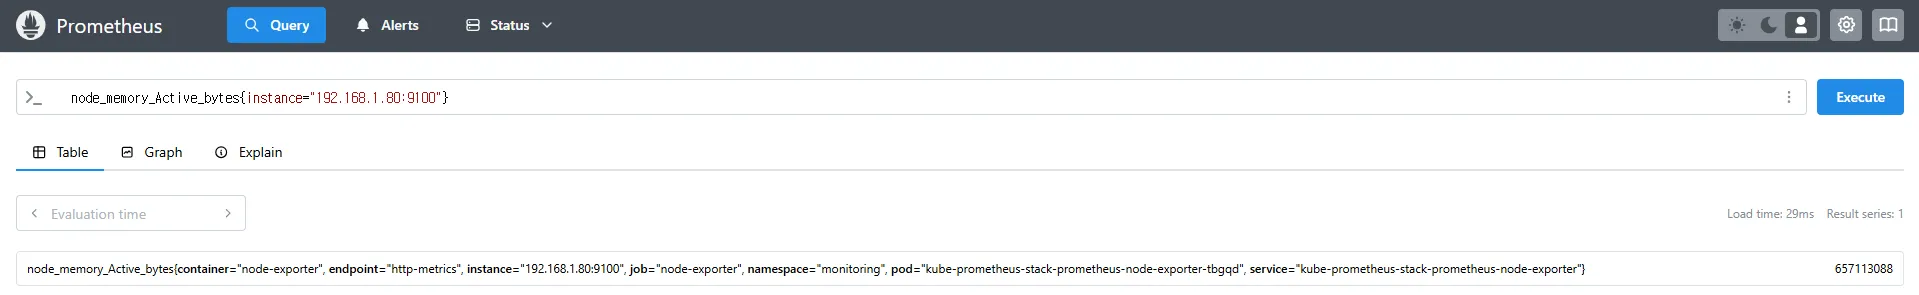
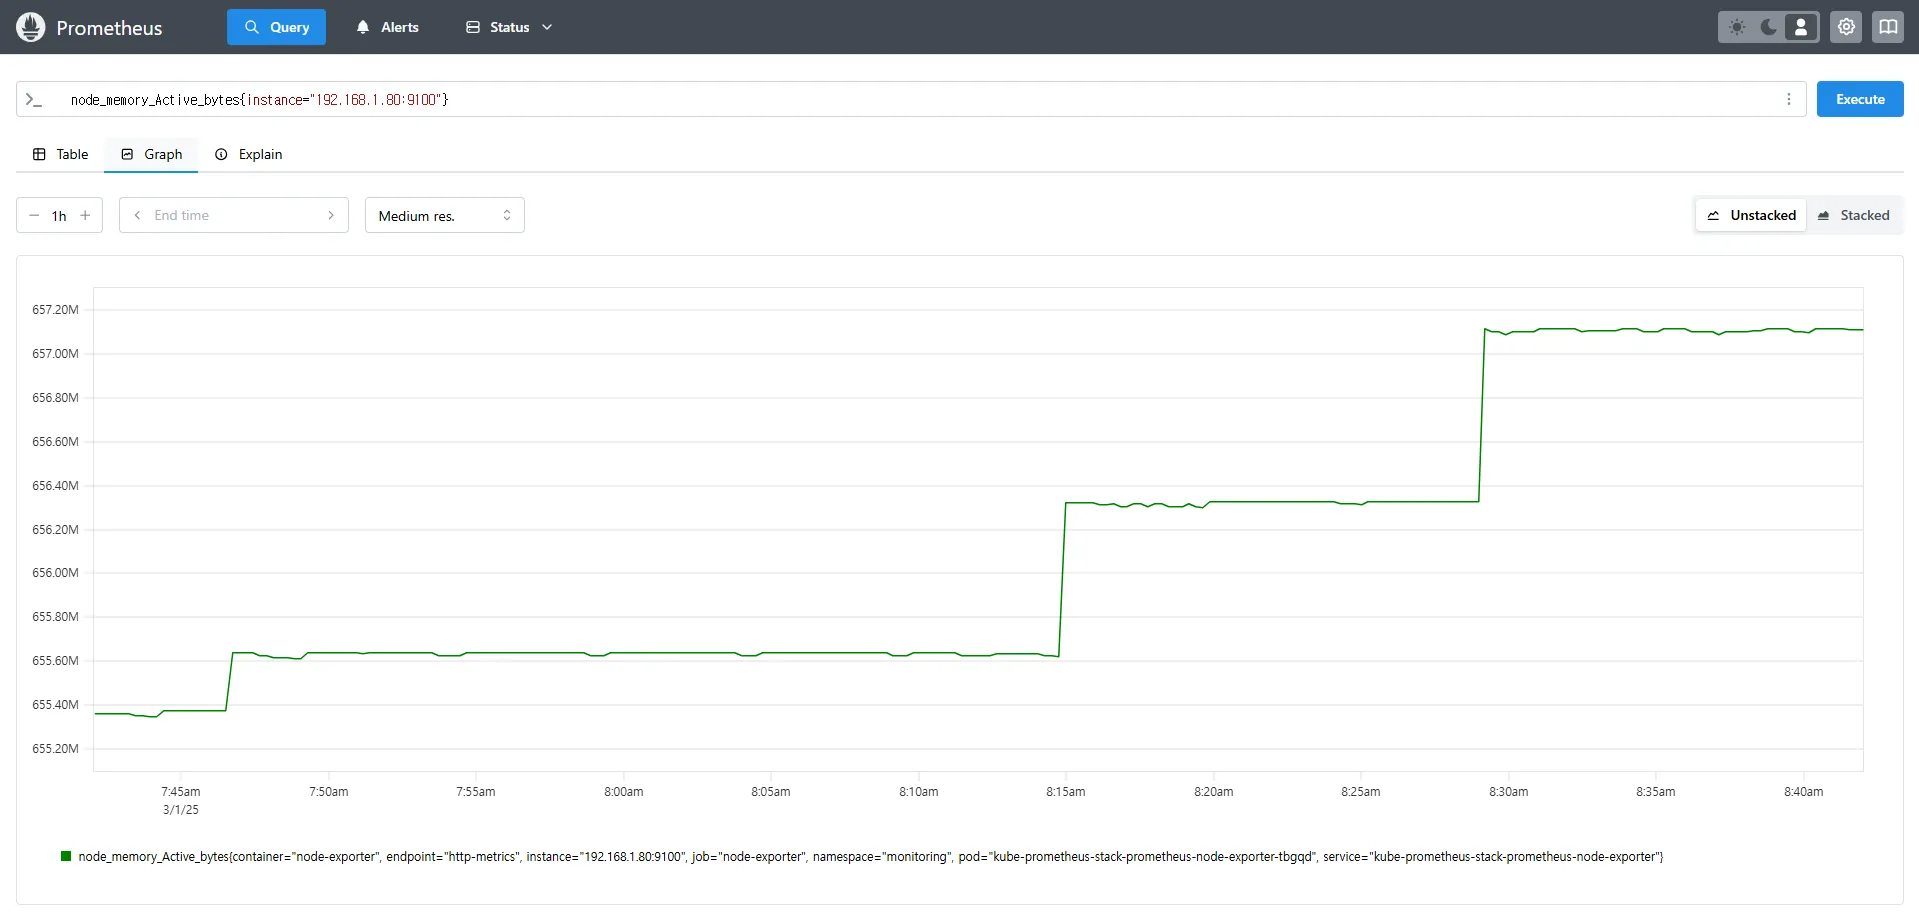
# 특정 노드(인스턴스) 필터링 : 아래 IP는 출력되는 자신의 인스턴스 PrivateIP 입력 후 Execute 클릭 -> Graph 확인
node_memory_Active_bytes{instance="192.168.1.105:9100"}- node_memory_Active_bytes: 노드에서 사용 중인 활성 메모리의 바이트 수를 반환합니다.
- 특정 인스턴스를 지정하면 해당 노드의 메트릭만 필터링하여 확인할 수 있습니다.
7.2 Kube-State-Metrics: Kubernetes 오브젝트 상태 모니터링
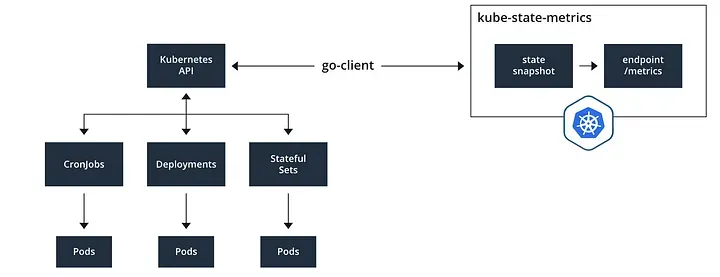
7.2.1 Kube-State-Metrics 개요
Kube-State-Metrics(KSM)는 Kubernetes API 서버와 통신하여 클러스터의 오브젝트 상태 정보를 수집하는 Prometheus Exporter입니다.
이 도구는 다음과 같은 오브젝트들의 상태 정보를 제공합니다.
- Deployment, StatefulSet, Pod, Node, CronJob, DaemonSet 등 Kubernetes 리소스의 상태
- Replica 수, 가용성 상태, 리소스 요청 및 할당 상태
- 이벤트 기반의 상태 변화 모니터링
Kube-State-Metrics는 개별 컴포넌트의 상태(예: API 서버, etcd 등)를 모니터링하는 것이 아니라, Kubernetes 오브젝트의 현재 상태를 기록하는 데 초점을 맞추고 있습니다.
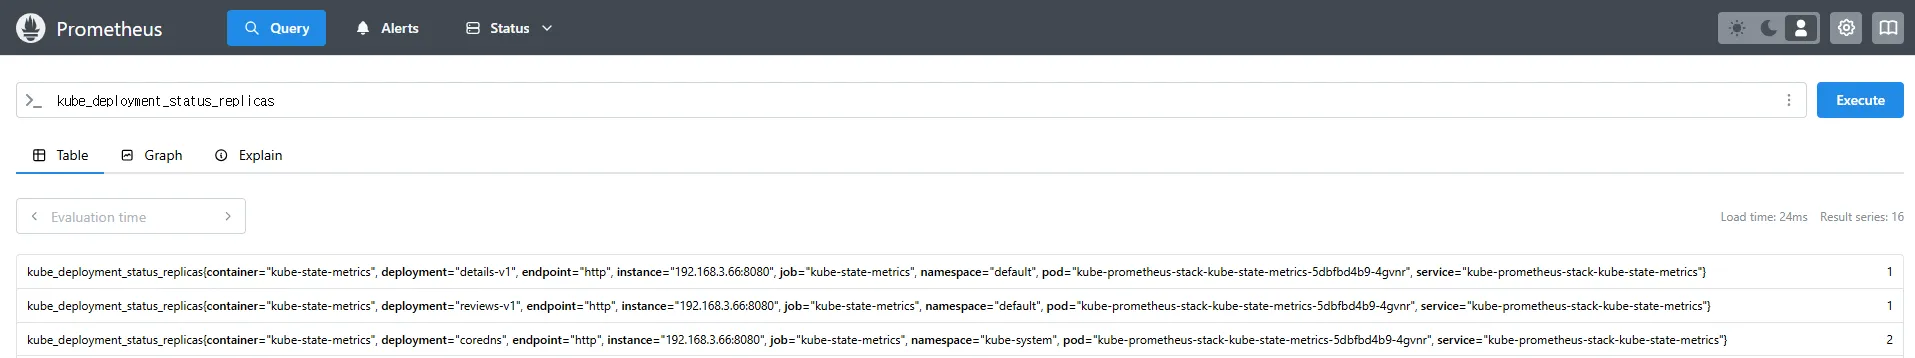
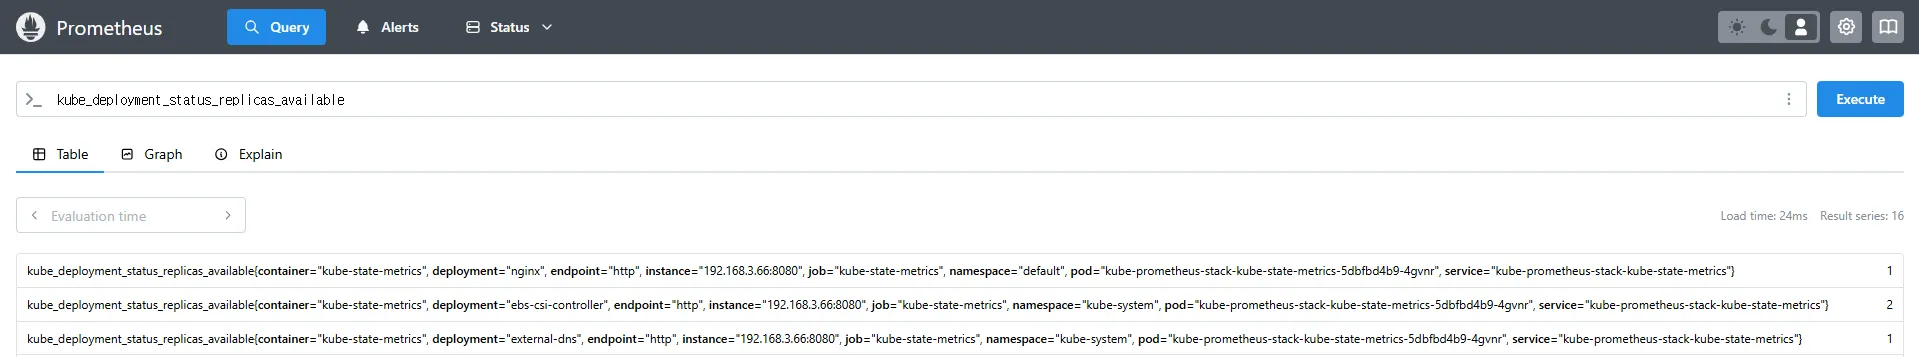
7.2.2 Kube-State-Metrics 메트릭 예제
Kubernetes 클러스터 내에서 Deployment의 상태를 모니터링하는 PromQL 쿼리 예제입니다.
Deployment의 Replica 수를 수동으로 조정하고, Prometheus를 통해 변경된 상태를 확인할 수 있습니다.
# replicas's number
kube_deployment_status_replicas
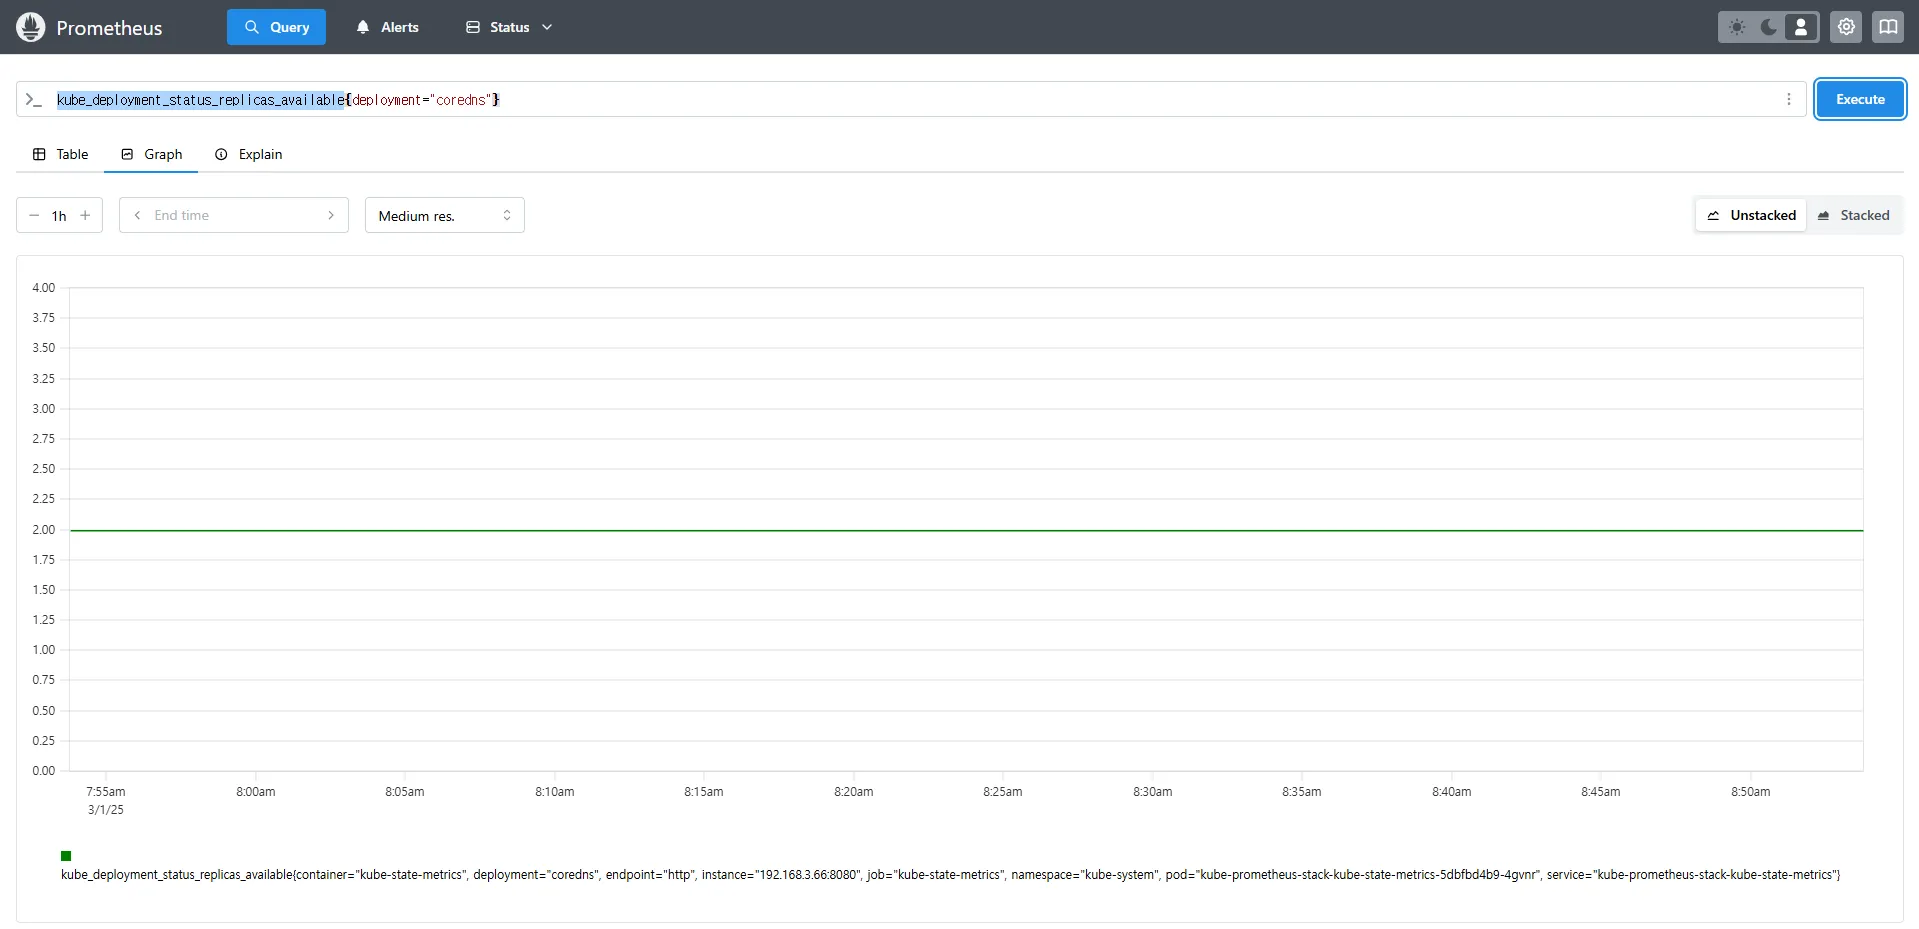
kube_deployment_status_replicas_available # 가능한 상태
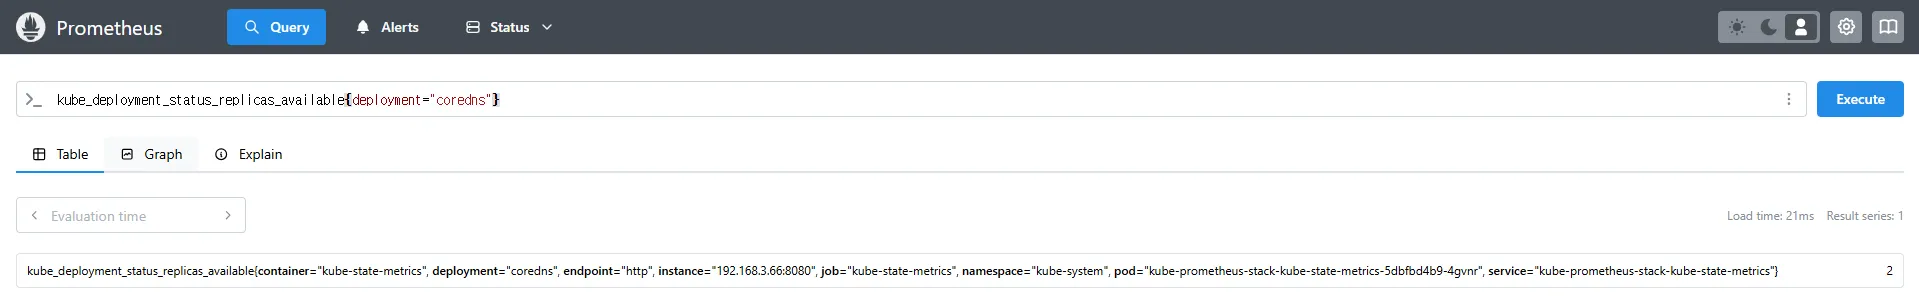
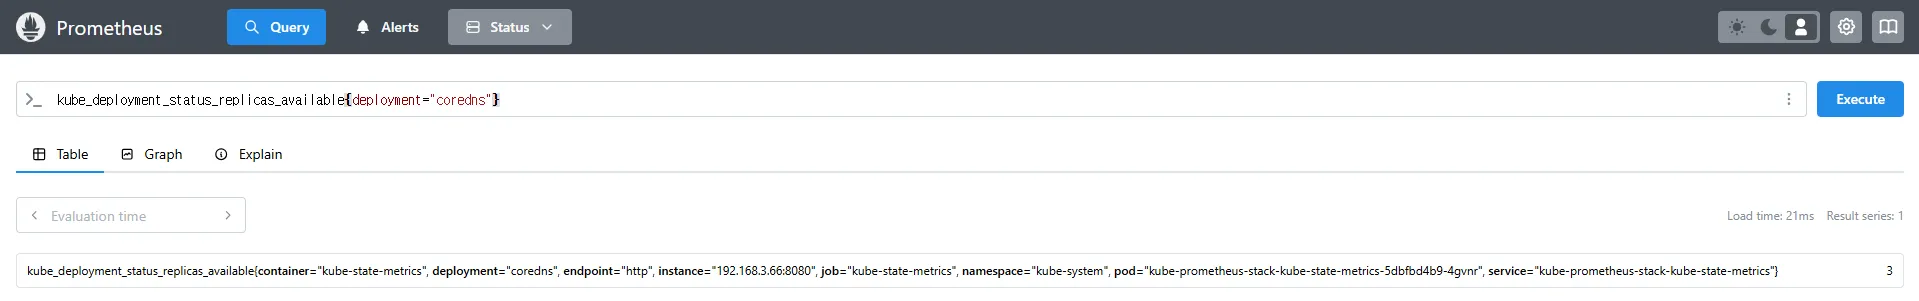
kube_deployment_status_replicas_available{deployment="coredns"} # coredns의 replica 개수 확인
# scale out
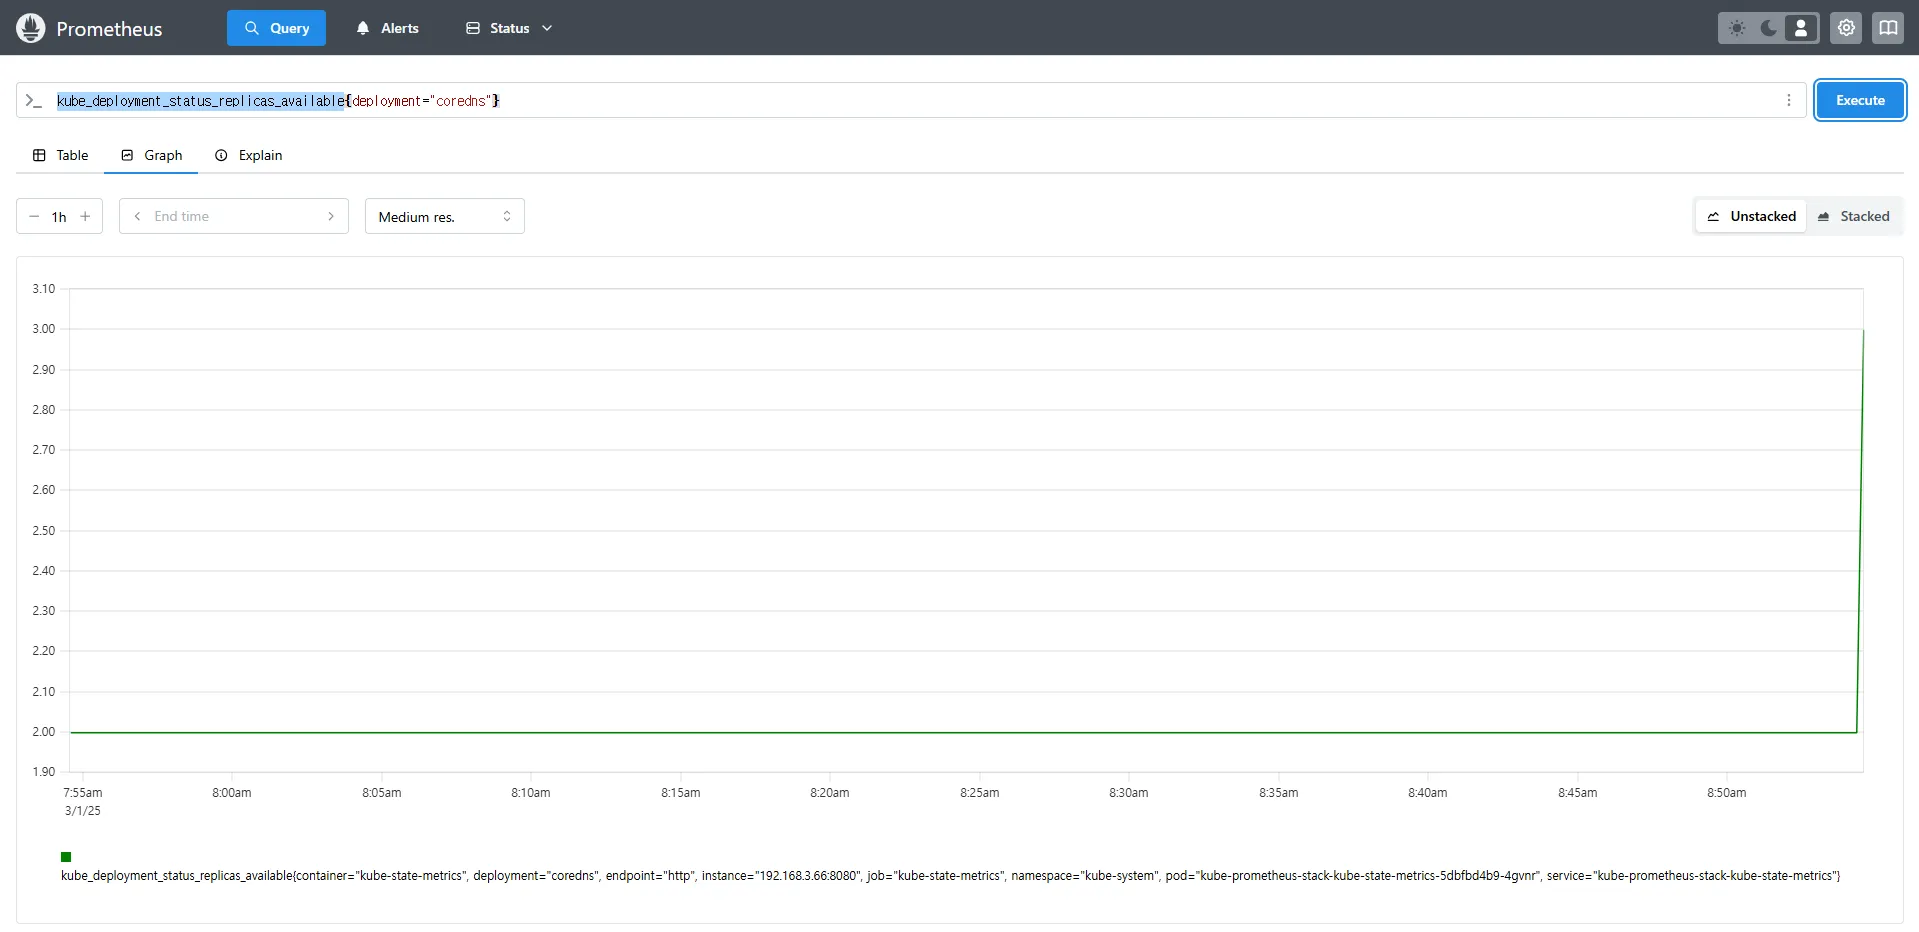
kubectl scale deployment -n kube-system coredns --replicas 3
# 확인. 스크랩주기인 15초 이후 반영됨
kube_deployment_status_replicas_available{deployment="coredns"}
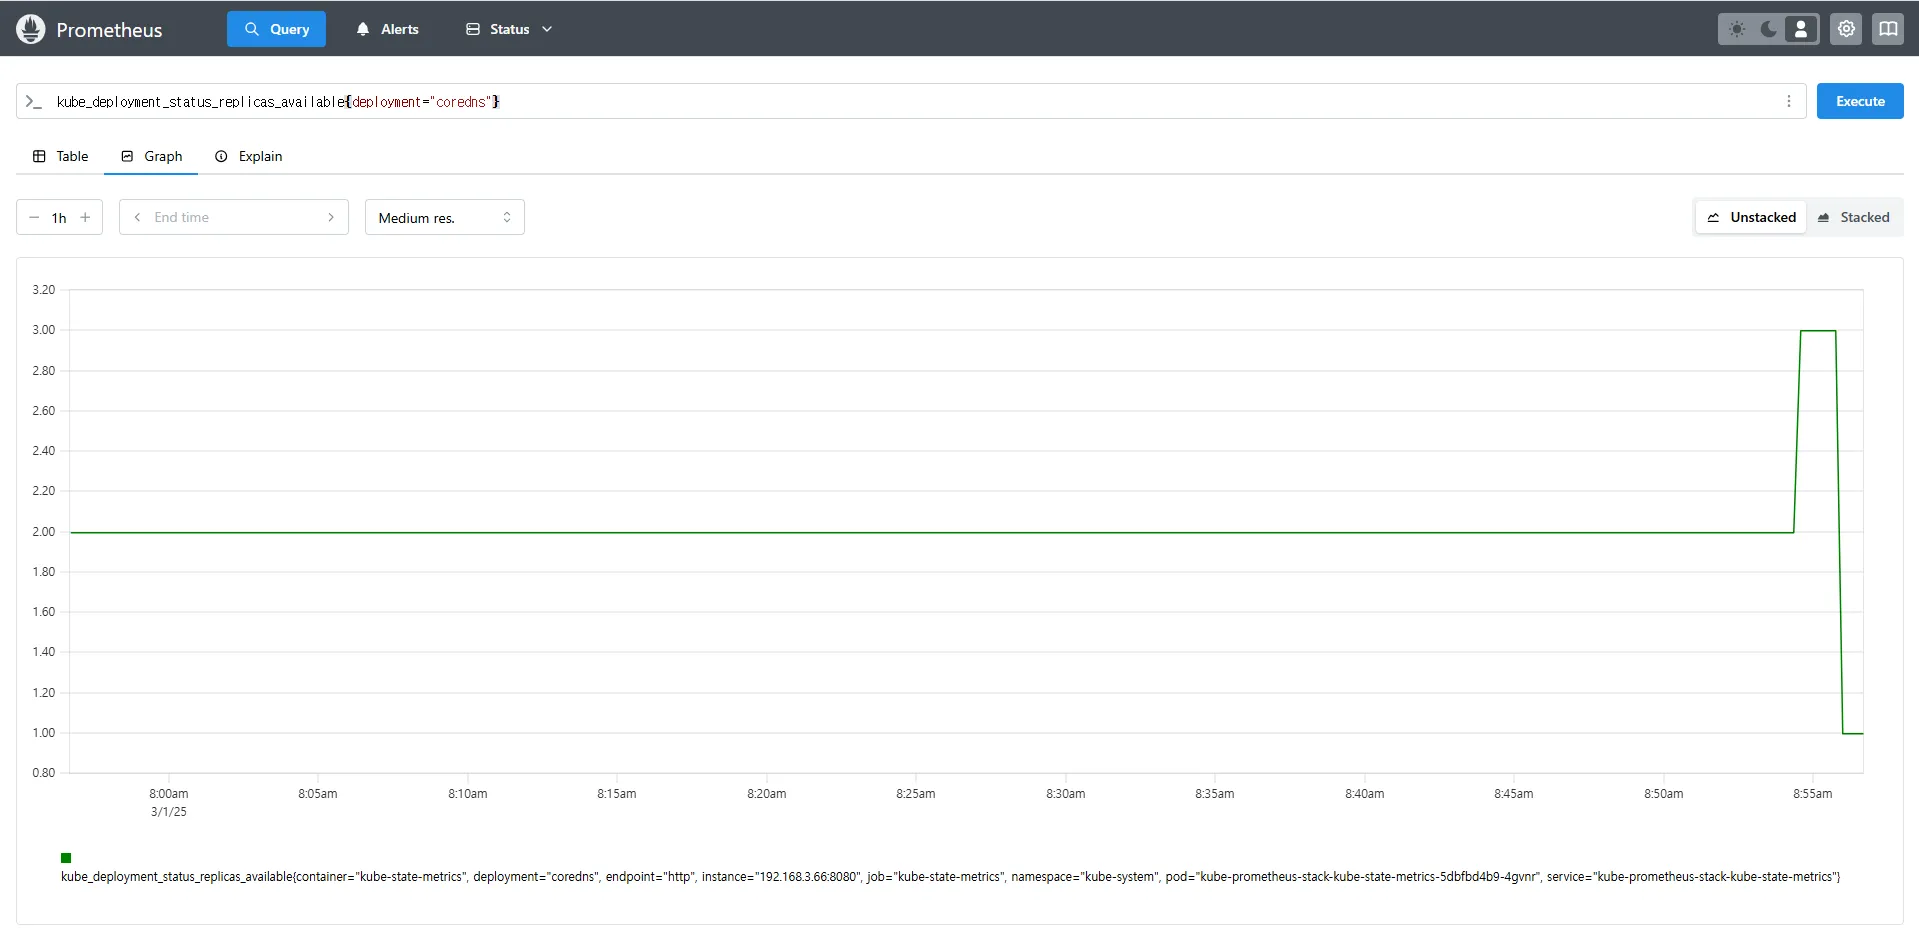
# scale in
kubectl scale deployment -n kube-system coredns --replicas 1
# 확인. 스크랩주기인 15초 이후 반영됨
kube_deployment_status_replicas_available{deployment="coredns"}kube_deployment_status_replicas→ 현재 클러스터 내 모든 Deployment의 총 Replica 개수kube_deployment_status_replicas_available→ 실행 중인 Replica 개수{deployment="coredns"}→ 특정 Deployment(coredns)의 가용 Replica 개수를 조회


7.3 Kube-Proxy: Kubernetes 네트워크 프록시 모니터링
7.3.1 Kube-Proxy 개요
Kube-Proxy는 Kubernetes 클러스터의 노드에서 실행되며, 클러스터 내 서비스 간 트래픽을 관리하는 역할을 합니다.
기본적으로 Kube-Proxy는 다음과 같은 네트워크 설정을 관리합니다.
- iptables, IPVS, NFTables 등의 네트워크 룰 적용
- 각 Pod로의 트래픽을 올바르게 라우팅
- 서비스 디스커버리 및 로드밸런싱 역할 수행
Kube-Proxy는 자체적으로 Prometheus 메트릭을 제공하며, 이를 통해 네트워크 트래픽을 모니터링할 수 있습니다.
7.3.2 Kube-Proxy 메트릭 예제
Kube-Proxy의 동작을 모니터링하는 PromQL 쿼리 예제입니다.
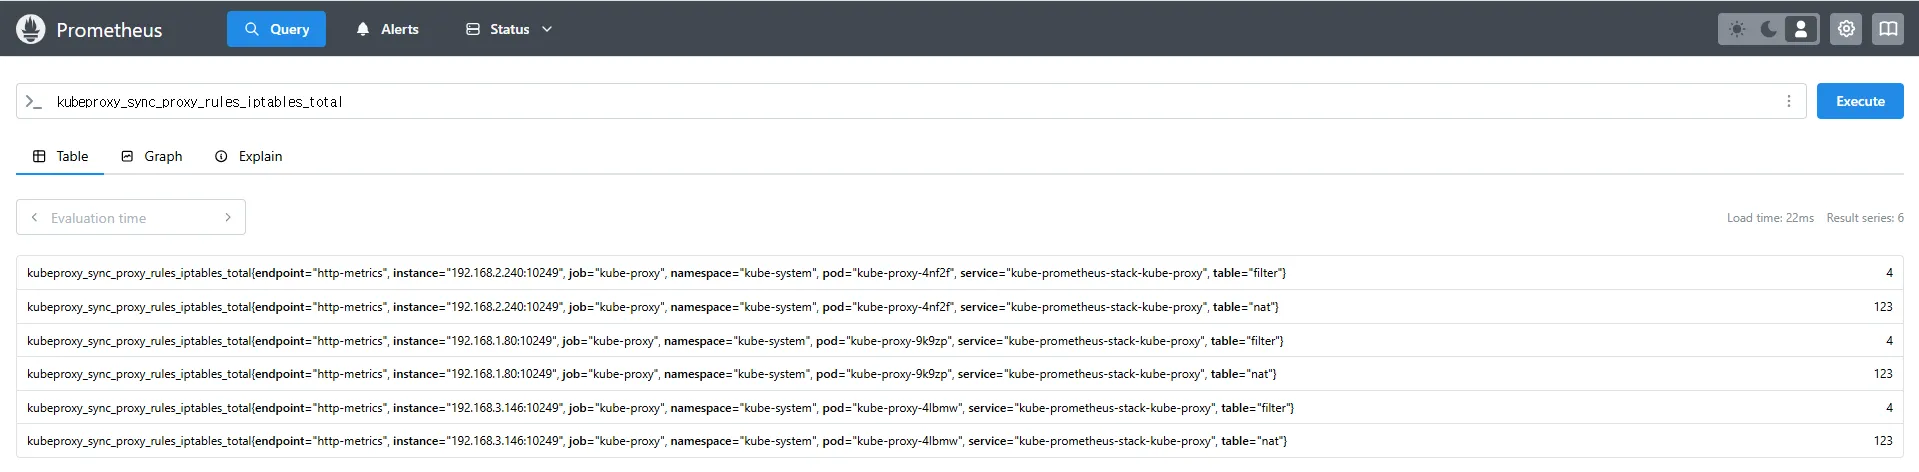
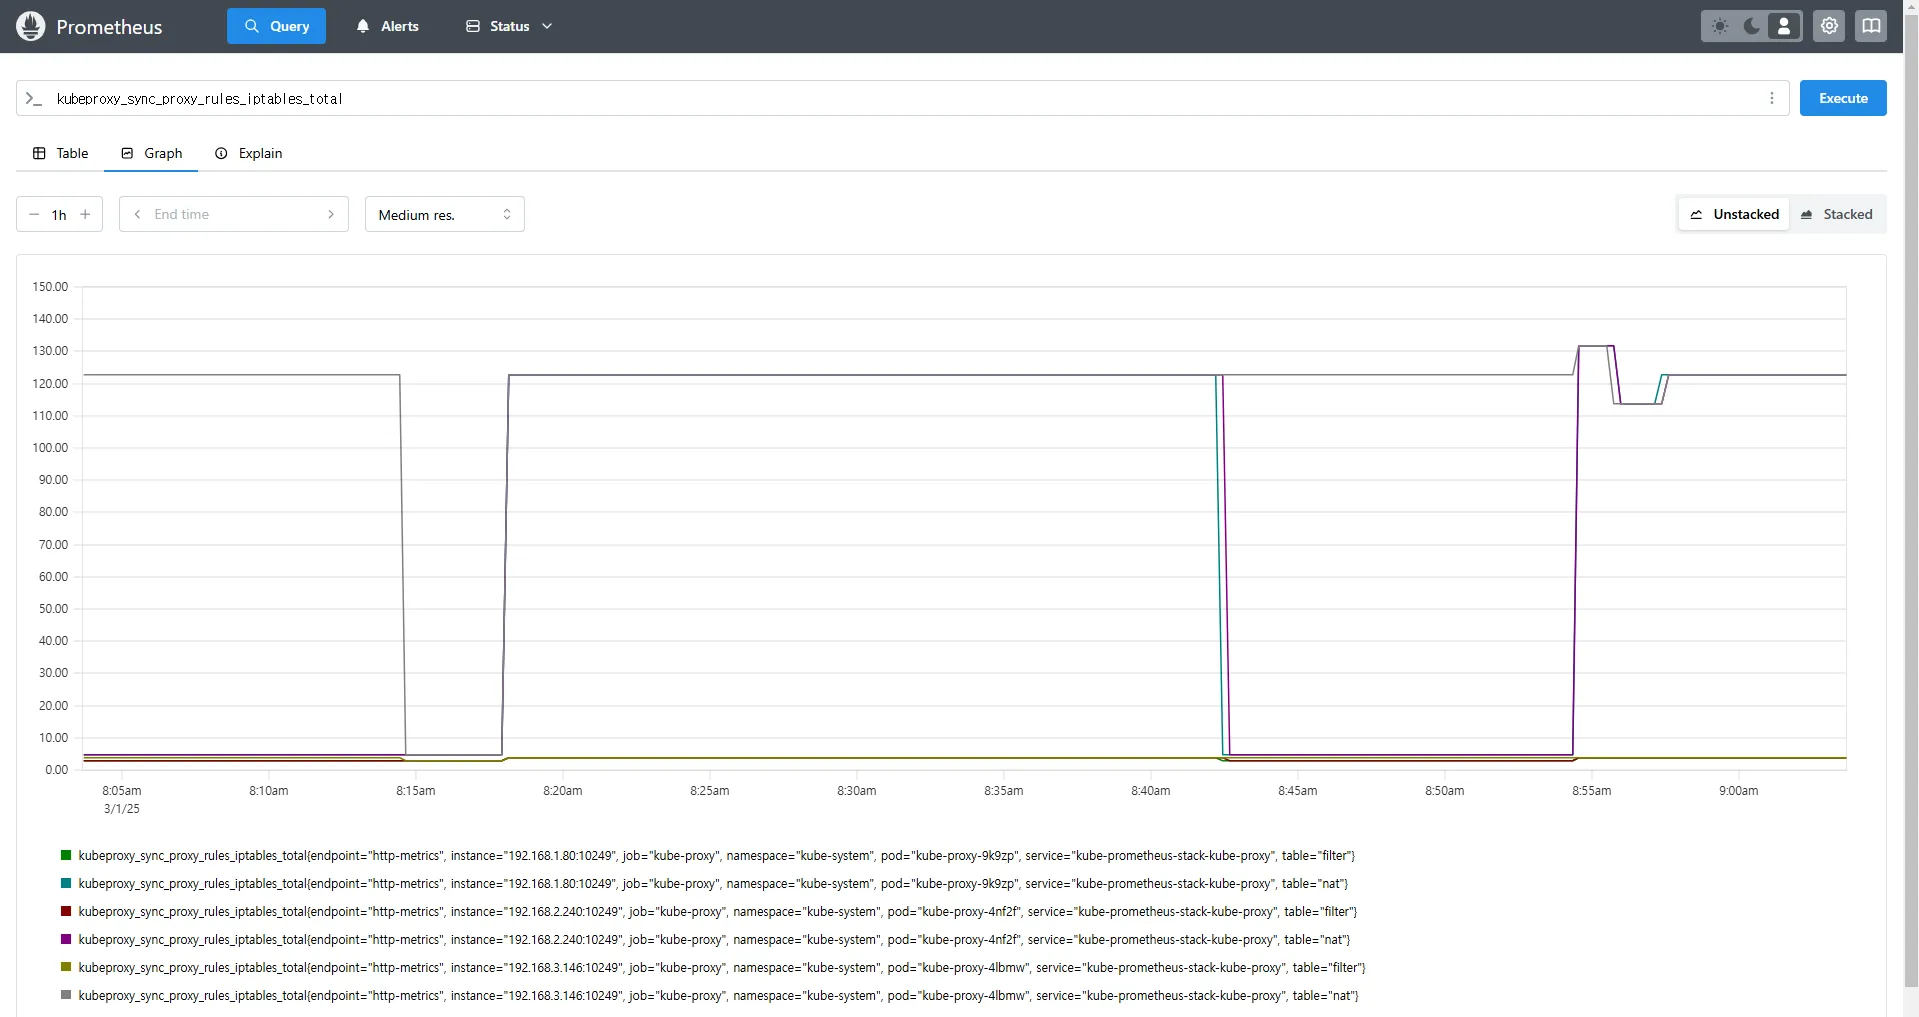
# Kube-Proxy의 iptables 규칙 동기화 횟수
kubeproxy_sync_proxy_rules_iptables_total
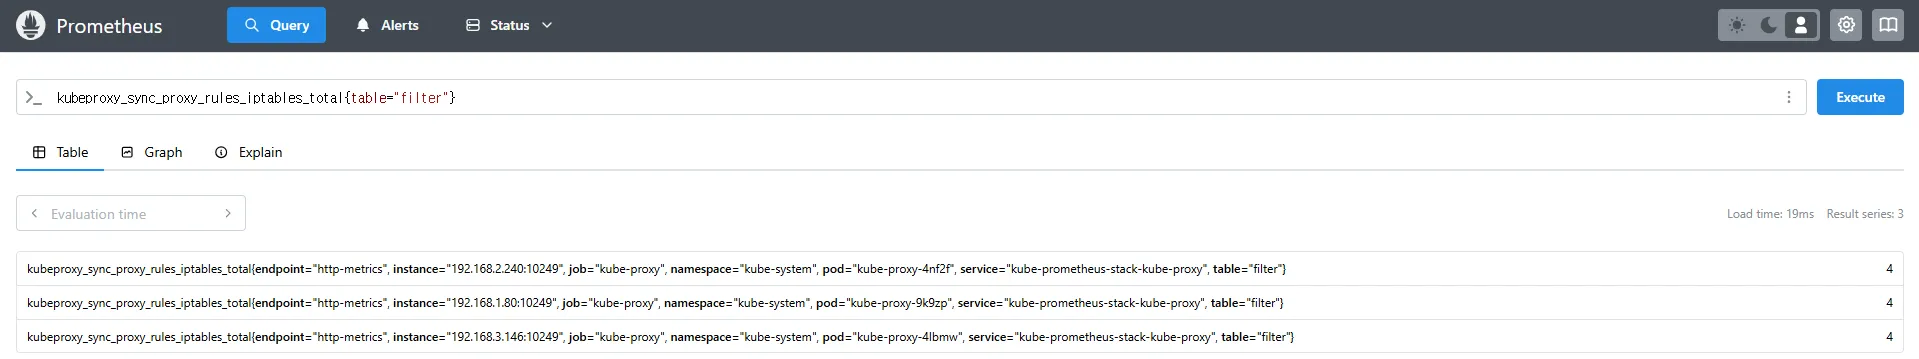
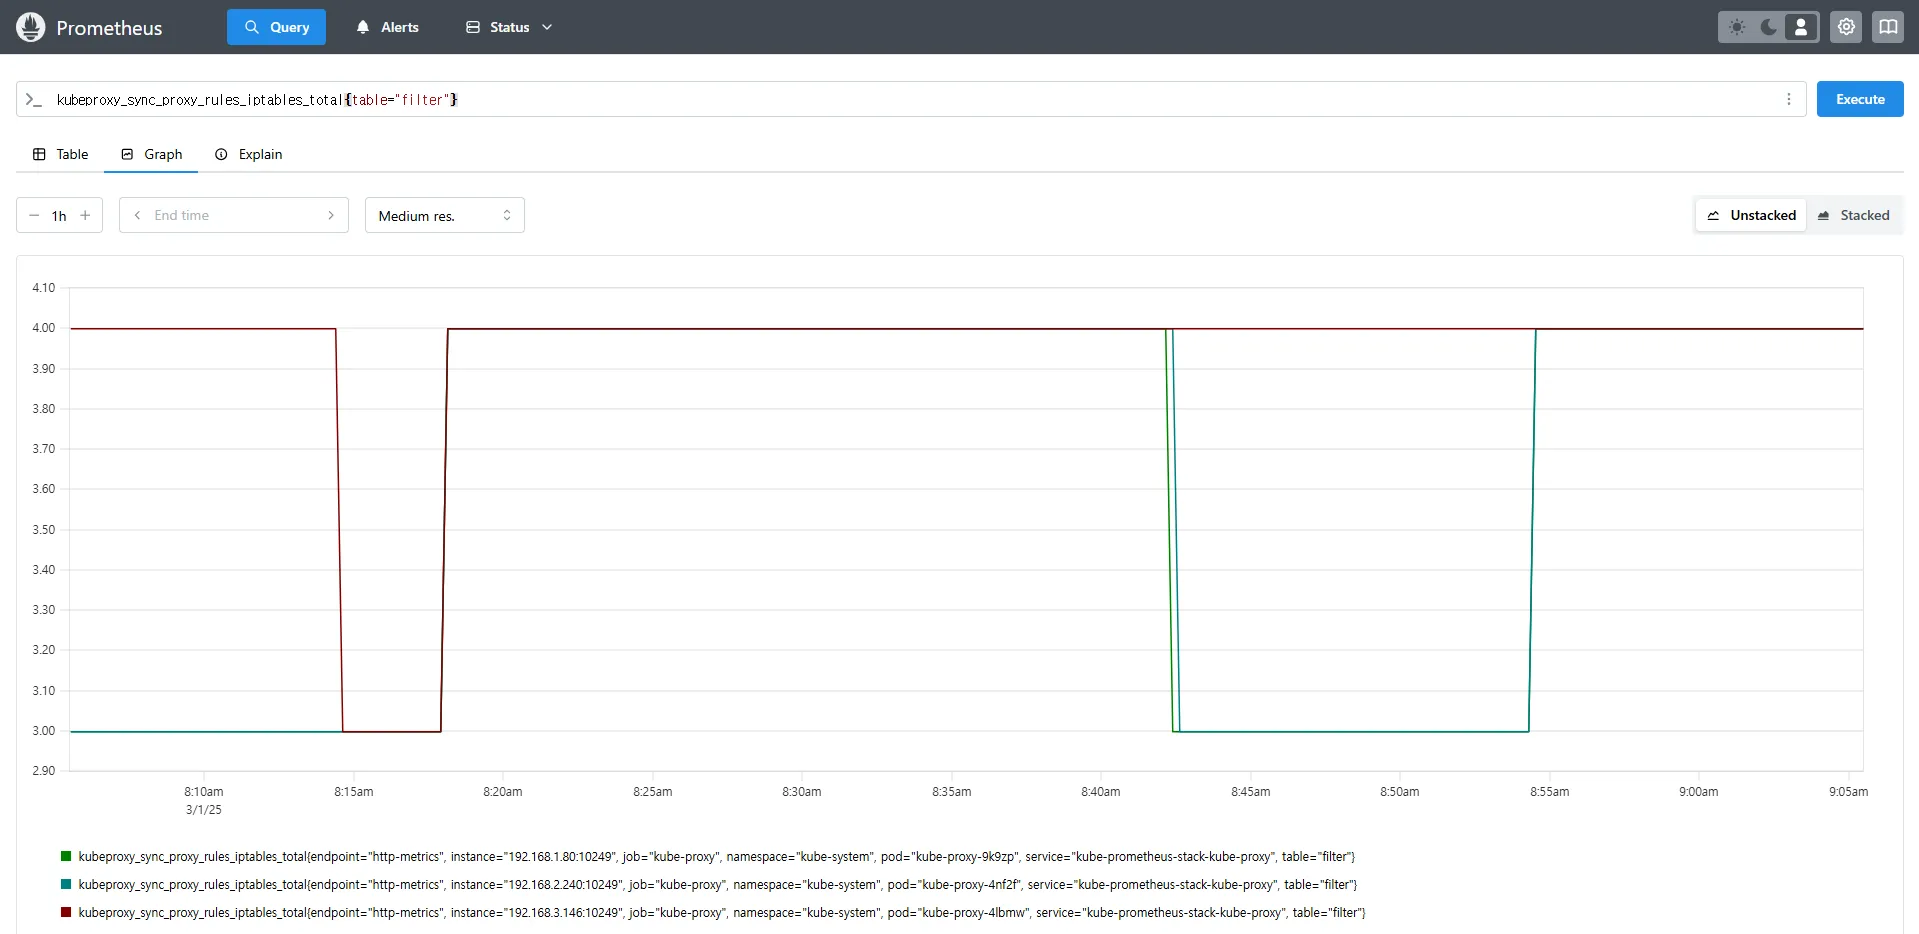
# 특정 테이블(Filter)에서의 iptables 규칙 동기화 횟수
kubeproxy_sync_proxy_rules_iptables_total{table="filter"}
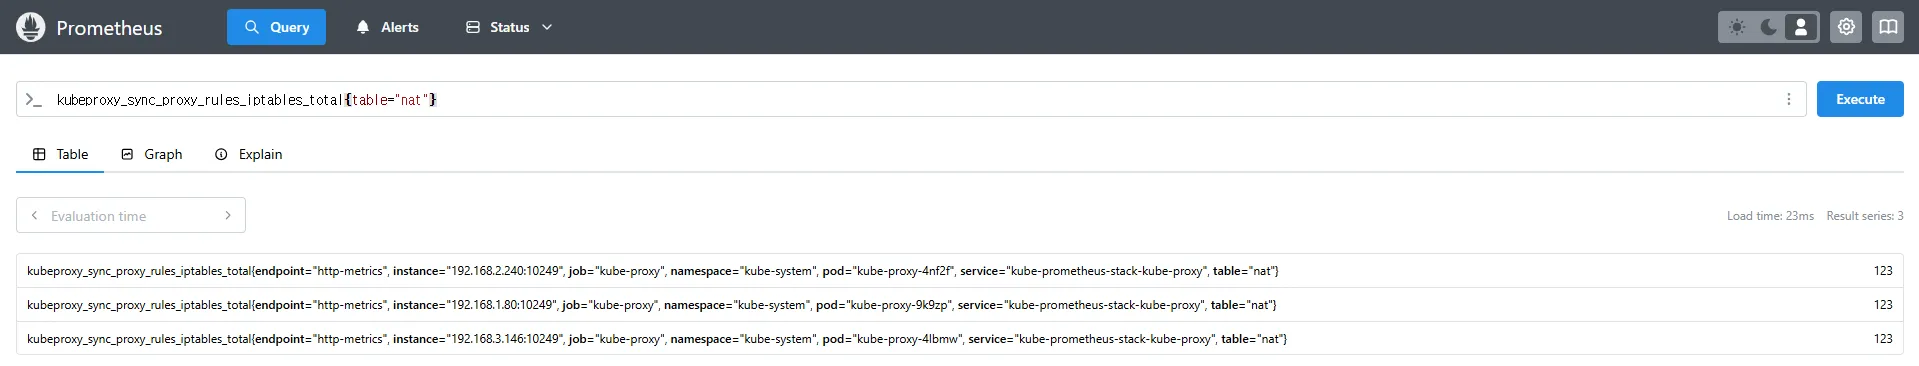
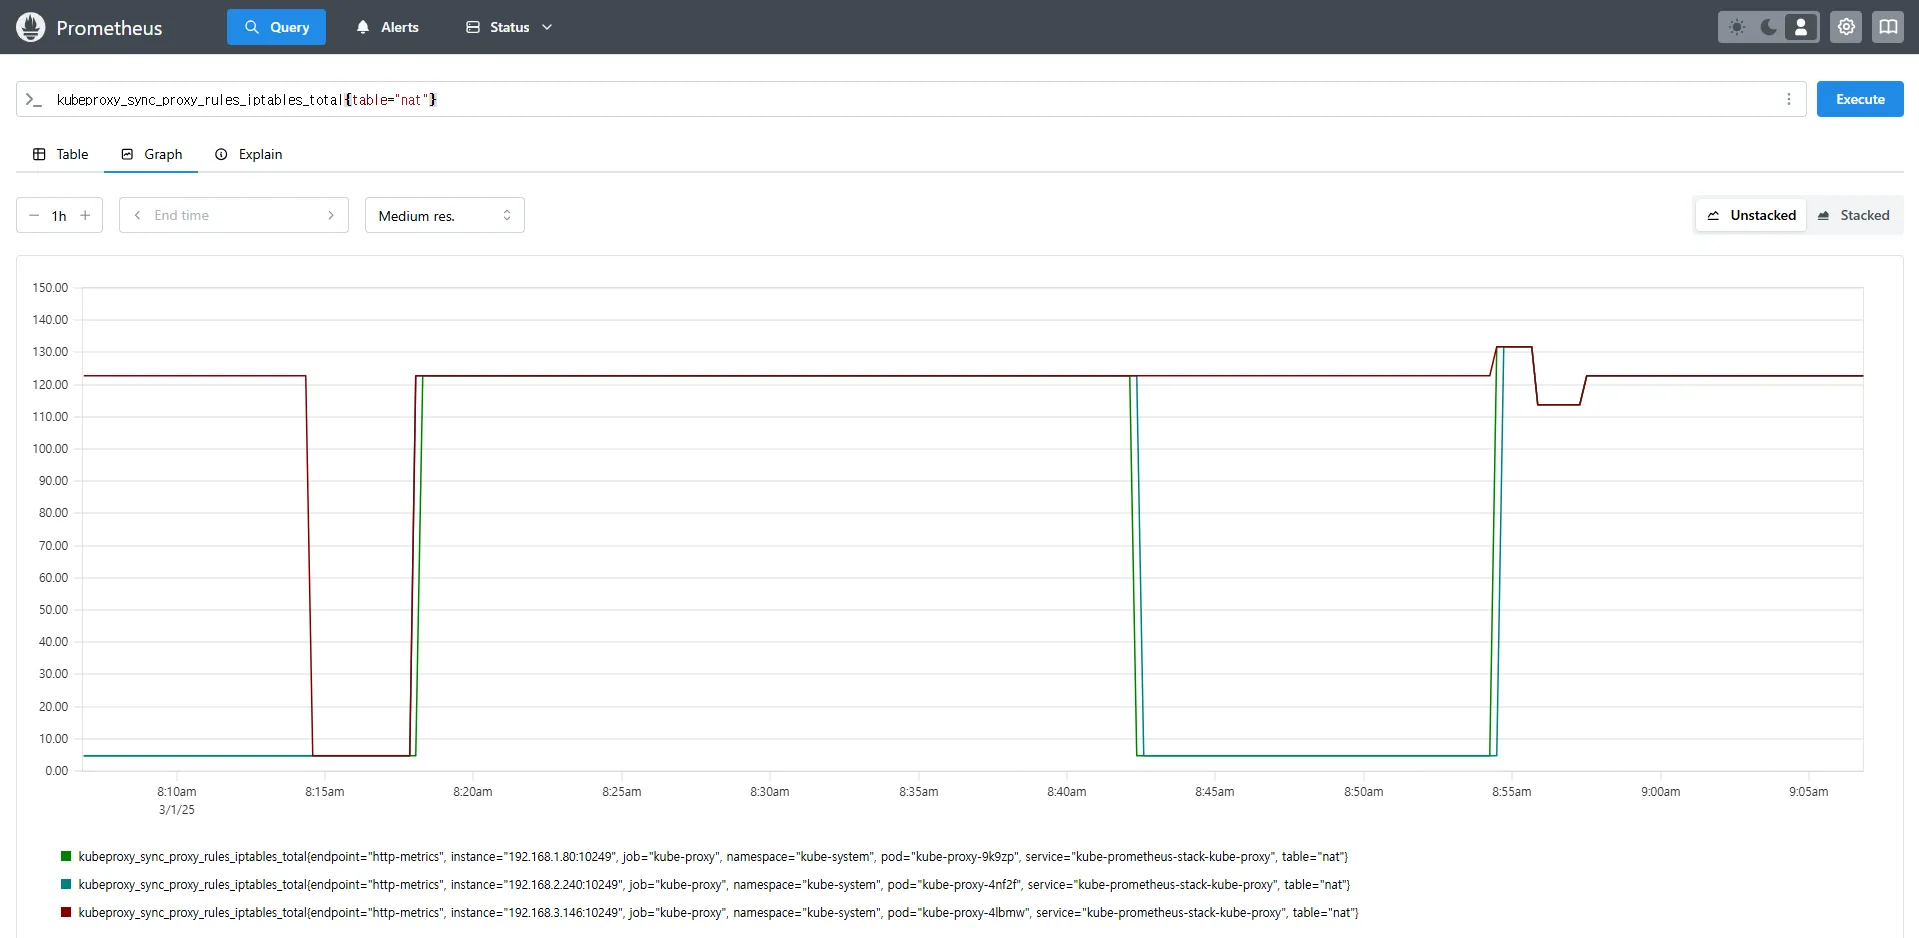
# NAT 테이블에서의 iptables 규칙 동기화 횟수
kubeproxy_sync_proxy_rules_iptables_total{table="nat"}
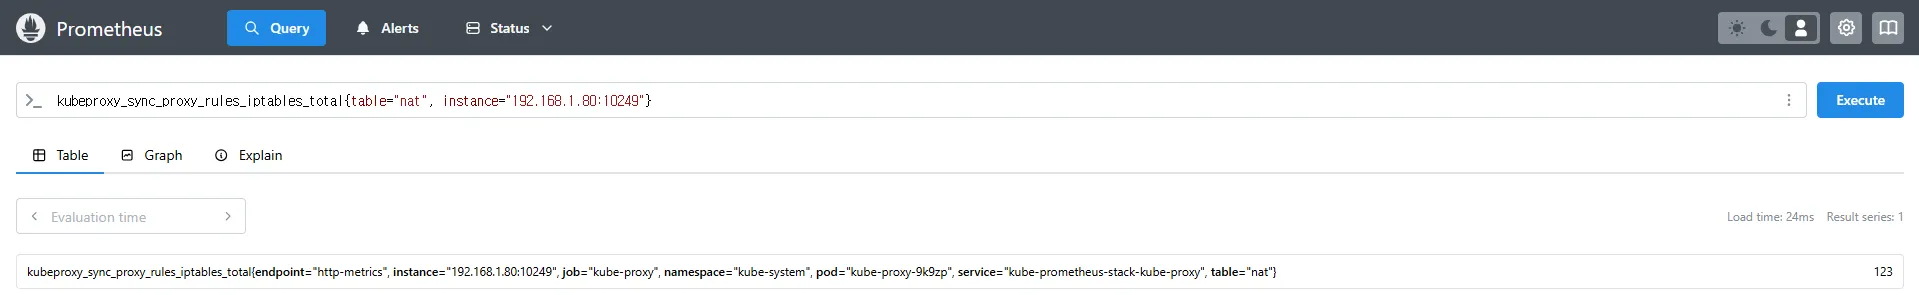
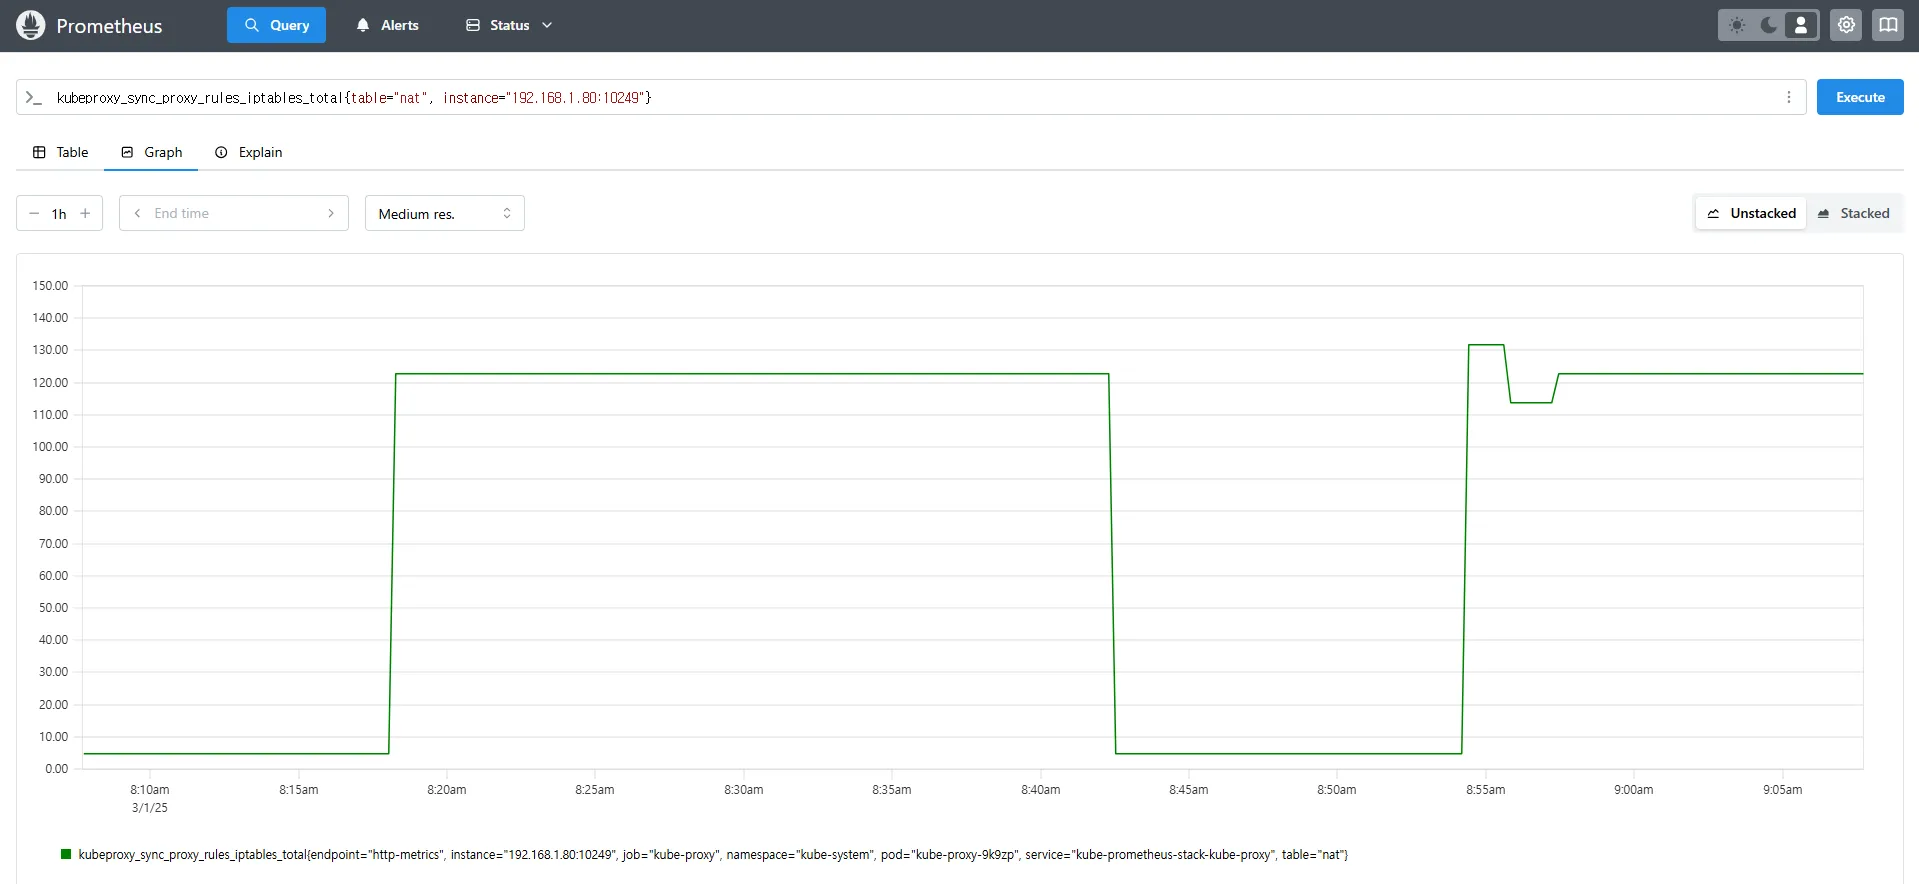
# 특정 인스턴스에서 Kube-Proxy의 NAT 테이블 동기화 횟수 확인
kubeproxy_sync_proxy_rules_iptables_total{table="nat", instance="192.168.1.188:10249"}kubeproxy_sync_proxy_rules_iptables_total→ iptables 규칙을 동기화한 횟수를 측정합니다.{table="nat"}→ NAT 테이블에서 동기화된 규칙만 필터링하여 확인합니다.{instance="192.168.1.188:10249"}→ 특정 노드(192.168.1.188)의 Kube-Proxy가 관리하는 iptables 동기화 횟수를 조회합니다.
7.3.3 Kube-Proxy 모니터링 방식
Kube-Proxy는 자체적으로 메트릭을 내장하고 있으며, Prometheus가 별도의 엔드포인트 없이 기본적으로 이를 스크래핑할 수 있습니다.
이는 Node Exporter와 달리 별도의 Exporter를 추가하지 않아도 되는 차이점이 있습니다.
8. NGINX 웹 서버 애플리케이션 모니터링 설정
8.1 NGINX 애플리케이션 모니터링 개요
Kubernetes에서 NGINX 웹 서버와 같은 애플리케이션을 배포한 경우, 해당 서비스의 성능 및 상태를 모니터링하기 위해 관련 메트릭을 수집해야 합니다. 이를 위해 Prometheus Exporter를 활용하여 NGINX 관련 정보를 효과적으로 수집할 수 있습니다.
8.2 NGINX 서비스 모니터링 방식
8.2.1 ServiceMonitor를 활용한 모니터링 자동 등록
- ServiceMonitor CRD를 사용하여 NGINX 서비스에 등록된 엔드포인트를 자동으로 탐색하고, 해당 엔드포인트를 Prometheus에서 모니터링 대상으로 설정할 수 있습니다.
- NGINX를 Helm을 이용하여 배포할 때, Prometheus Exporter 설정을 추가하면 자동으로 서비스 모니터링 대상에 등록할 수 있습니다.
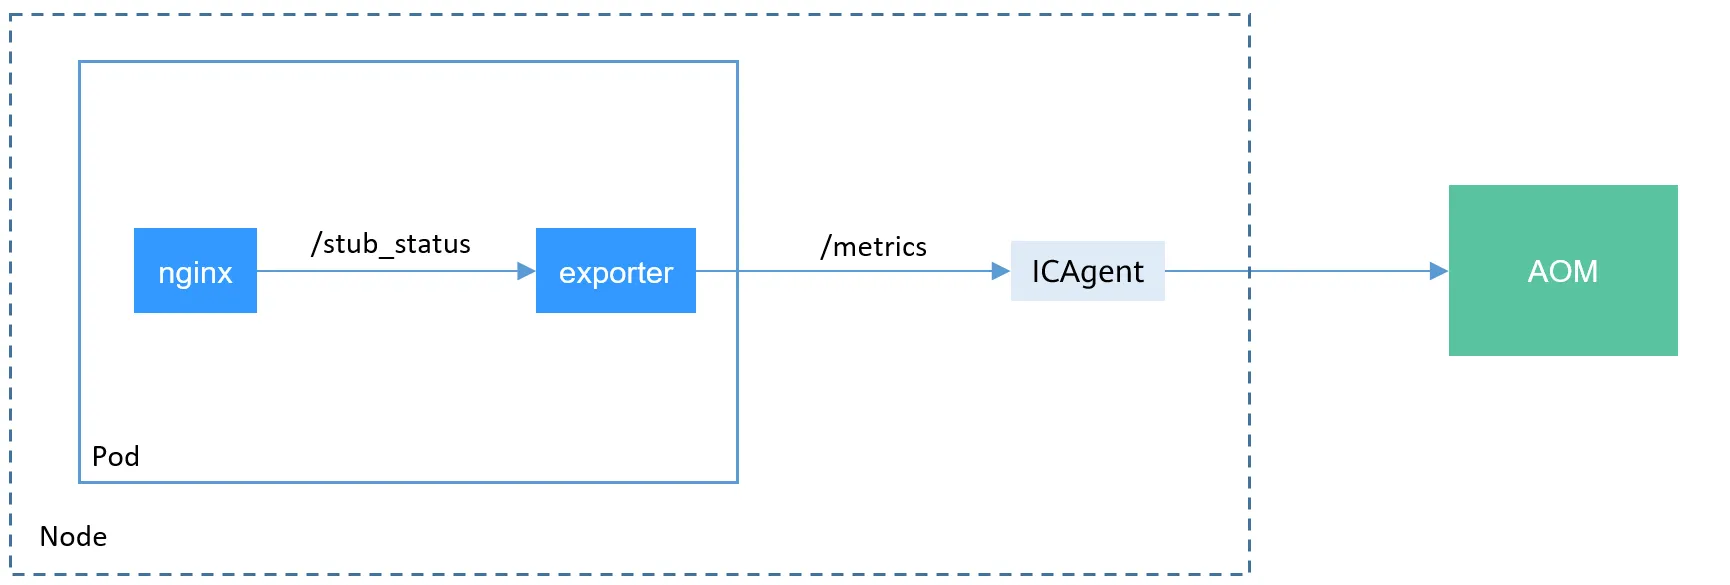
8.2.2 Sidecar 방식의 Exporter 컨테이너 추가
- 기존 애플리케이션 파드에 Prometheus 모니터링을 추가하려면 sidecar 방식을 사용하여 Exporter 컨테이너를 추가해야 합니다.
- Exporter는 NGINX의
/stub_status엔드포인트에 접근하여 메트릭을 수집하며, 이를 Prometheus가 읽을 수 있도록 변환합니다.
https://docs-archive.sc.otc.t-systems.com/usermanual/cce/cce_10_0201.html
8.3 NGINX Helm Chart를 활용한 모니터링 설정
8.3.1 Helm Chart 설정
Helm을 사용하여 NGINX를 배포할 때, metrics.enabled 옵션을 활성화하면 Prometheus Exporter가 자동으로 설정됩니다.
# 모니터링
watch -d "kubectl get pod; echo; kubectl get servicemonitors -n monitoring"
# nginx 파드내에 컨테이너 갯수 확인
kubectl describe pod -l app.kubernetes.io/instance=nginx
# Helm Chart 설정
# 파라미터 파일 생성 : 서비스 모니터 방식으로 nginx 모니터링 대상을 등록하고, export 는 9113 포트 사용
# The chart can deploy ServiceMonitor objects for integration with Prometheus Operator installations. To do so, set the value metrics.serviceMonitor.enabled=true.
cat <<EOT > nginx-values.yaml
metrics:
enabled: true
service:
port: 9113
serviceMonitor:
enabled: true
namespace: monitoring
interval: 10s
EOT
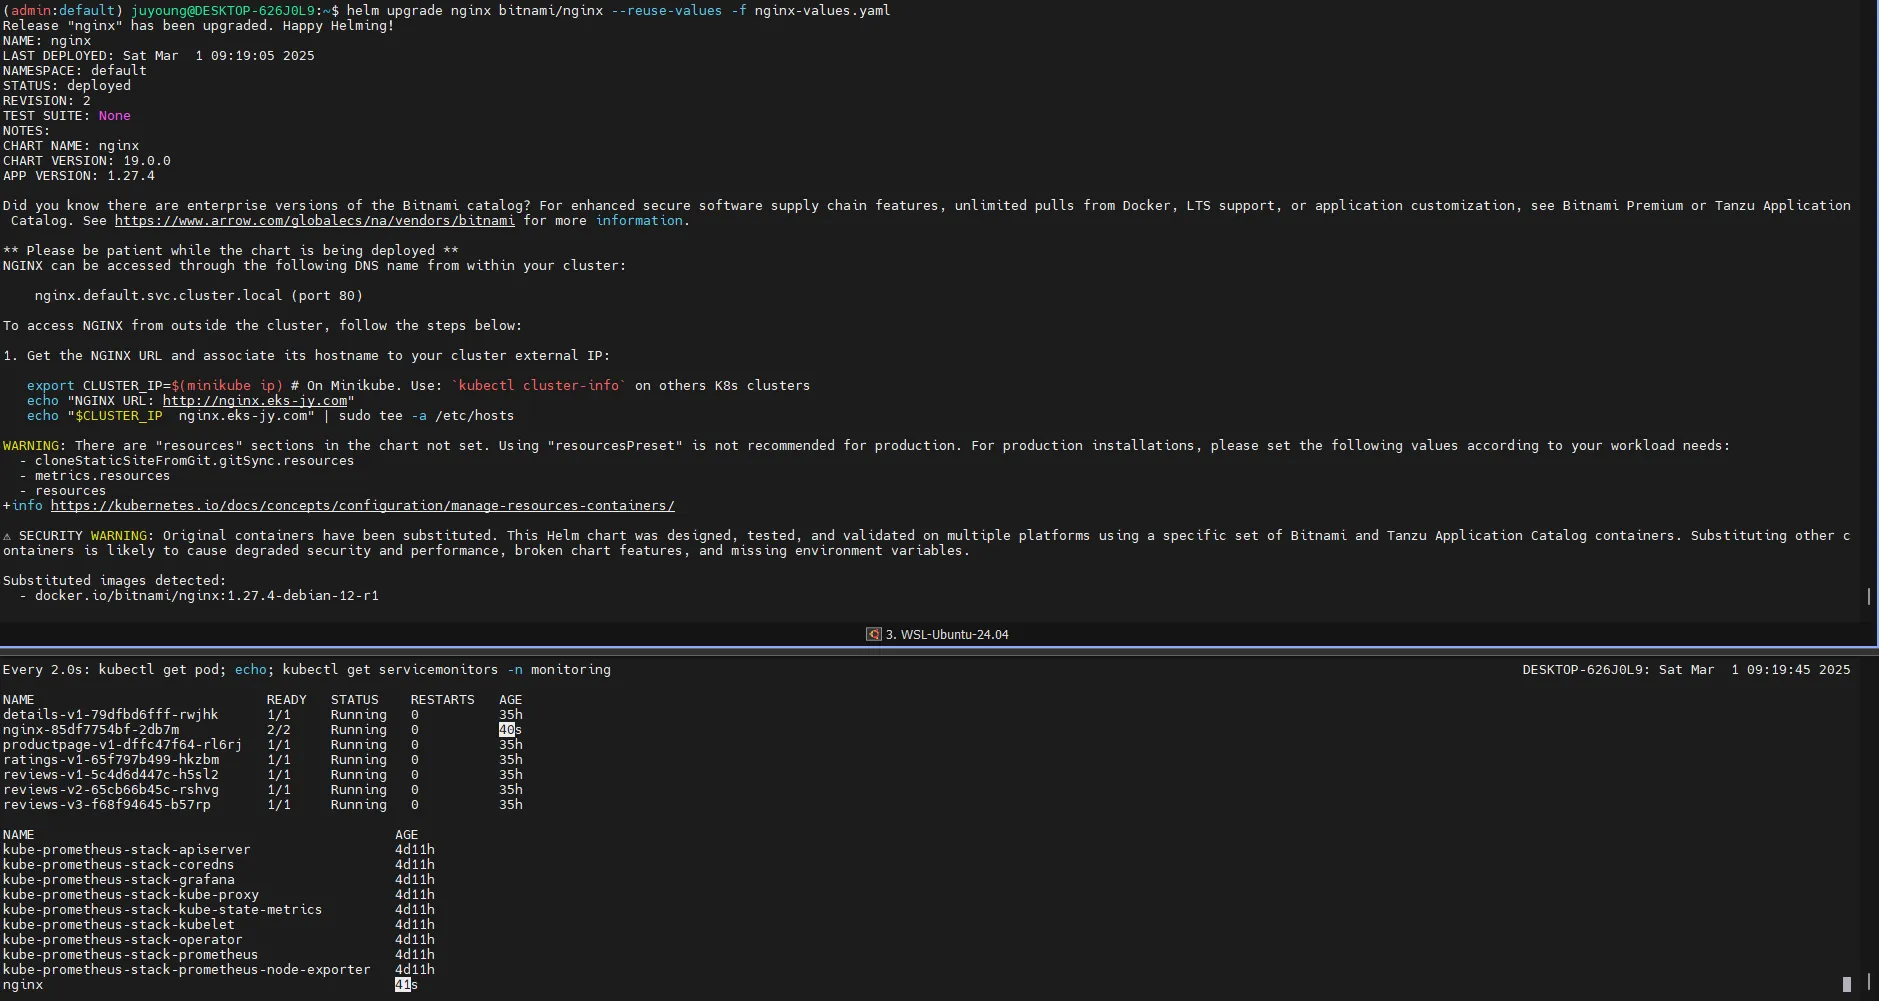
# Helm Chart 값 업데이트 및 배포
helm upgrade nginx bitnami/nginx --reuse-values -f nginx-values.yaml
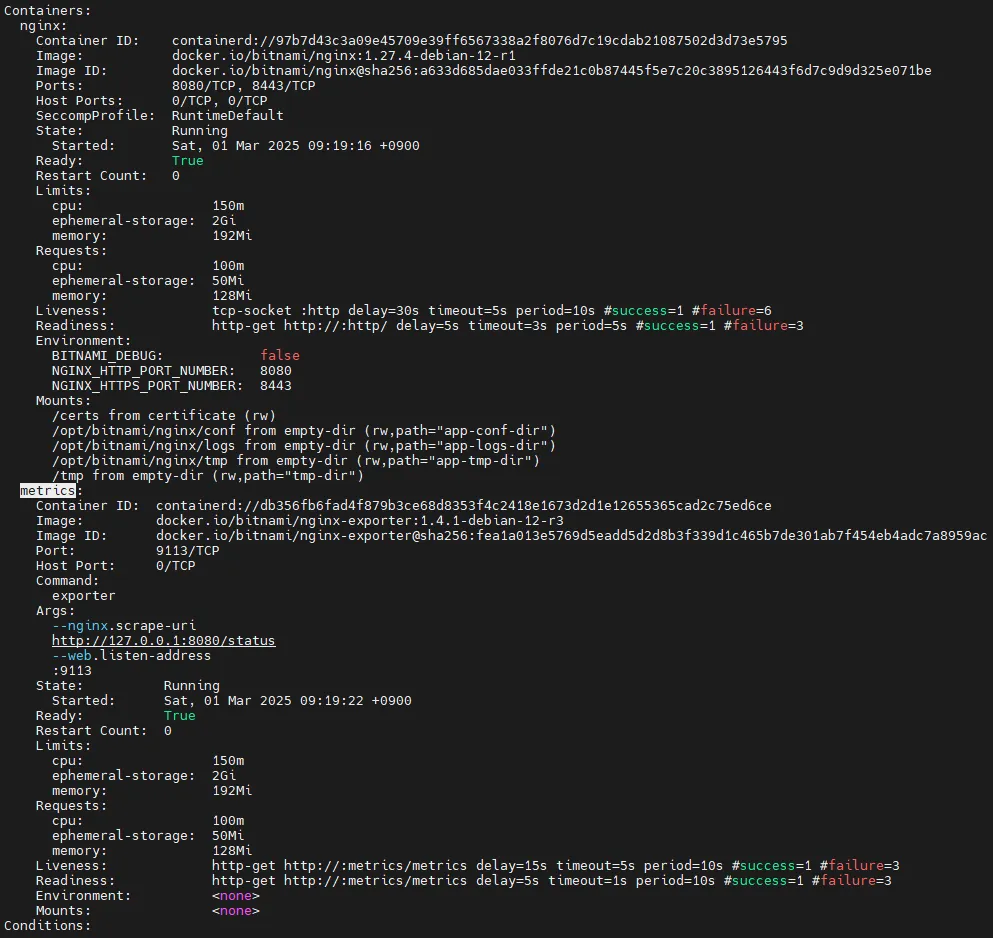
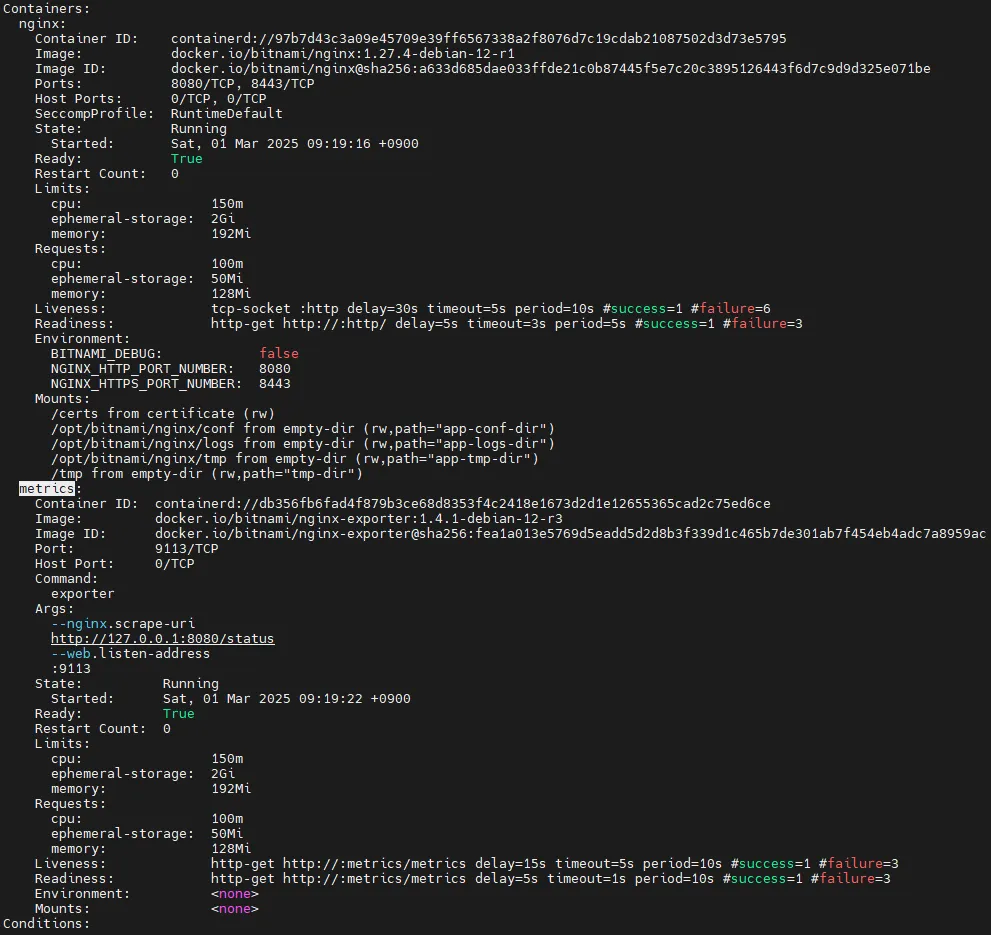
# nginx 파드내에 컨테이너 갯수 확인 -> metrics 컨테이너 추가됨
kubectl describe pod -l app.kubernetes.io/instance=nginx
# 배포 확인
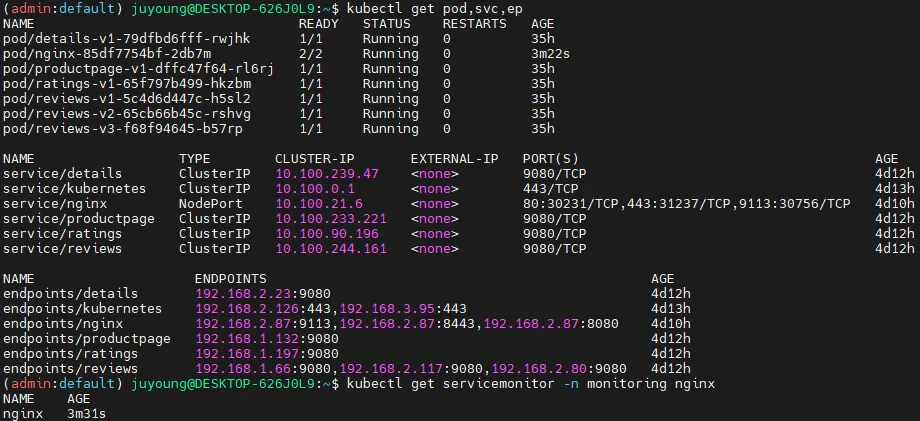
kubectl get pod,svc,ep
kubectl get servicemonitor -n monitoring nginx
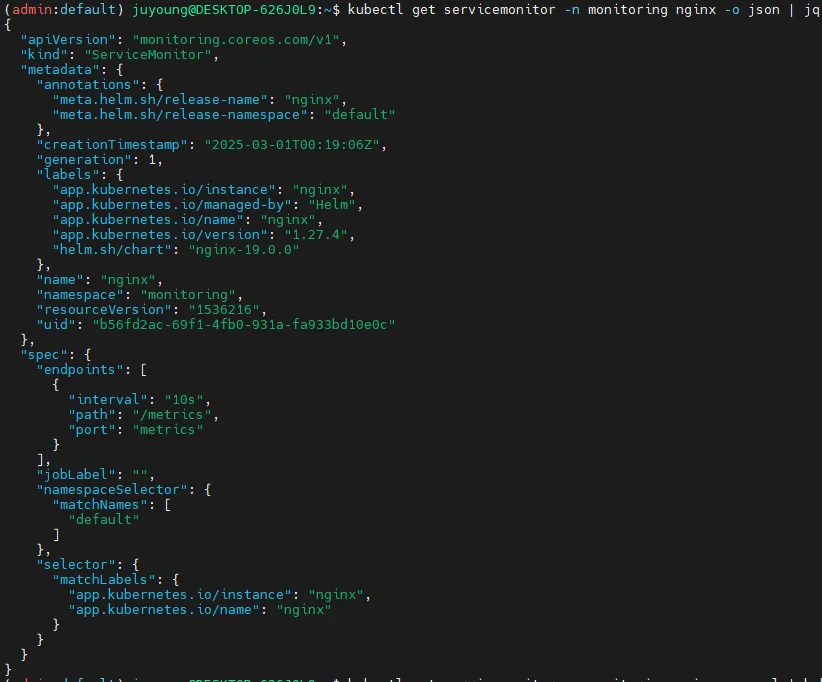
kubectl get servicemonitor -n monitoring nginx -o json | jq
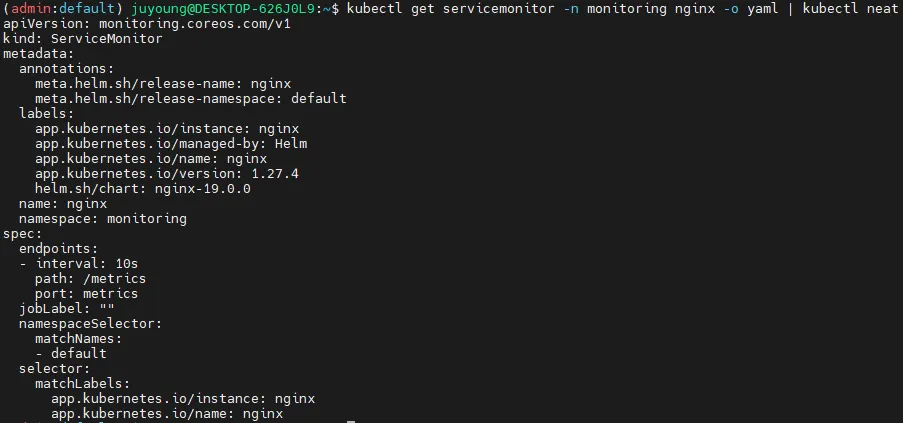
kubectl get servicemonitor -n monitoring nginx -o yaml | kubectl neat
# nginx 파드내에 컨테이너 갯수 확인 : metrics 컨테이너 확인
kubectl get pod -l app.kubernetes.io/instance=nginx
kubectl describe pod -l app.kubernetes.io/instance=nginx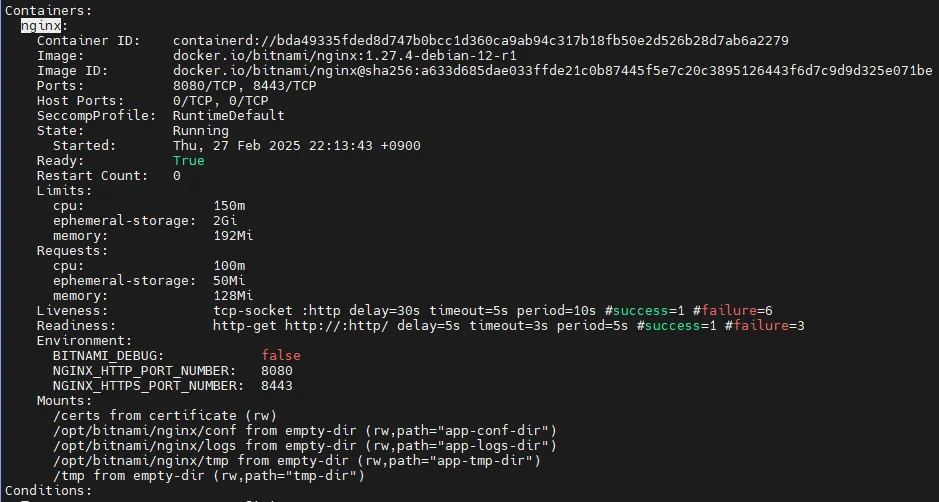

8.4 Prometheus에서 NGINX 모니터링 설정 확인
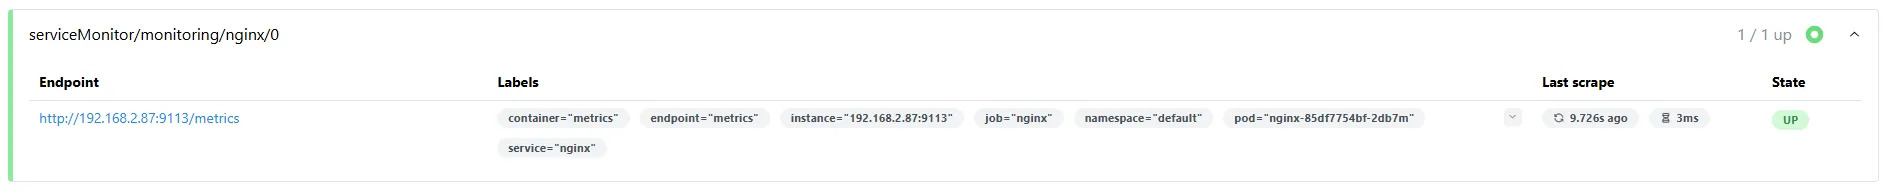
8.4.1 Prometheus에서 대상(TARGETS) 확인
ServiceMonitor가 생성된 후 약 3분 후 Prometheus 웹 UI의 Status → Targets에서 NGINX 서비스 모니터링이 추가되었는지 확인할 수 있습니다.
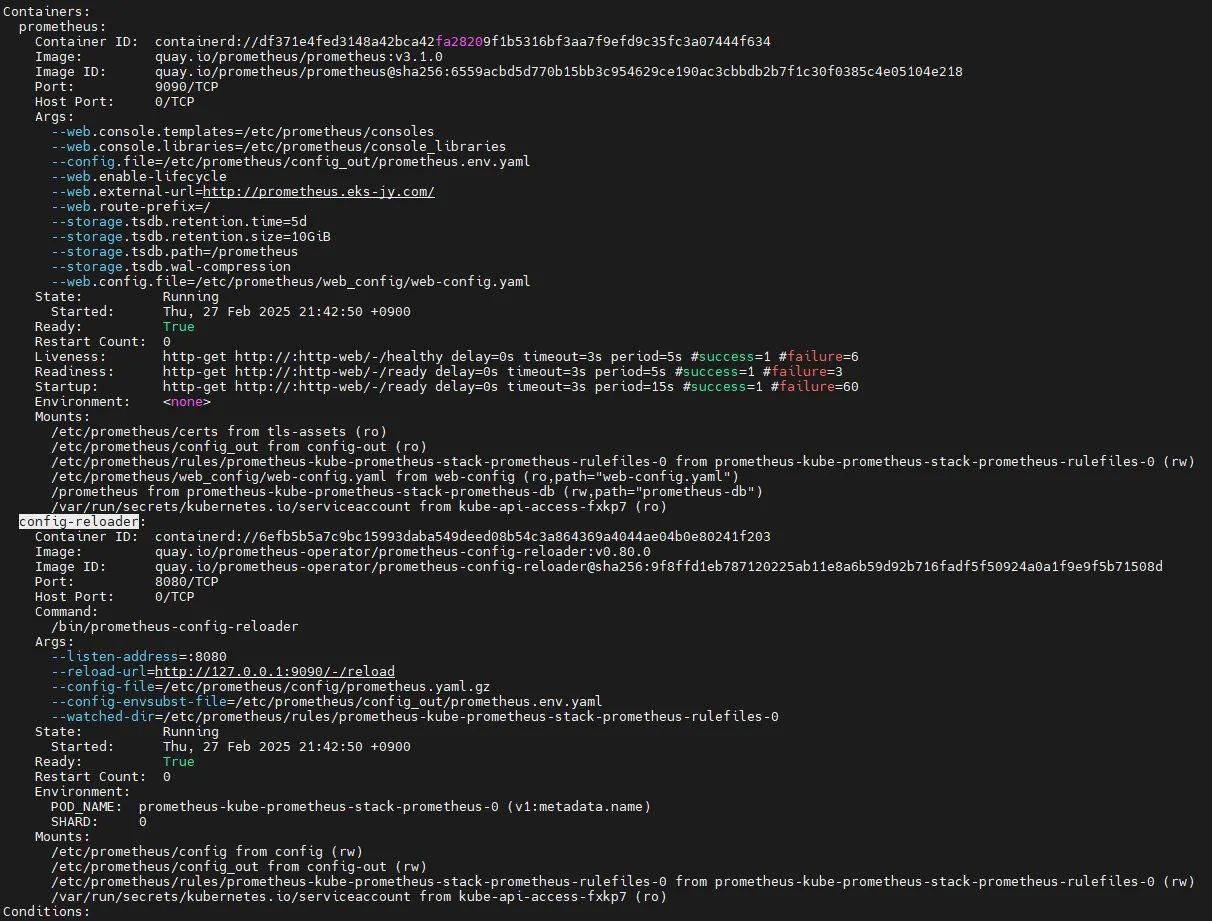
8.4.2 Prometheus 설정 자동 반영 방식
State → Configuration에서nginx검색 후job_name확인- Prometheus의 설정 변경이 자동으로 반영되는 이유는
config-reloader컨테이너가 존재하기 때문입니다. config-reloader는 변경 사항을 감지하고/etc/prometheus/config/prometheus.yaml.gz파일을 업데이트하여 설정을 자동 적용합니다.
#
kubectl describe pod -n monitoring prometheus-kube-prometheus-stack-prometheus-0
...
  config-reloader:
    Container ID:  containerd://55ef5f8170f20afd38c01f136d3e5674115b8593ce4c0c30c2f7557e702ee852
    Image:         quay.io/prometheus-operator/prometheus-config-reloader:v0.72.0
    Image ID:      quay.io/prometheus-operator/prometheus-config-reloader@sha256:89a6c7d3fd614ee1ed556f515f5ecf2dba50eec9af418ac8cd129d5fcd2f5c18
    Port:          8080/TCP
    Host Port:     0/TCP
    Command:
      /bin/prometheus-config-reloader
    Args:
      --listen-address=:8080
      --reload-url=http://127.0.0.1:9090/-/reload
      --config-file=/etc/prometheus/config/prometheus.yaml.gz
      --config-envsubst-file=/etc/prometheus/config_out/prometheus.env.yaml
      --watched-dir=/etc/prometheus/rules/prometheus-kube-prometheus-stack-prometheus-rulefiles-0
...
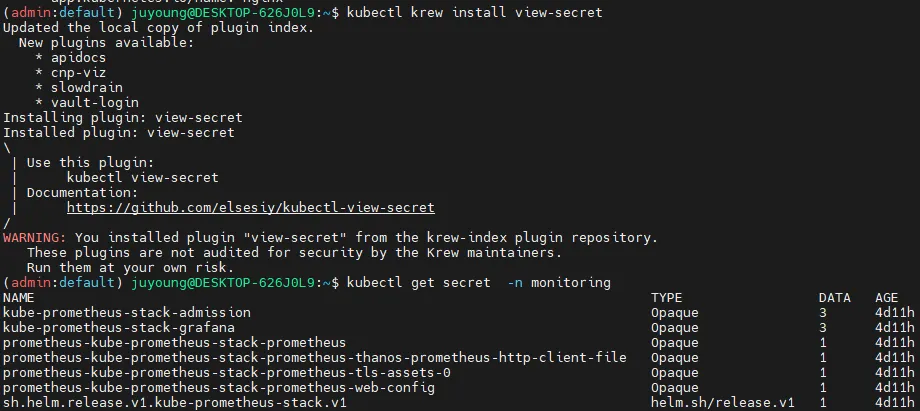
# config-reloader config-file인 /etc/prometheus/config/prometheus.yaml.gz 내용 확인
kubectl krew install view-secret
kubectl get secret -n monitoring
kubectl view-secret -n monitoring prometheus-kube-prometheus-stack-prometheus
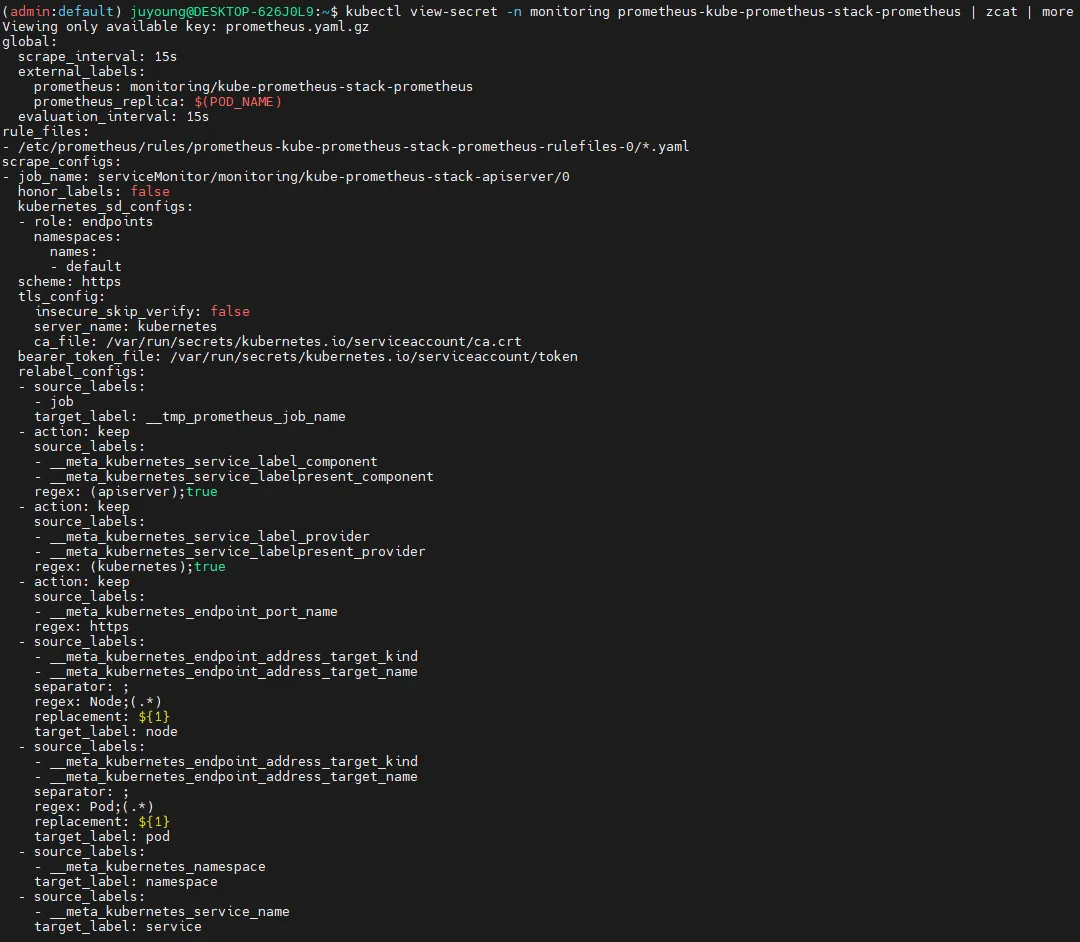
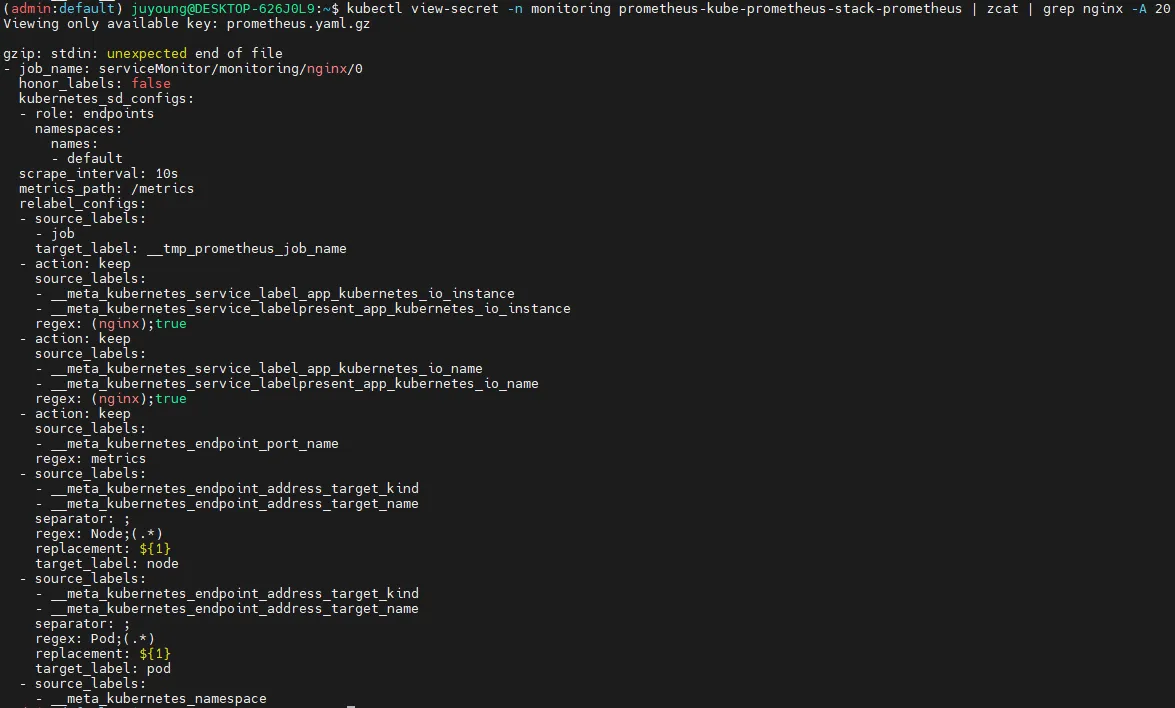
kubectl view-secret -n monitoring prometheus-kube-prometheus-stack-prometheus | zcat | more
kubectl view-secret -n monitoring prometheus-kube-prometheus-stack-prometheus | zcat | grep nginx -A 20
# 아래 job 내용이 자동으로 추가된 것. config-reloader에 의해서.
...
- job_name: serviceMonitor/monitoring/nginx/0
...
8.5 Prometheus에서 NGINX 메트릭 확인
# [운영서버 EC2] 메트릭 확인 >> 프로메테우스에서 Target 확인
# NGINX 메트릭 엔드포인트 조회
## nginx sub_status url 접속해보기
NGINXIP=$(kubectl get pod -l app.kubernetes.io/instance=nginx -o jsonpath="{.items[0].status.podIP}")
curl -s http://$NGINXIP:9113/metrics # nginx_connections_active Y 값 확인해보기
curl -s http://$NGINXIP:9113/metrics | grep ^nginx_connections_active
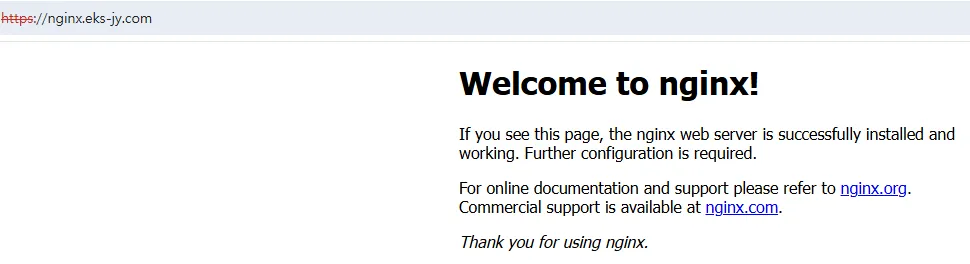
# NGINX 웹 서비스 URL 확인 및 접속
echo -e "Nginx WebServer URL = https://nginx.$MyDomain"
curl -s https://nginx.$MyDomain
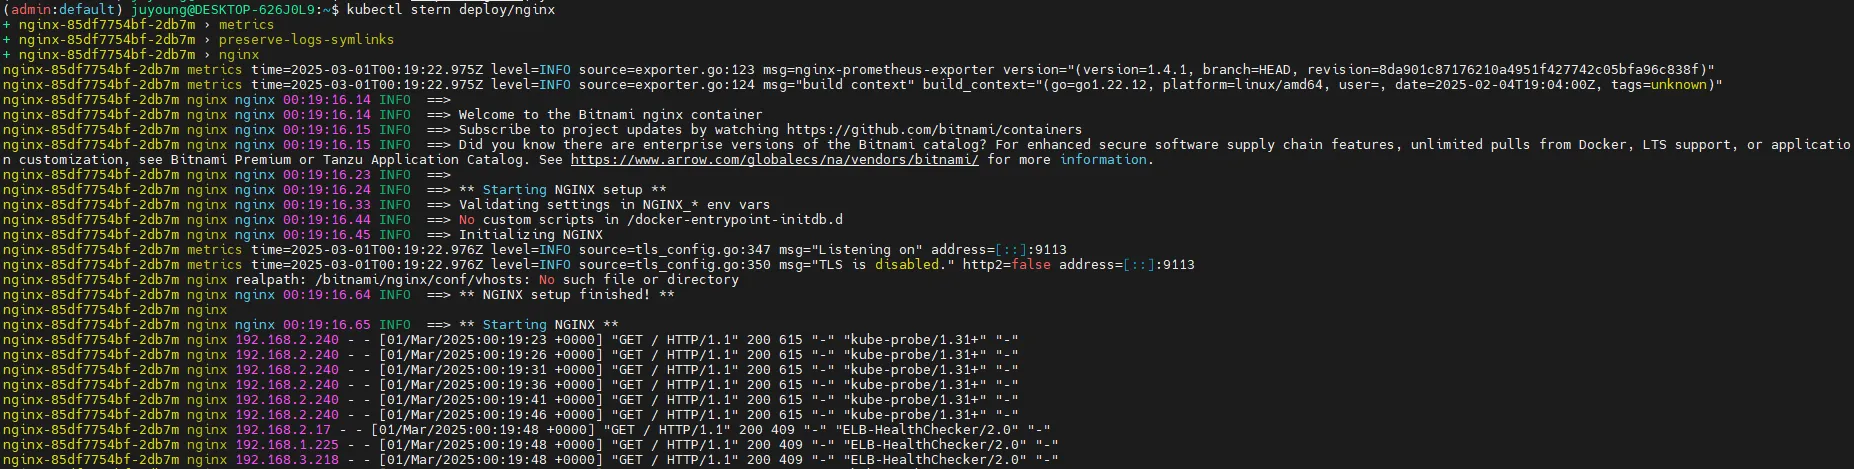
# NGINX 로그 실시간 조회
kubectl stern deploy/nginx
# 반복 접속
while true; do curl -s https://nginx.$MyDomain -I | head -n 1; date; sleep 1; done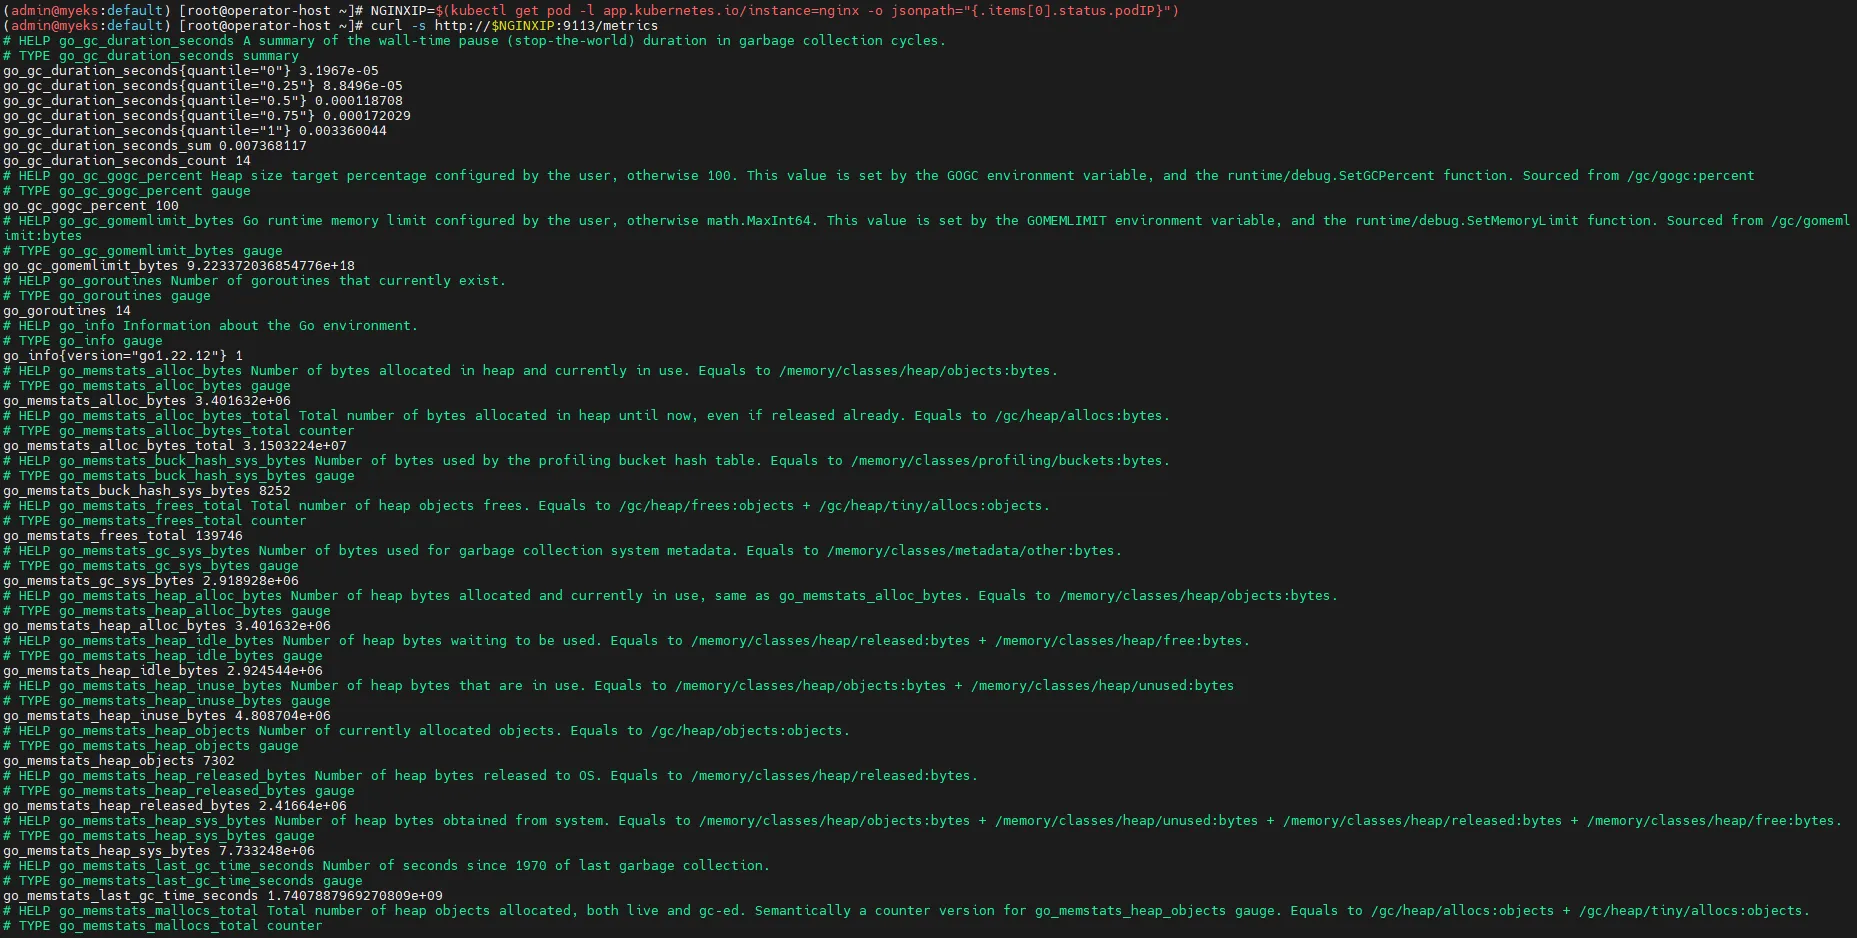


8.6 PromQL을 활용한 NGINX 모니터링
8.6.1 NGINX 스케일 조정 후 메트릭 확인
# NGINX 인스턴스를 2개로 증가
# nginx scale out : Targets 확인
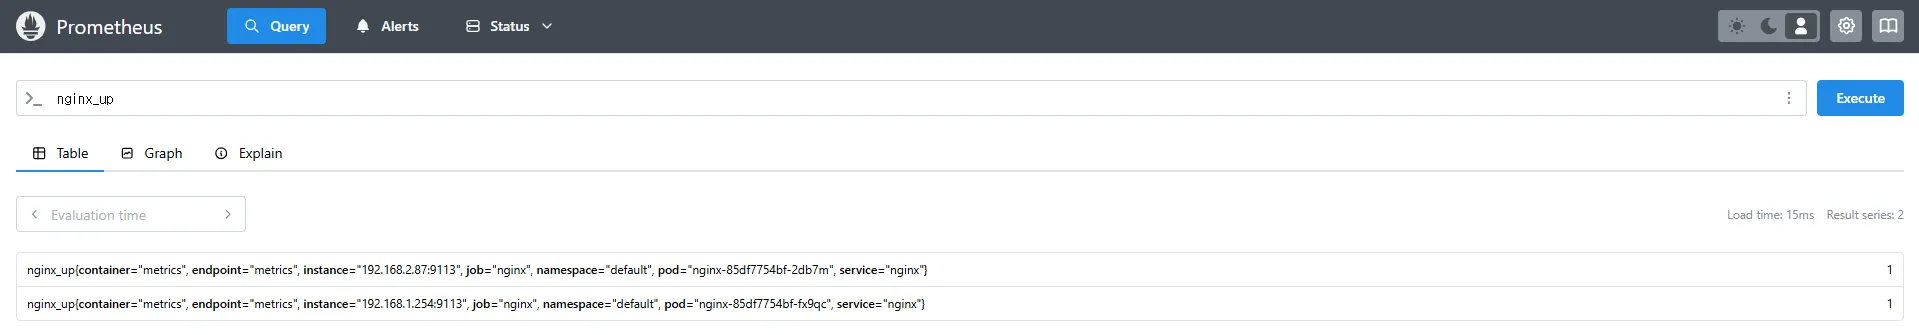
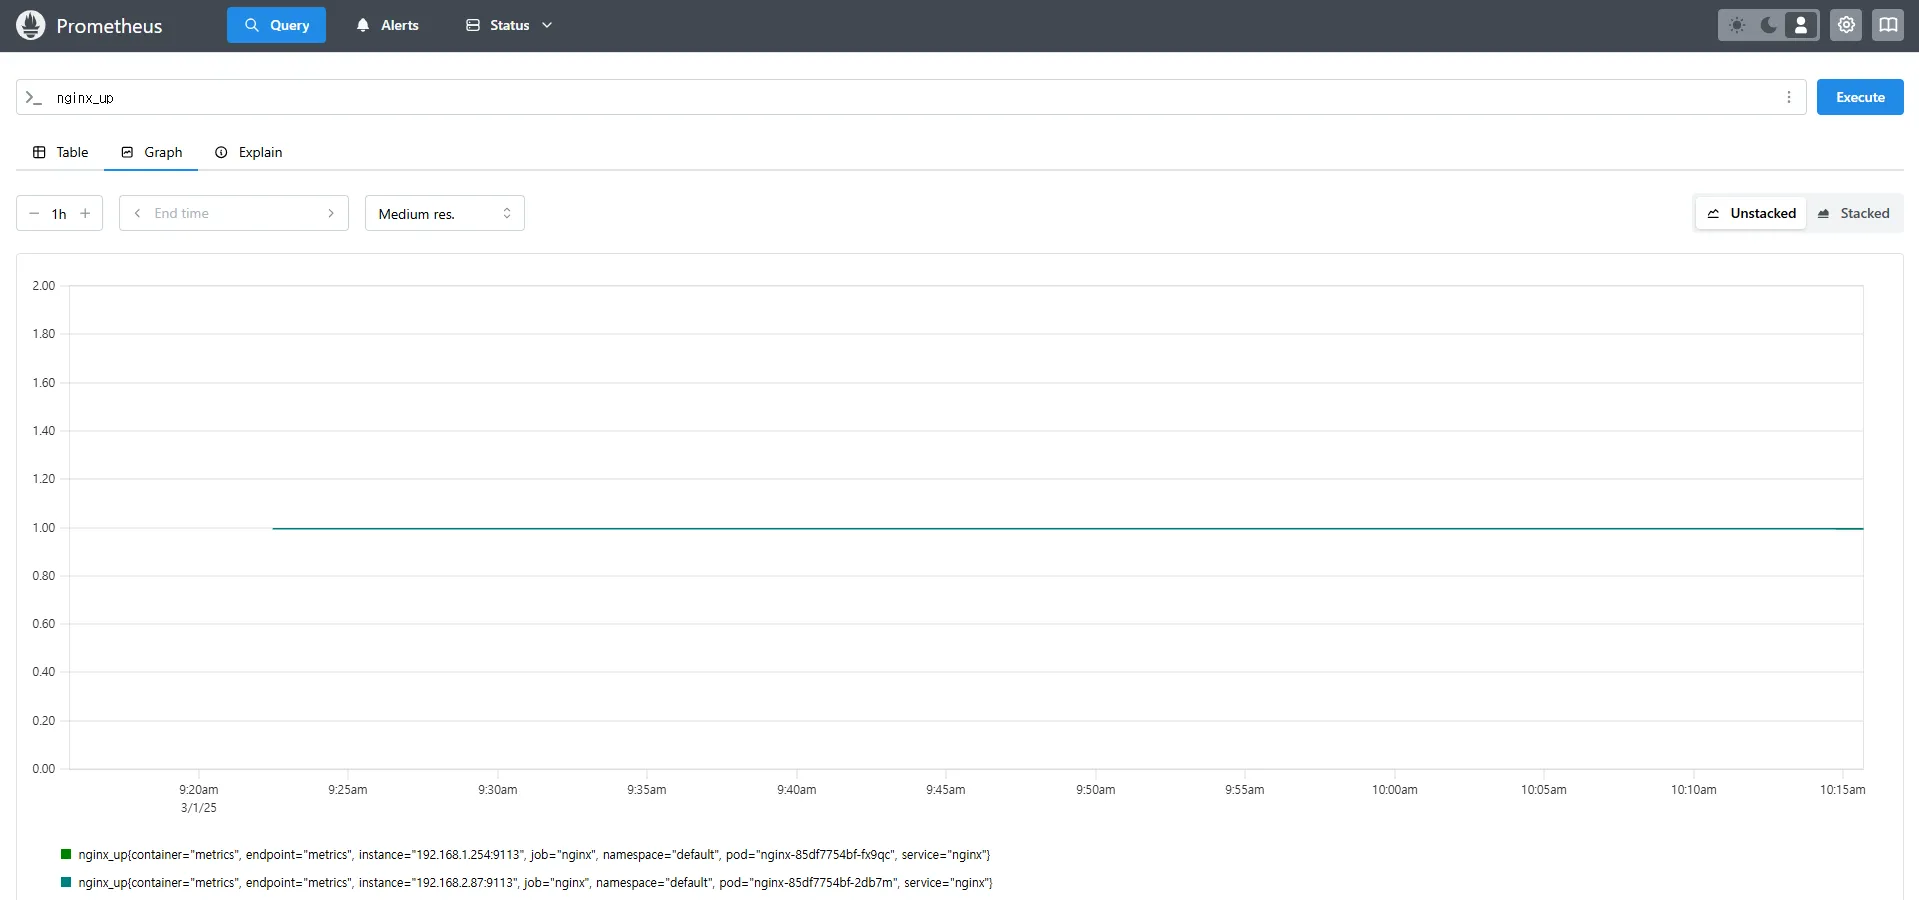
kubectl scale deployment nginx --replicas 2# NGINX 서비스 상태 확인
# 쿼리 Table -> Graph
nginx_up
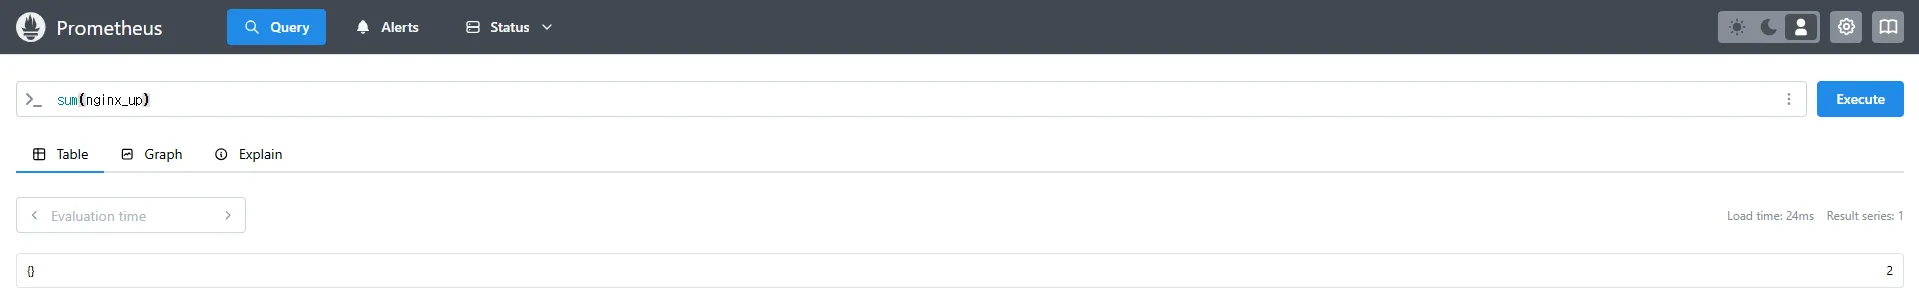
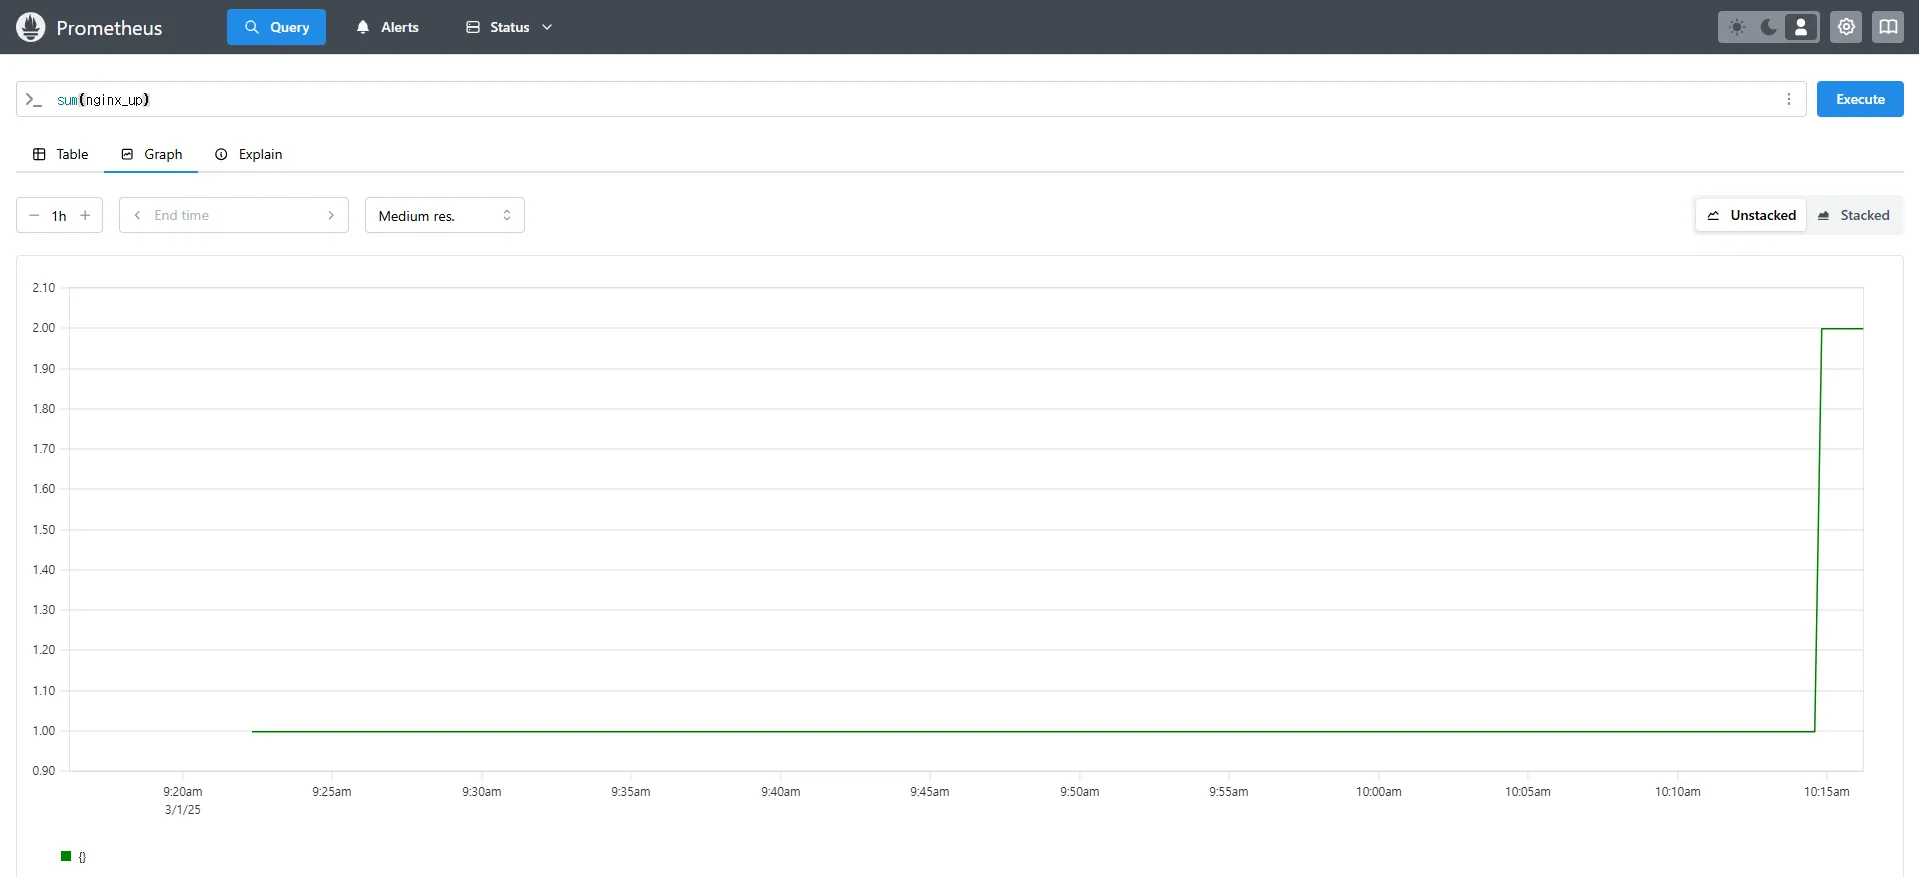
sum(nginx_up)
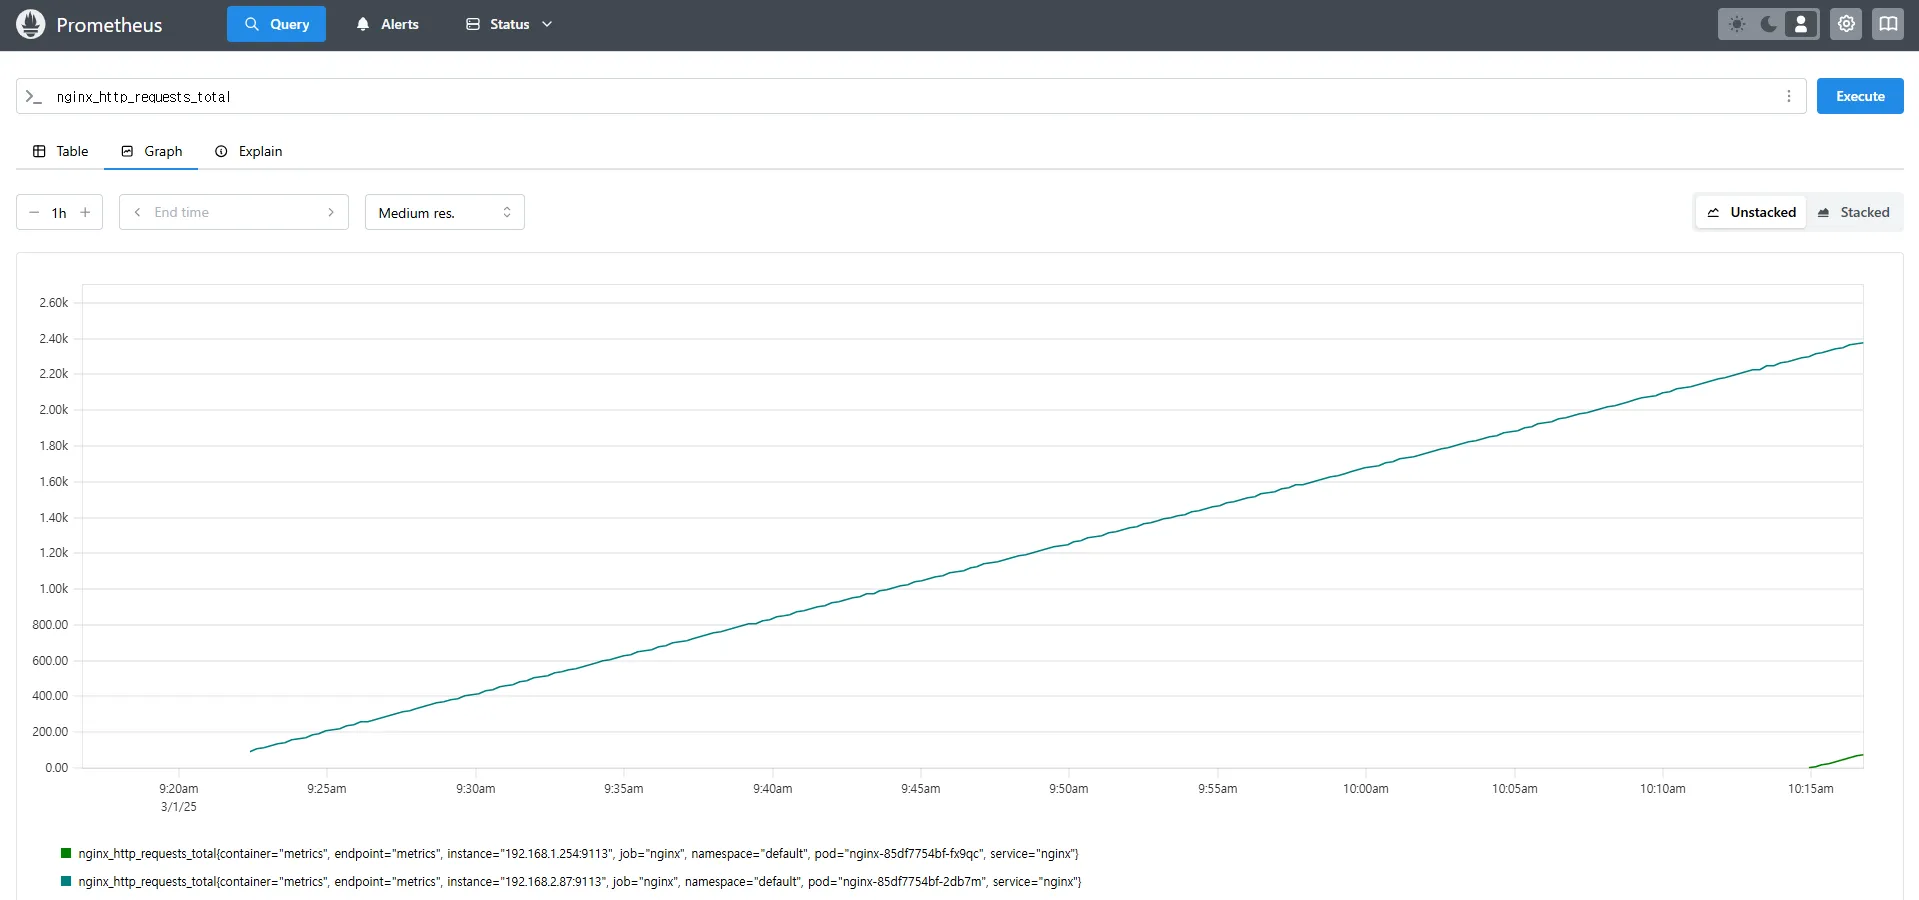
# NGINX 요청 수 확인
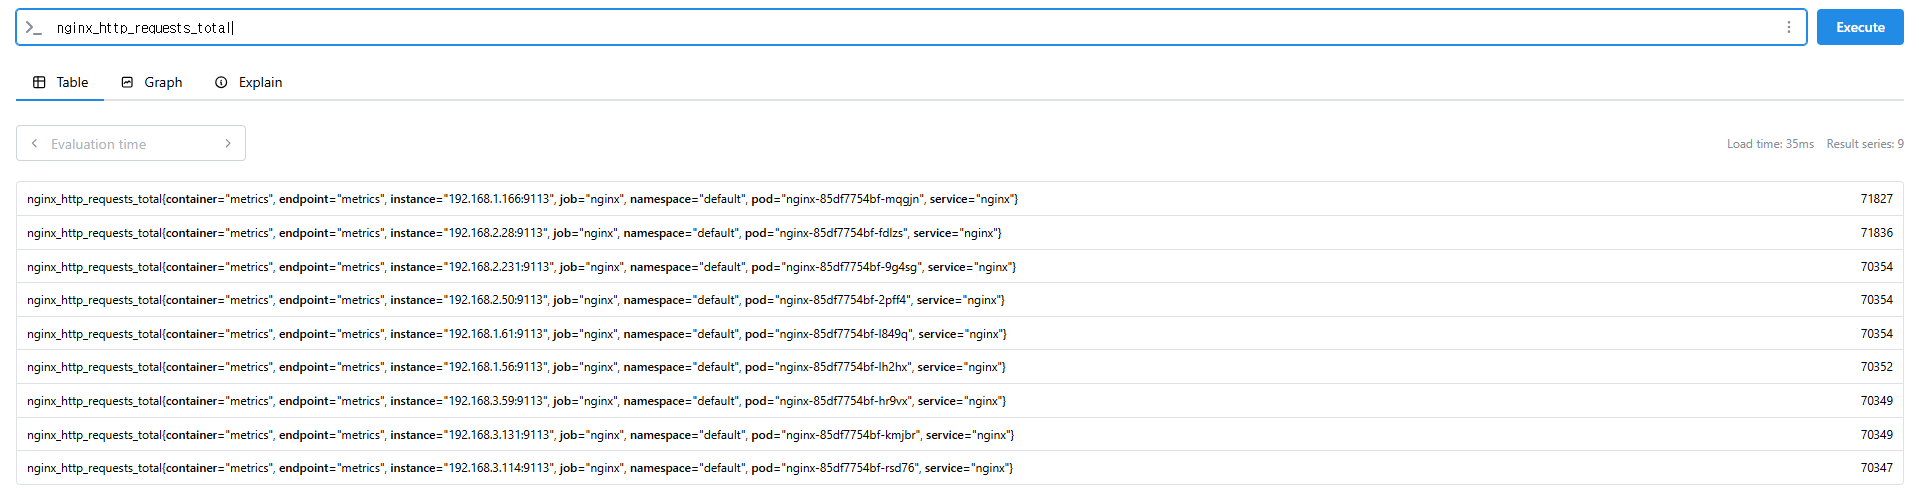
nginx_http_requests_total
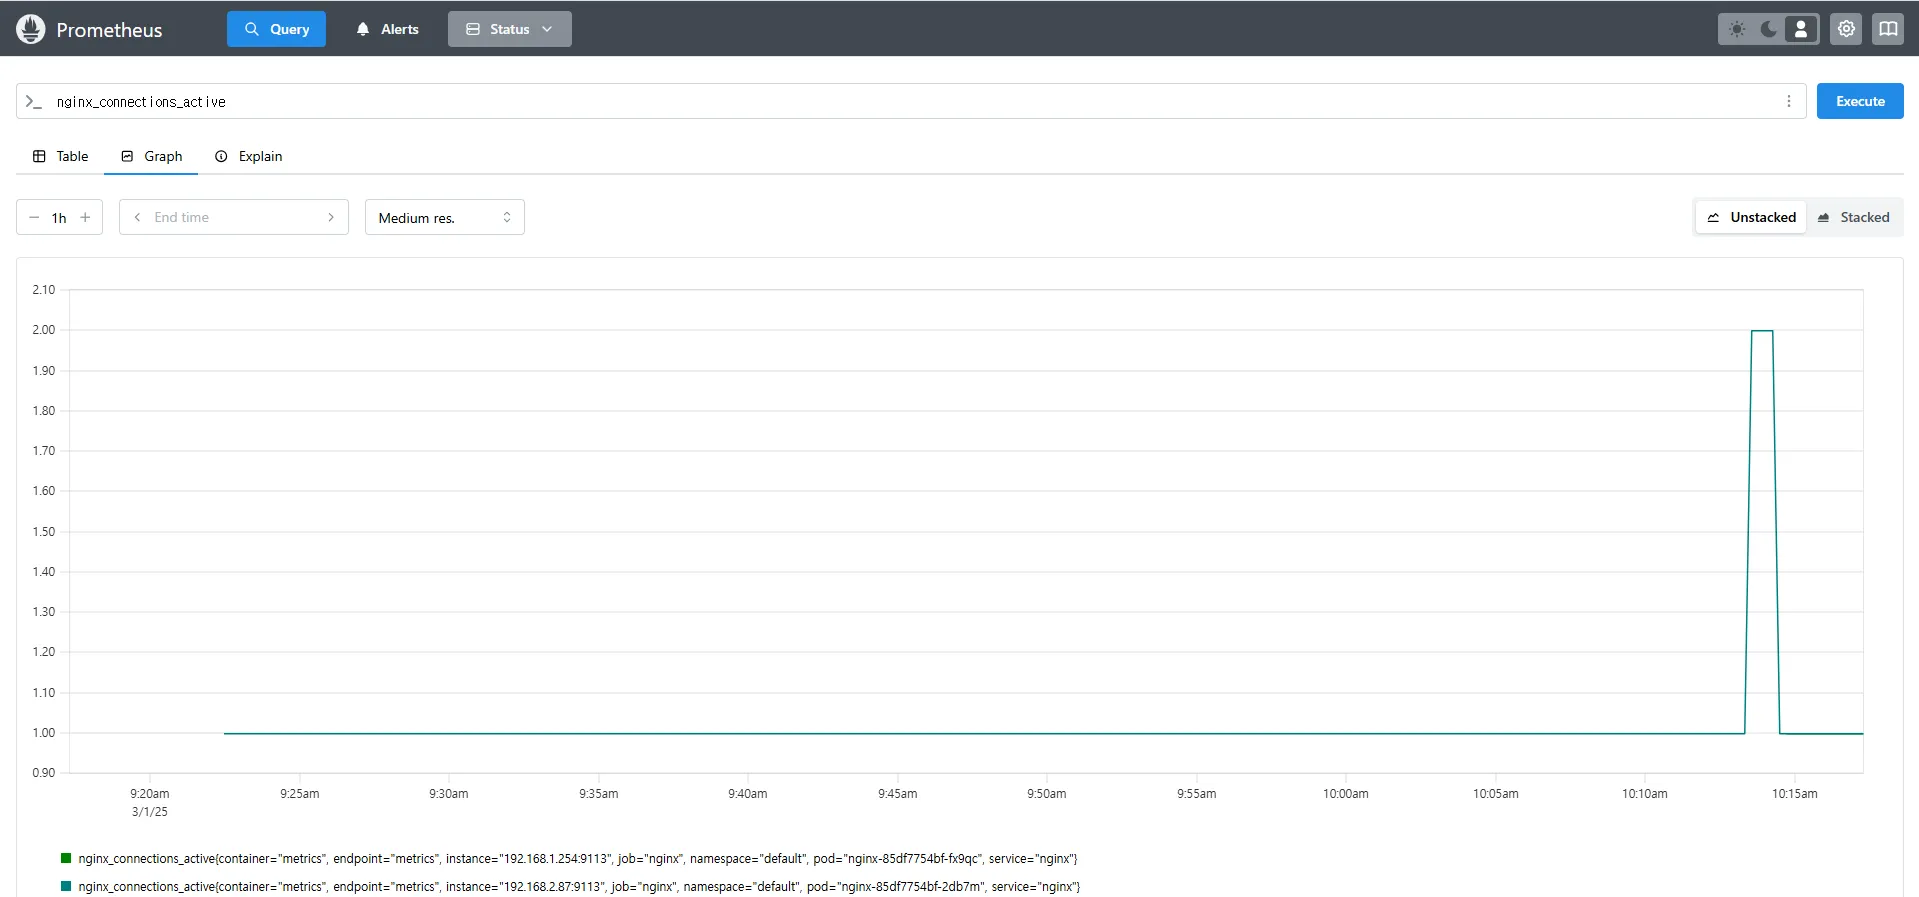
nginx_connections_active
9. PromQL 기본 개념 및 활용
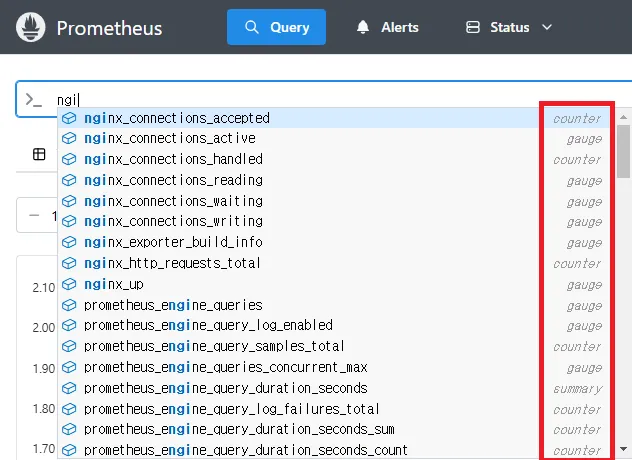
9.1 Prometheus 메트릭 타입
Prometheus는 4가지 타입의 메트릭을 지원합니다. Link
| 메트릭 유형 | 설명 |
|---|---|
| Counter | 누적된 값. 증가하는 값. 증가 시 구간 별로 변화(추세), 함수 등으로 활용 (예: 요청 수, 오류 발생 수) |
| Gauge | 특정 시점의 값을 표현 (예: CPU 사용률, 온도) |
| Histogram | 사전에 미리 정의한 특정 구간 내 값의 빈도를 측정 → 함수로 측정 포맷을 변경 |
| Summary | 일정 기간 동안의 통계를 계산 (예: 평균, 중앙값) |
9.2 PromQL Query
9.2.1 라벨 매칭(Label Matchers)
= , ! = , =~ 정규표현식
# 예시
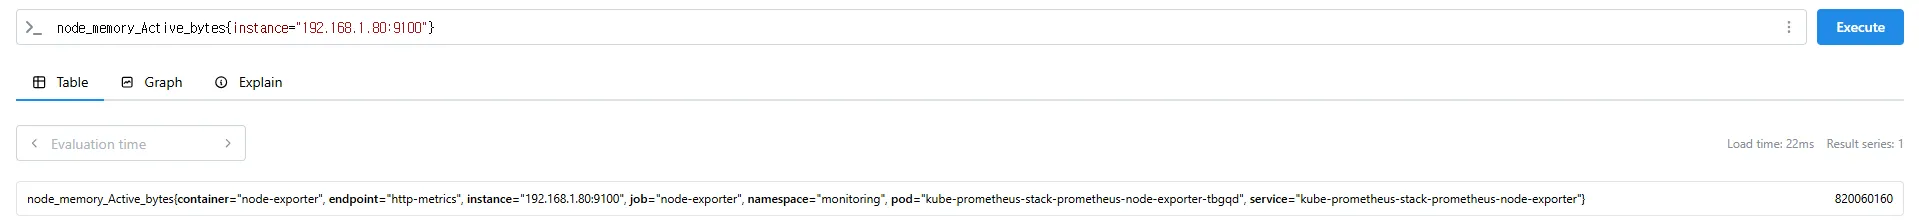
node_memory_Active_bytes
node_memory_Active_bytes{instance="192.168.1.188:9100"}
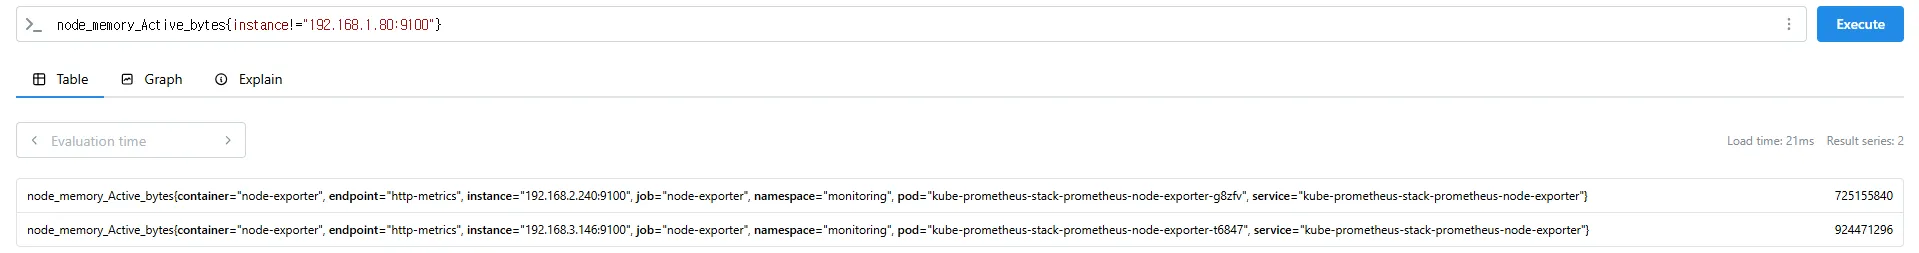
node_memory_Active_bytes{instance!="192.168.1.188:9100"}
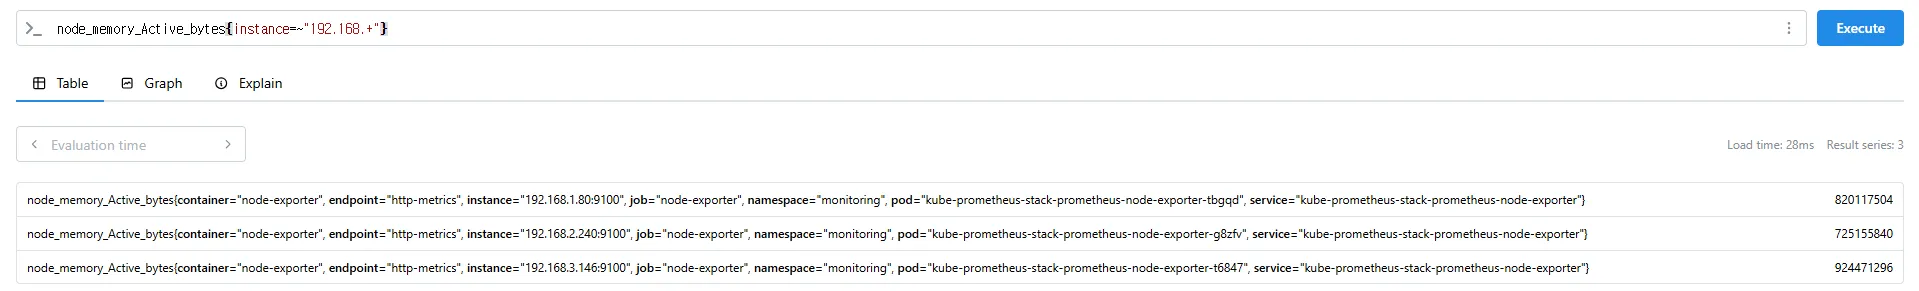
# 정규표현식
node_memory_Active_bytes{instance=~"192.168.+"}
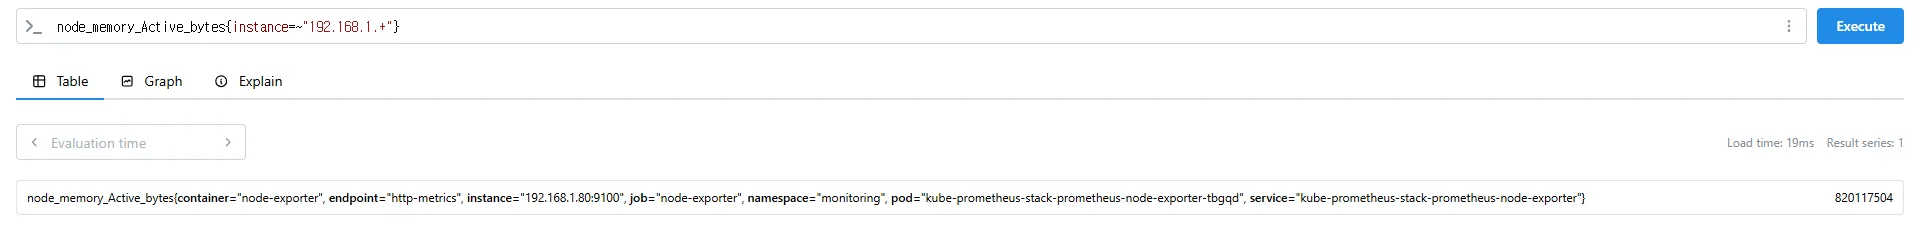
node_memory_Active_bytes{instance=~"192.168.1.+"}
# 다수 대상
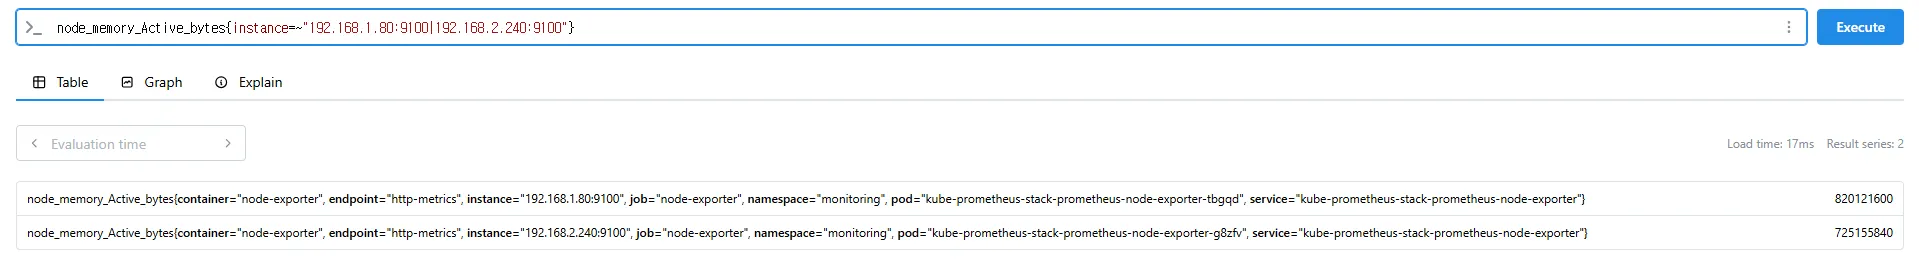
node_memory_Active_bytes{instance=~"192.168.1.188:9100|192.168.2.170:9100"}
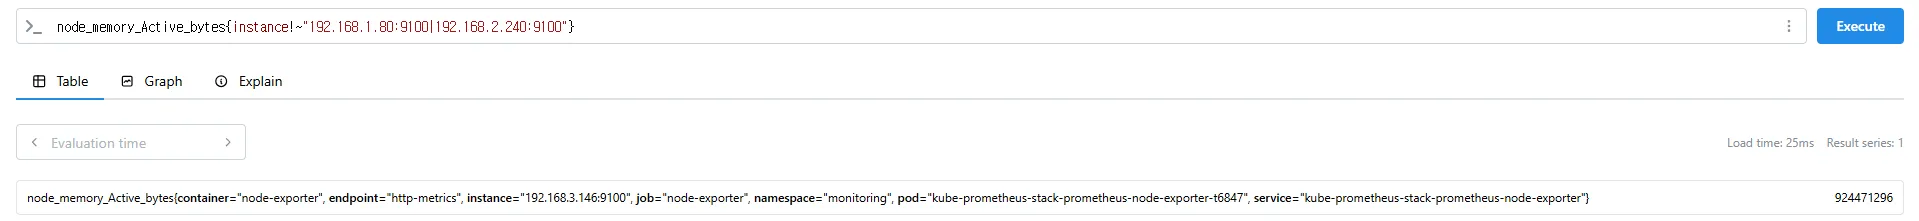
node_memory_Active_bytes{instance!~"192.168.1.188:9100|192.168.2.170:9100"}
# 여러 조건 AND
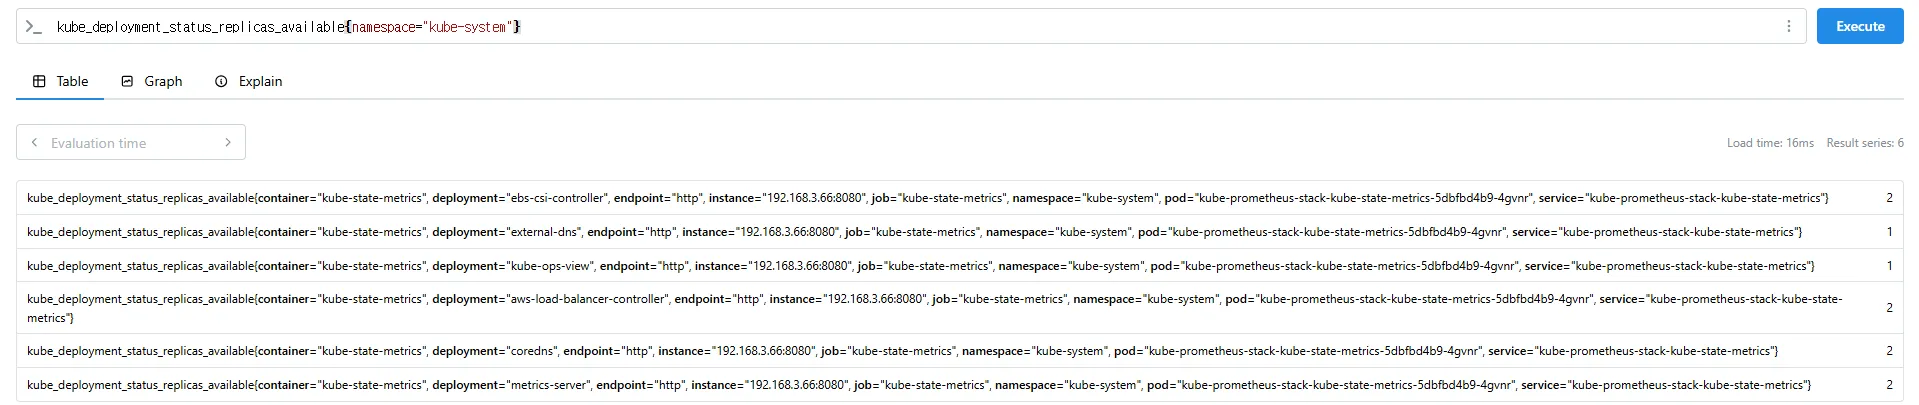
kube_deployment_status_replicas_available{namespace="kube-system"}
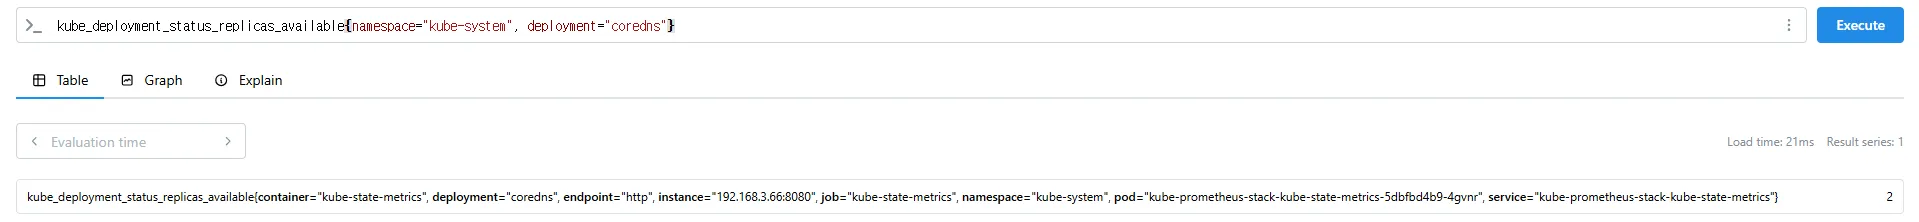
kube_deployment_status_replicas_available{namespace="kube-system", deployment="coredns"}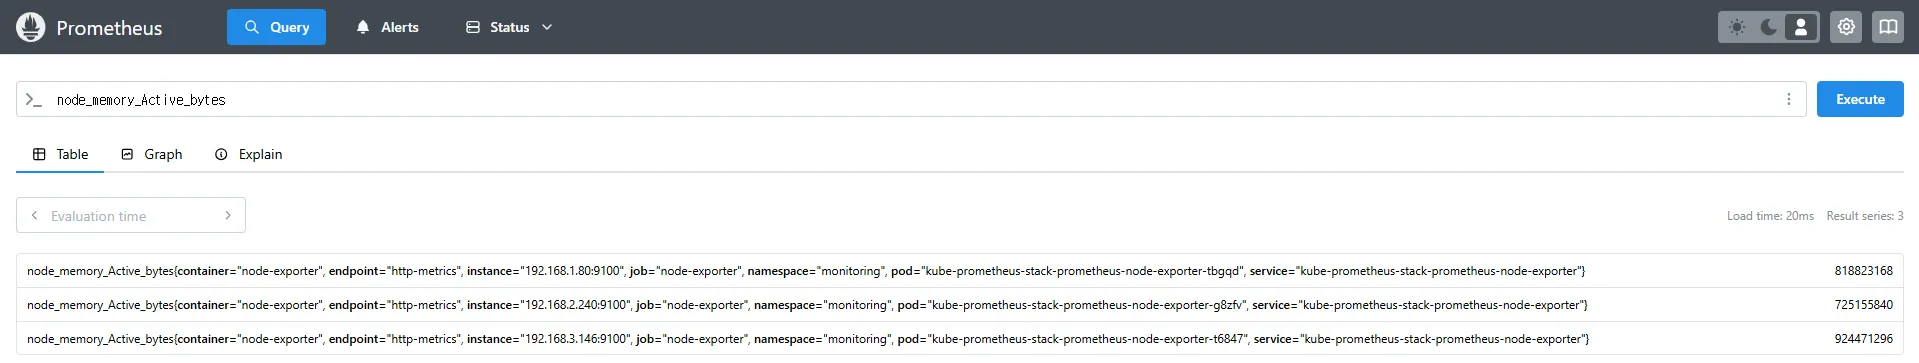
9.2.2 이진 연산자 (Binary Operators)
- 산술 이진 연산자 : + - / ^
- 비교 이진 연산자 : = = ! = > < > = < =
- 논리/집합 이진 연산자 : and 교집합 , or 합집합 , unless 차집합
# 산술 이진 연산자 : + - * / * ^
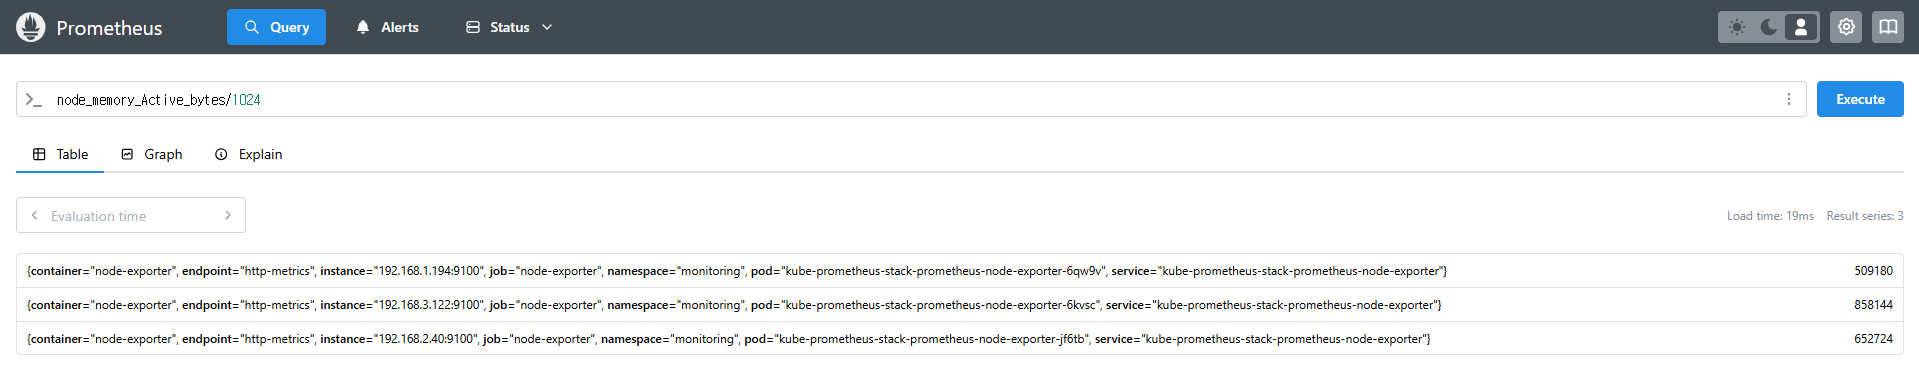
node_memory_Active_bytes
node_memory_Active_bytes/1024
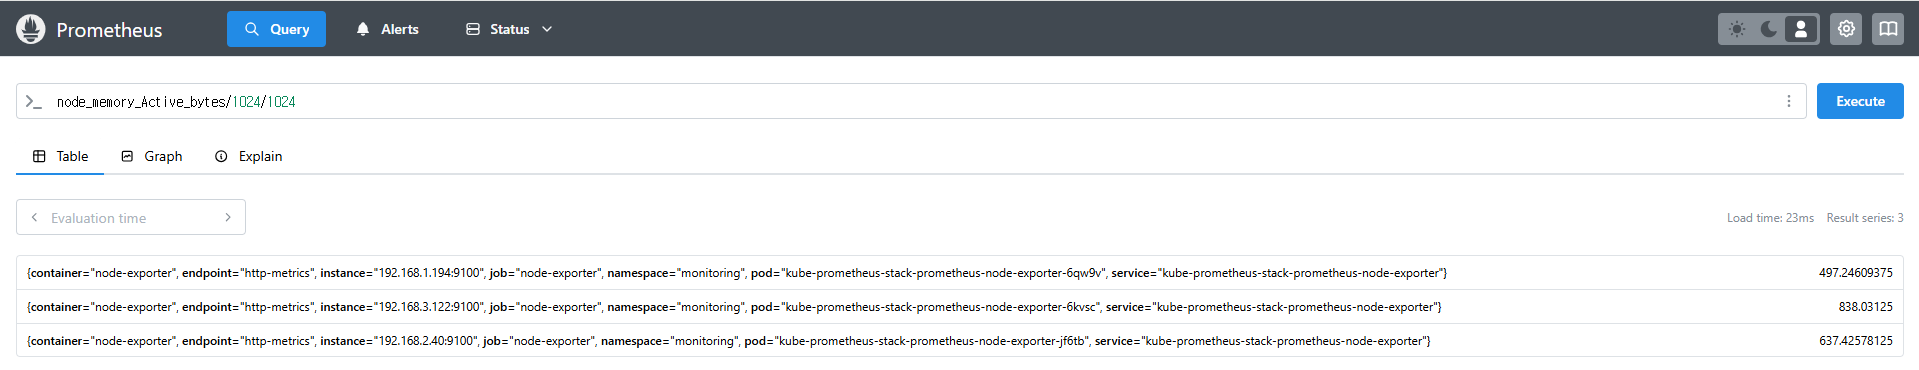
node_memory_Active_bytes/1024/1024
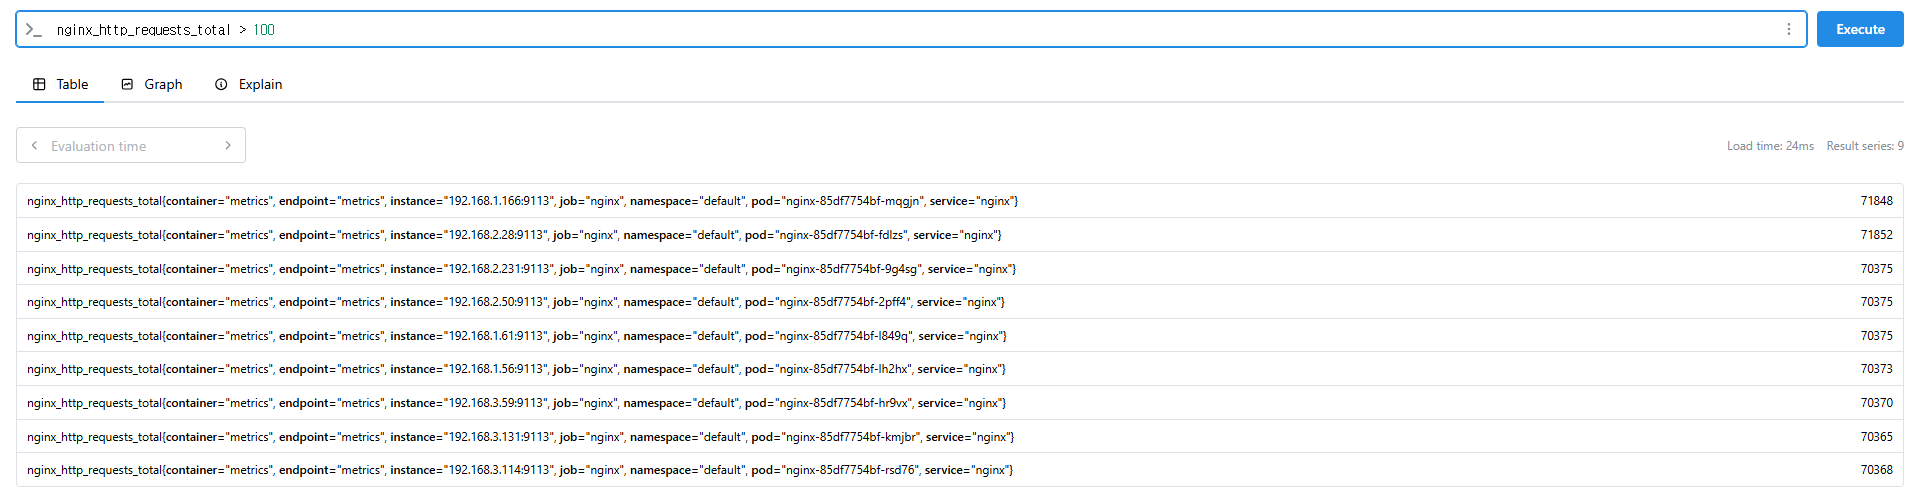
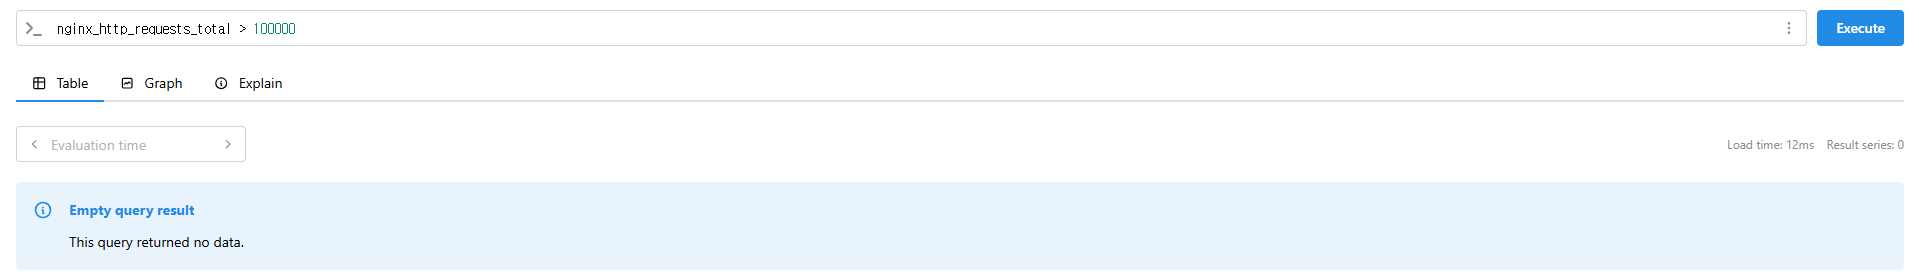
# 비교 이진 연산자 : = = ! = > < > = < =
nginx_http_requests_total
nginx_http_requests_total > 100
nginx_http_requests_total > 10000
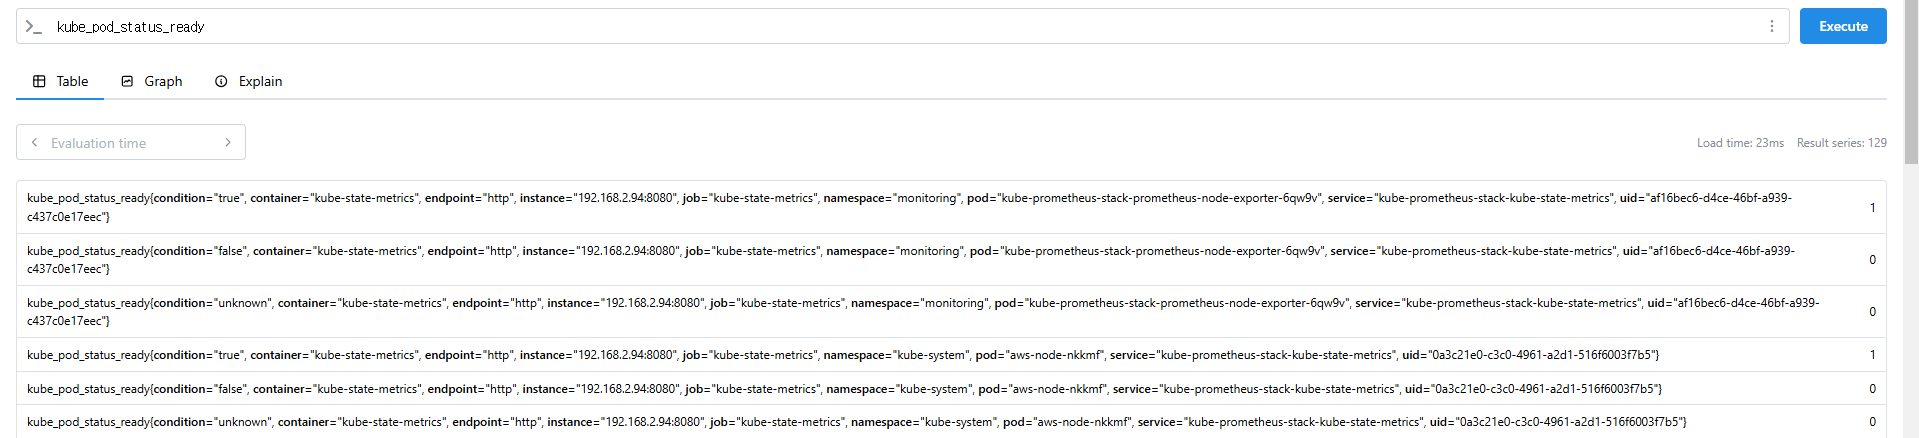
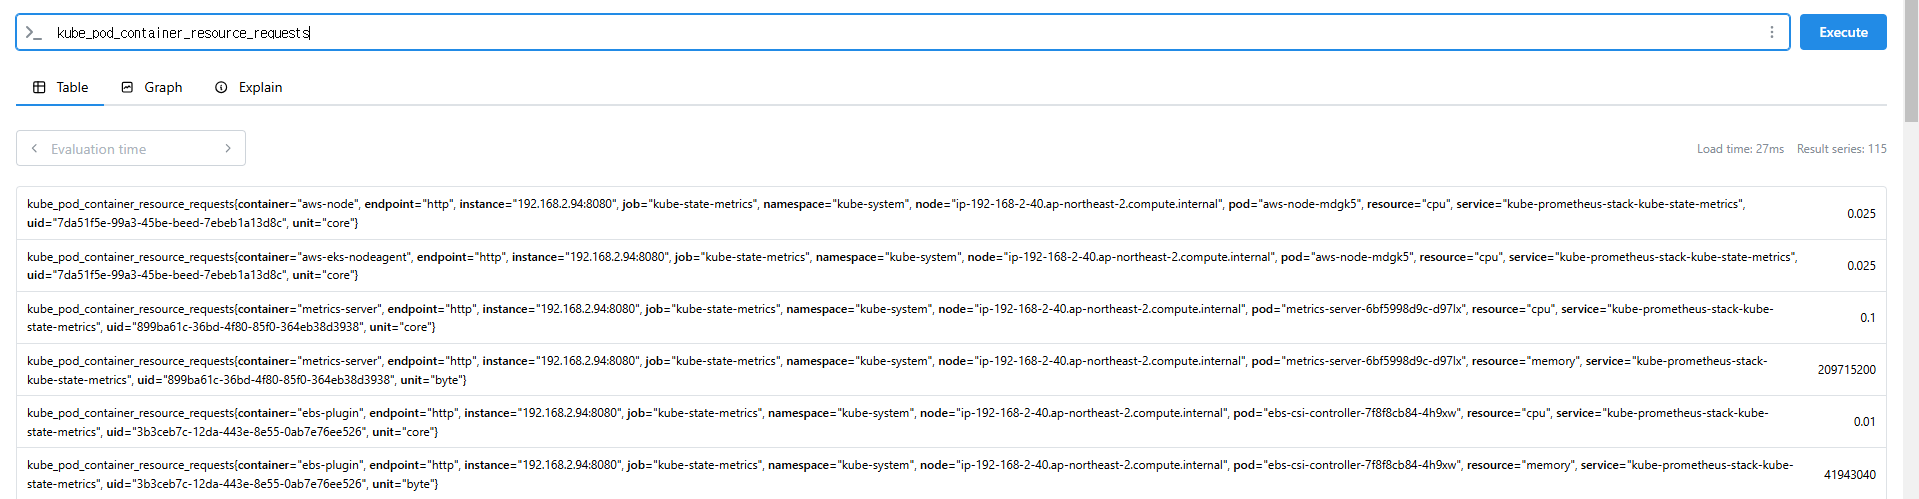
# 논리/집합 이진 연산자 : and 교집합 , or 합집합 , unless 차집합
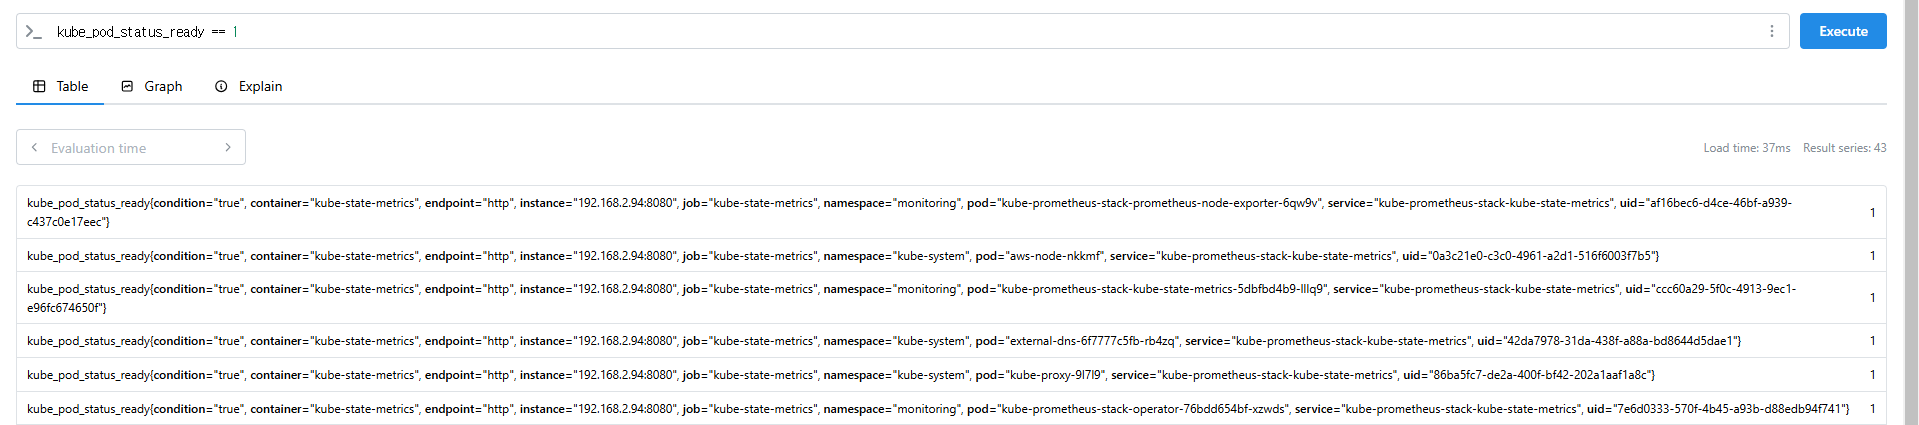
kube_pod_status_ready
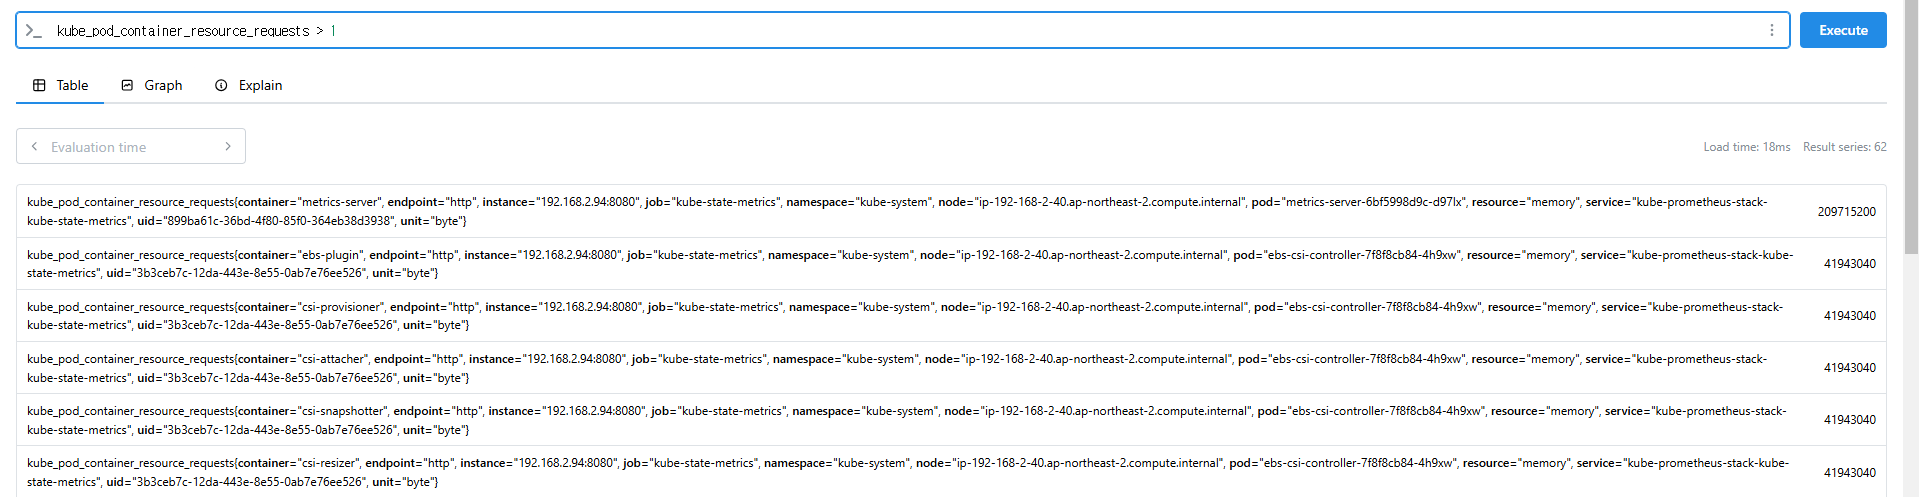
kube_pod_container_resource_requests
kube_pod_status_ready == 1
kube_pod_container_resource_requests > 1
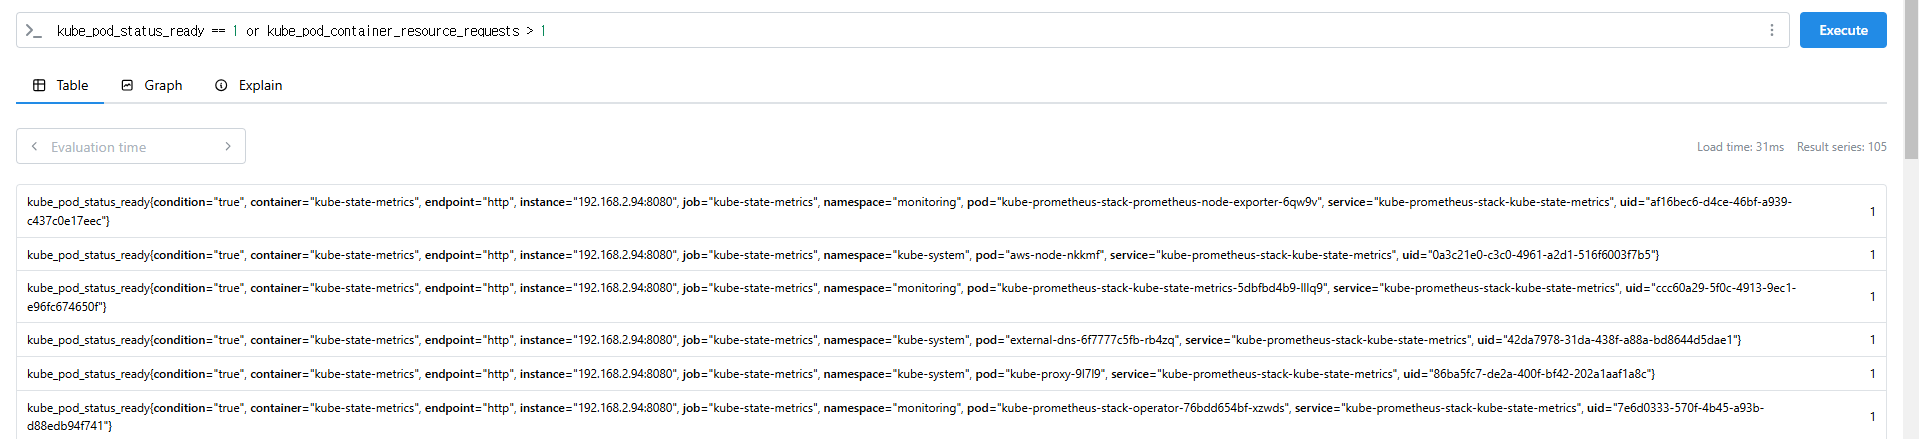
kube_pod_status_ready == 1 or kube_pod_container_resource_requests > 1
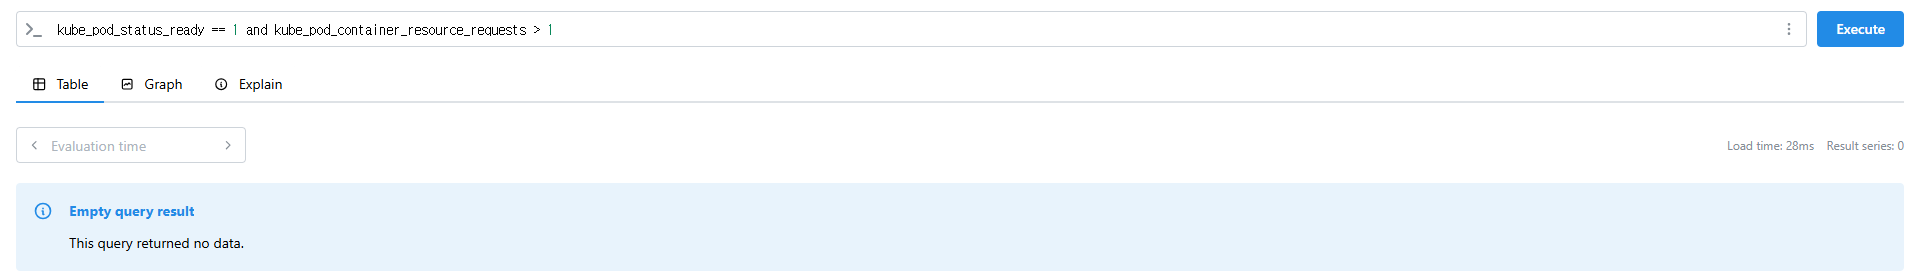
kube_pod_status_ready == 1 and kube_pod_container_resource_requests > 1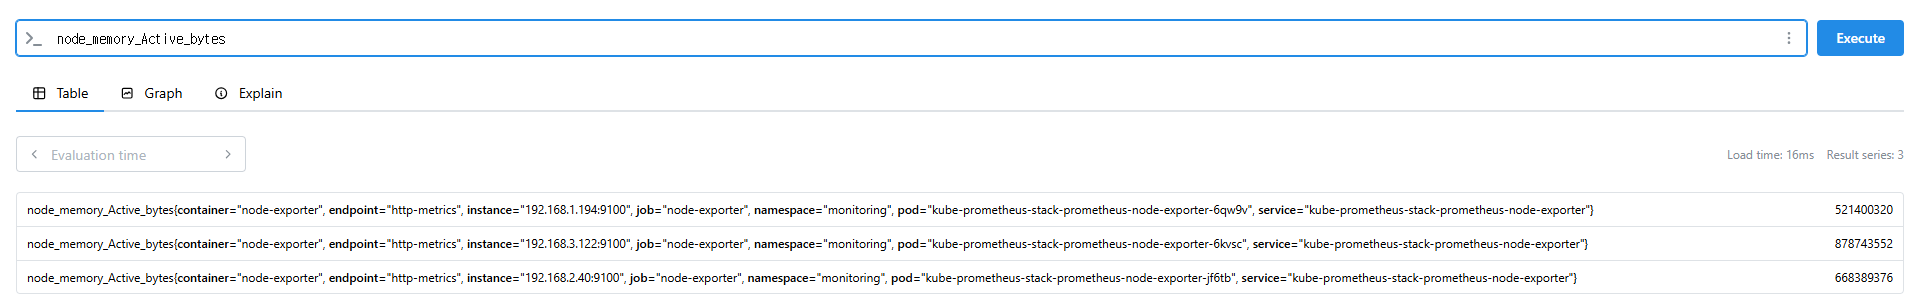
9.2.3 집계 연산자 (Aggregation Operators)
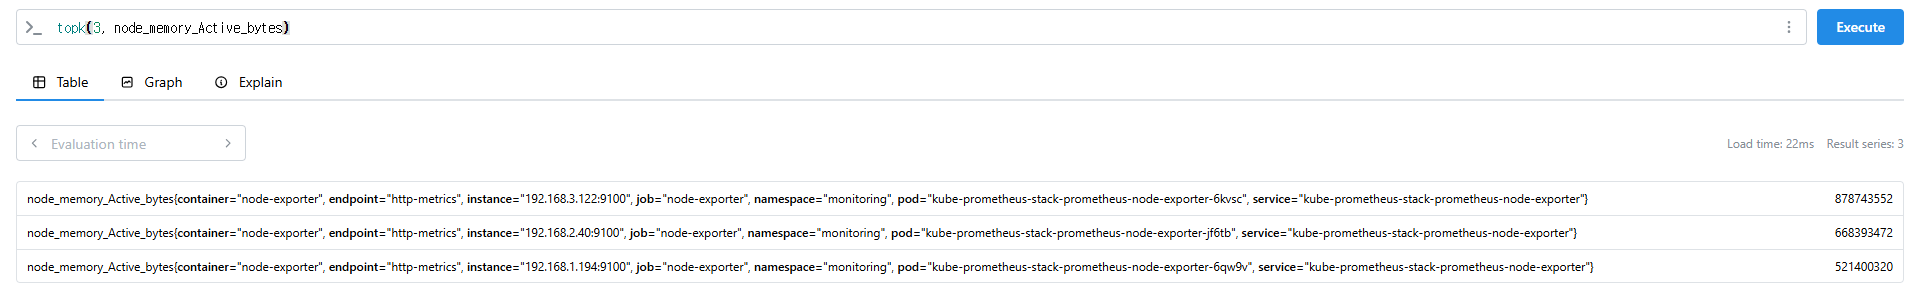
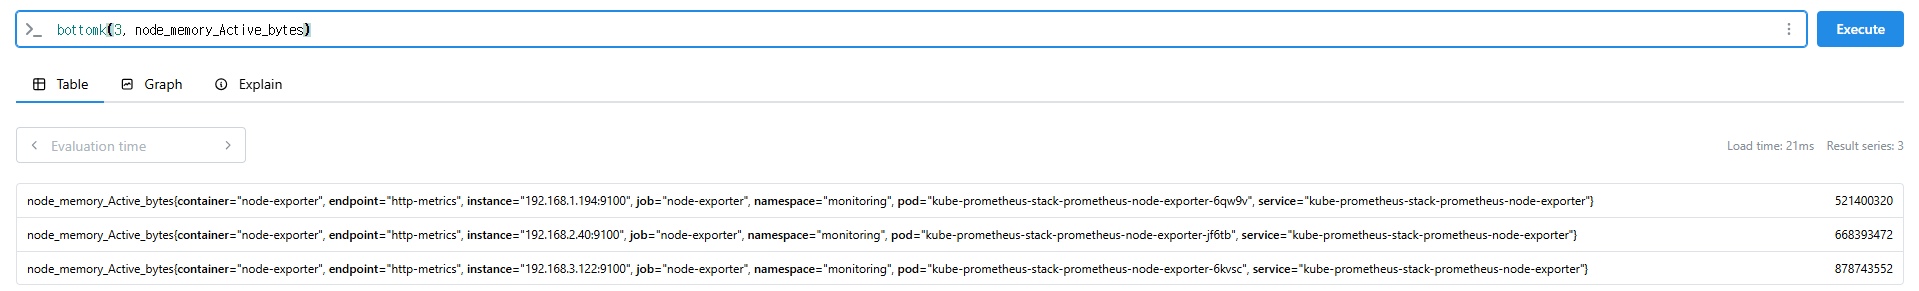
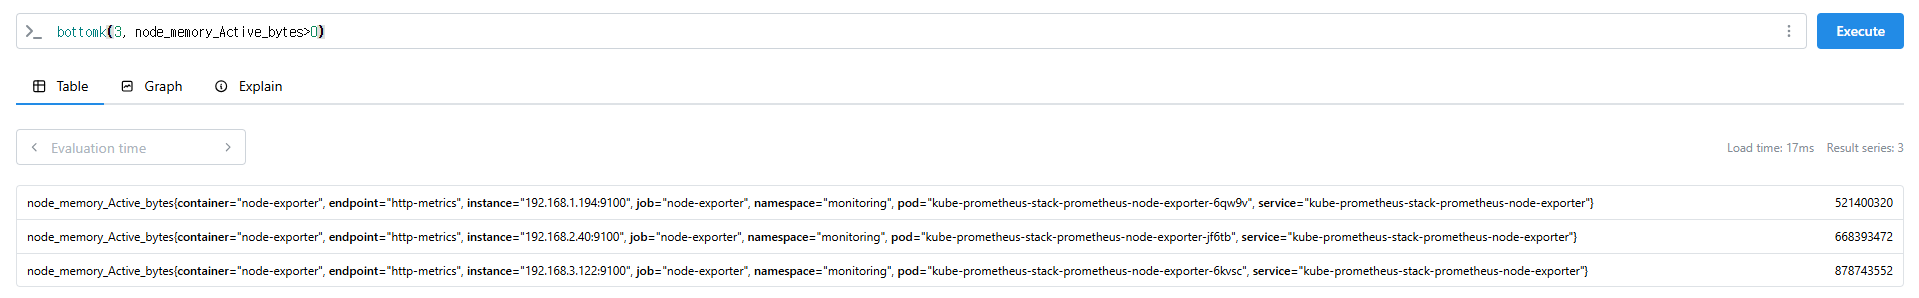
sum(calculate sum over dimensions) : 조회된 값들을 모두 더함min(select minimum over dimensions) : 조회된 값에서 가장 작은 값을 선택max(select maximum over dimensions) : 조회된 값에서 가장 큰 값을 선택avg(calculate the average over dimensions) : 조회된 값들의 평균 값을 계산group(all values in the resulting vector are 1) : 조회된 값을 모두 ‘1’로 바꿔서 출력stddev(calculate population standard deviation over dimensions) : 조회된 값들의 모 표준 편차를 계산stdvar(calculate population standard variance over dimensions) : 조회된 값들의 모 표준 분산을 계산count(count number of elements in the vector) : 조회된 값들의 갯수를 출력 / 인스턴스 벡터에서만 사용 가능count_values(count number of elements with the same value) : 같은 값을 가지는 요소의 갯수를 출력bottomk(smallest k elements by sample value) : 조회된 값들 중에 가장 작은 값들 k 개 출력topk(largest k elements by sample value) : 조회된 값들 중에 가장 큰 값들 k 개 출력quantile(calculate φ-quantile (0 ≤ φ ≤ 1) over dimensions) : 조회된 값들을 사분위로 나눠서 (0 < $ < 1)로 구성하고, $에 해당 하는 요소들을 출력
#
node_memory_Active_bytes
# 출력 값 중 Top 3
topk(3, node_memory_Active_bytes)
# 출력 값 중 하위 3
bottomk(3, node_memory_Active_bytes)
bottomk(3, node_memory_Active_bytes>0)
# node 그룹별: by
node_cpu_seconds_total
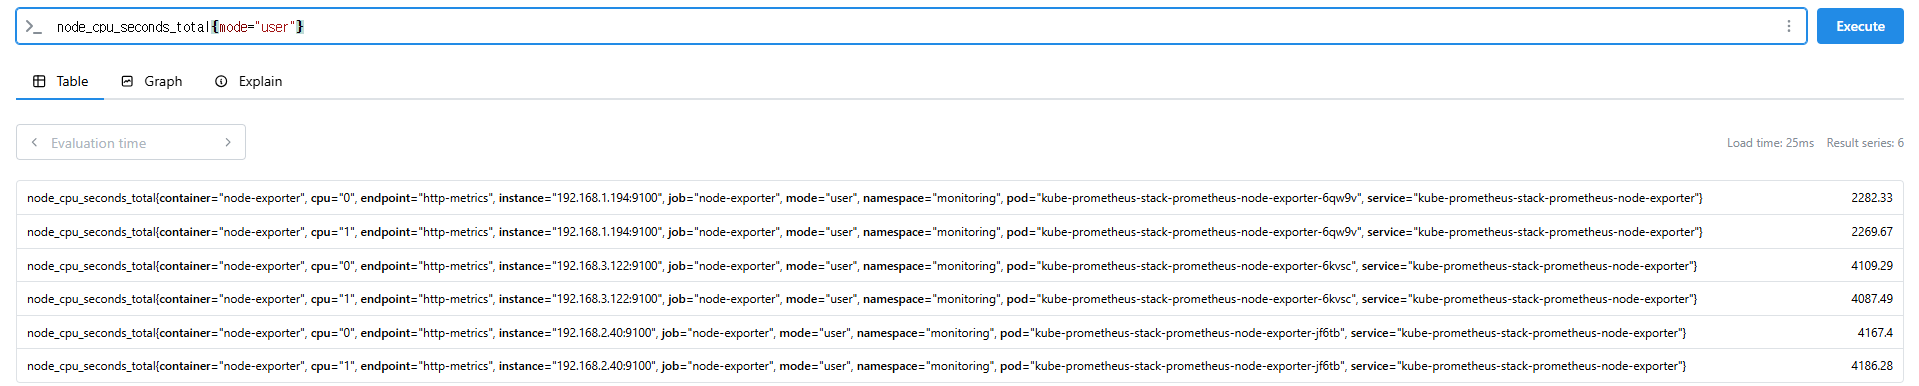
node_cpu_seconds_total{mode="user"}
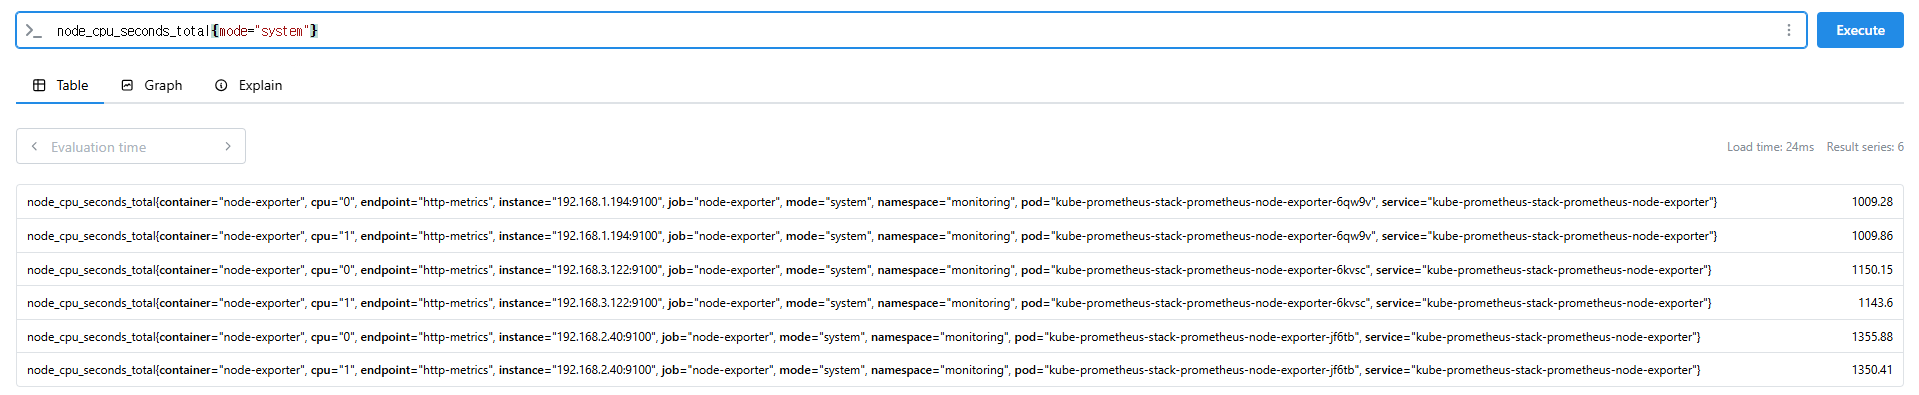
node_cpu_seconds_total{mode="system"}
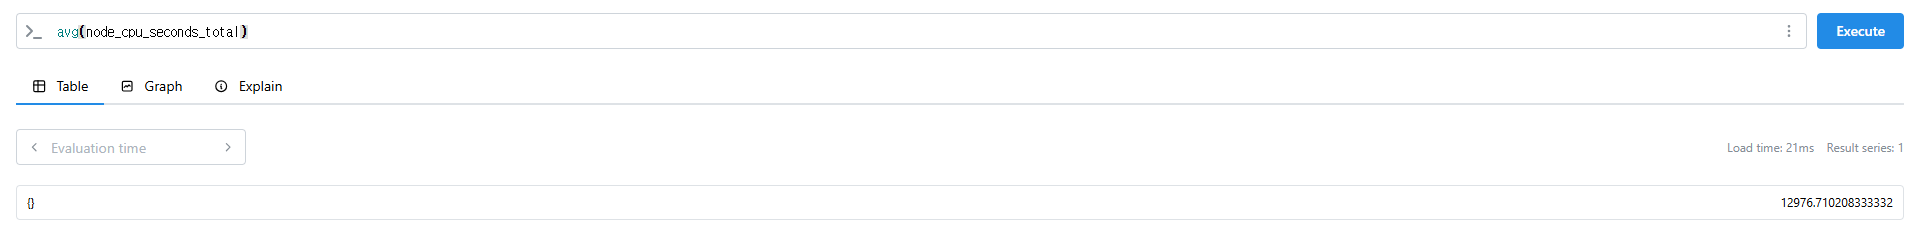
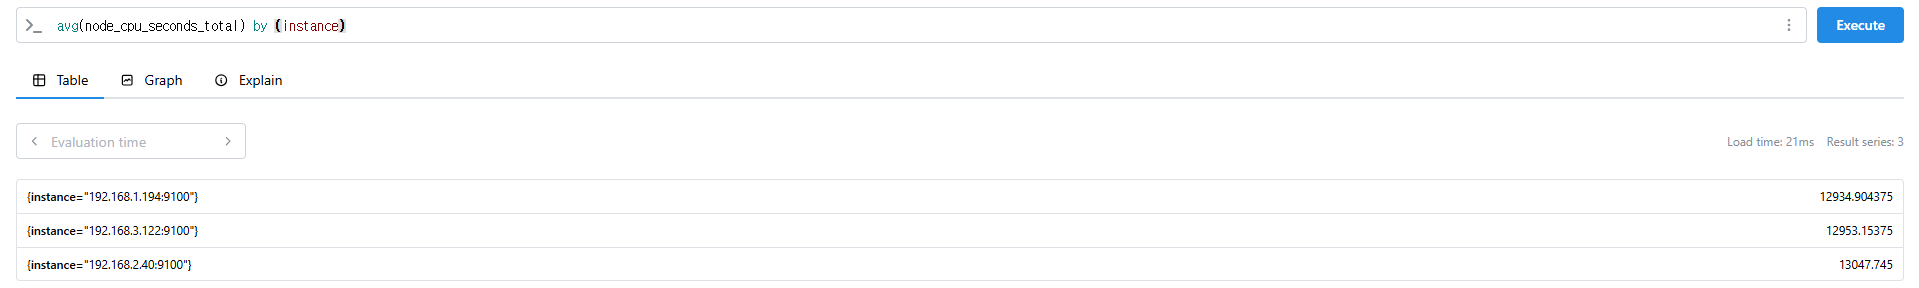
avg(node_cpu_seconds_total)
avg(node_cpu_seconds_total) by (instance)
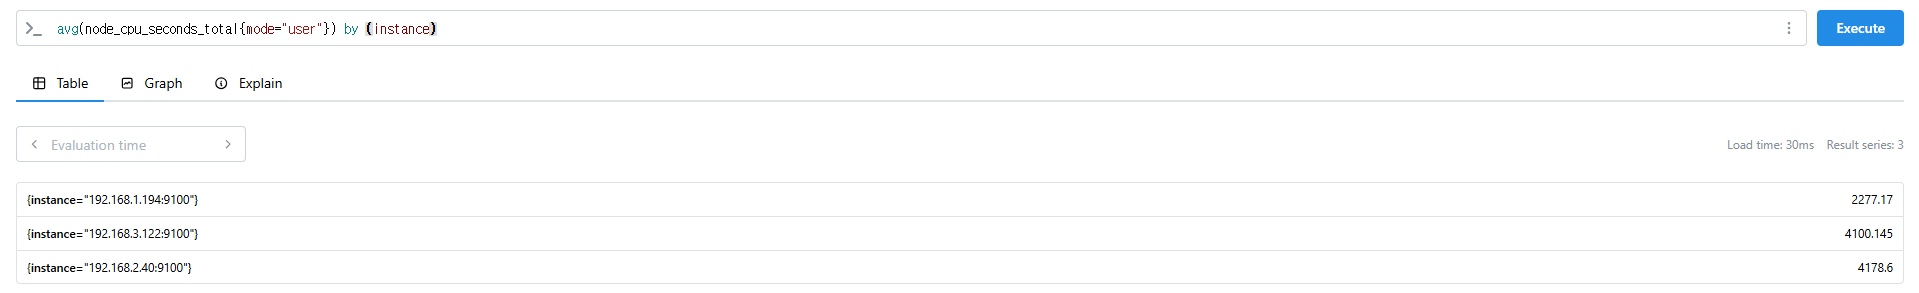
avg(node_cpu_seconds_total{mode="user"}) by (instance)
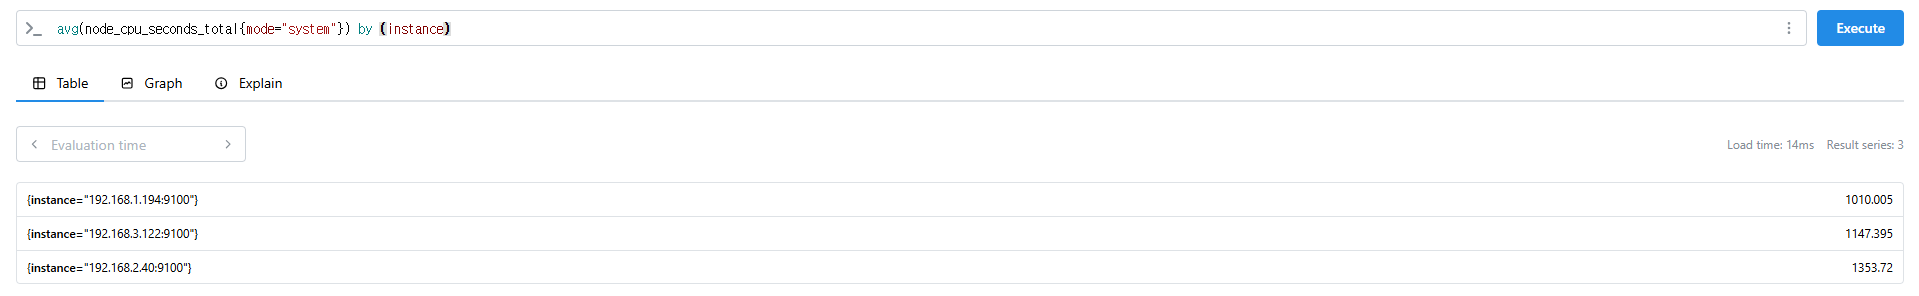
avg(node_cpu_seconds_total{mode="system"}) by (instance)
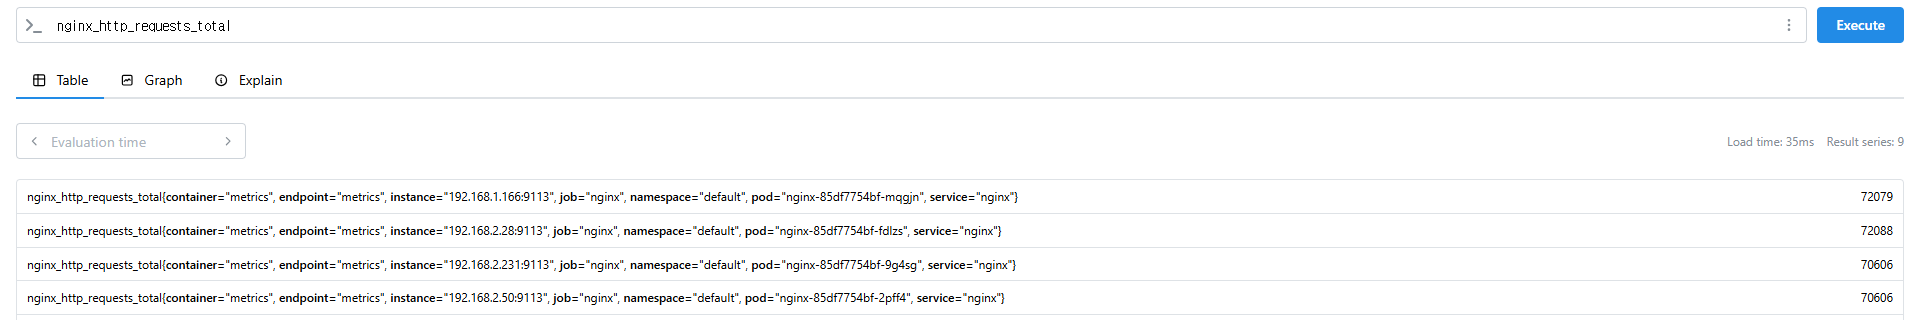
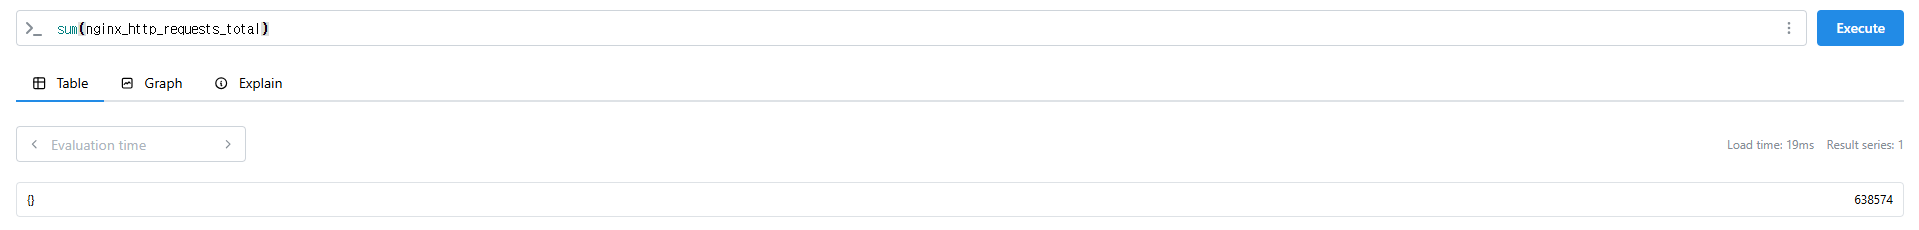
# nginx로 들어온 요청 개수
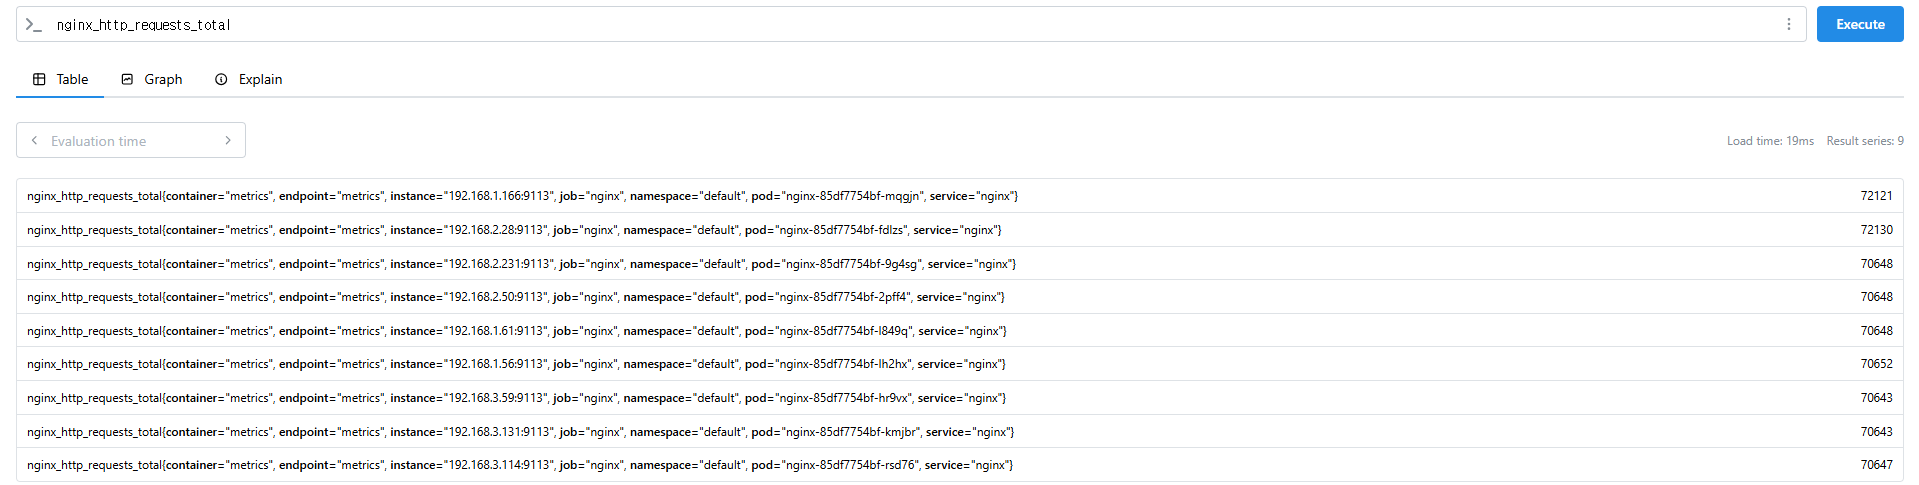
nginx_http_requests_total
sum(nginx_http_requests_total)
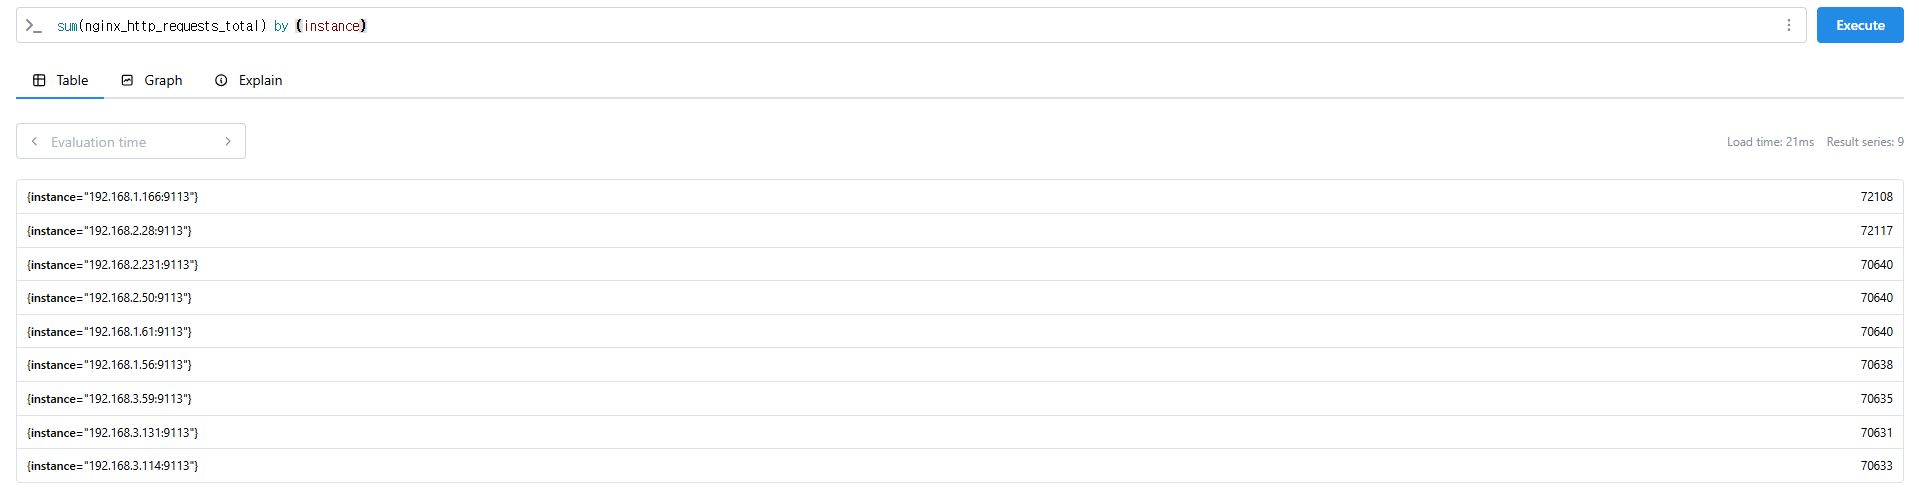
sum(nginx_http_requests_total) by (instance)
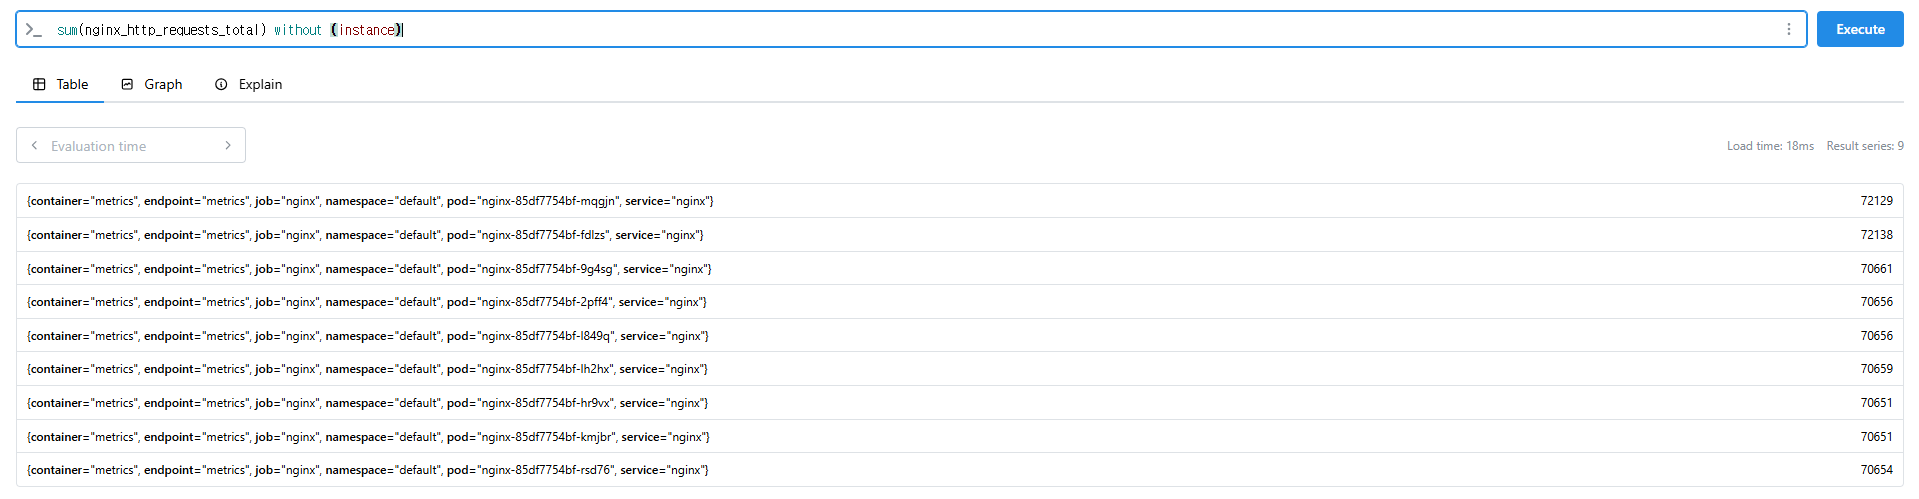
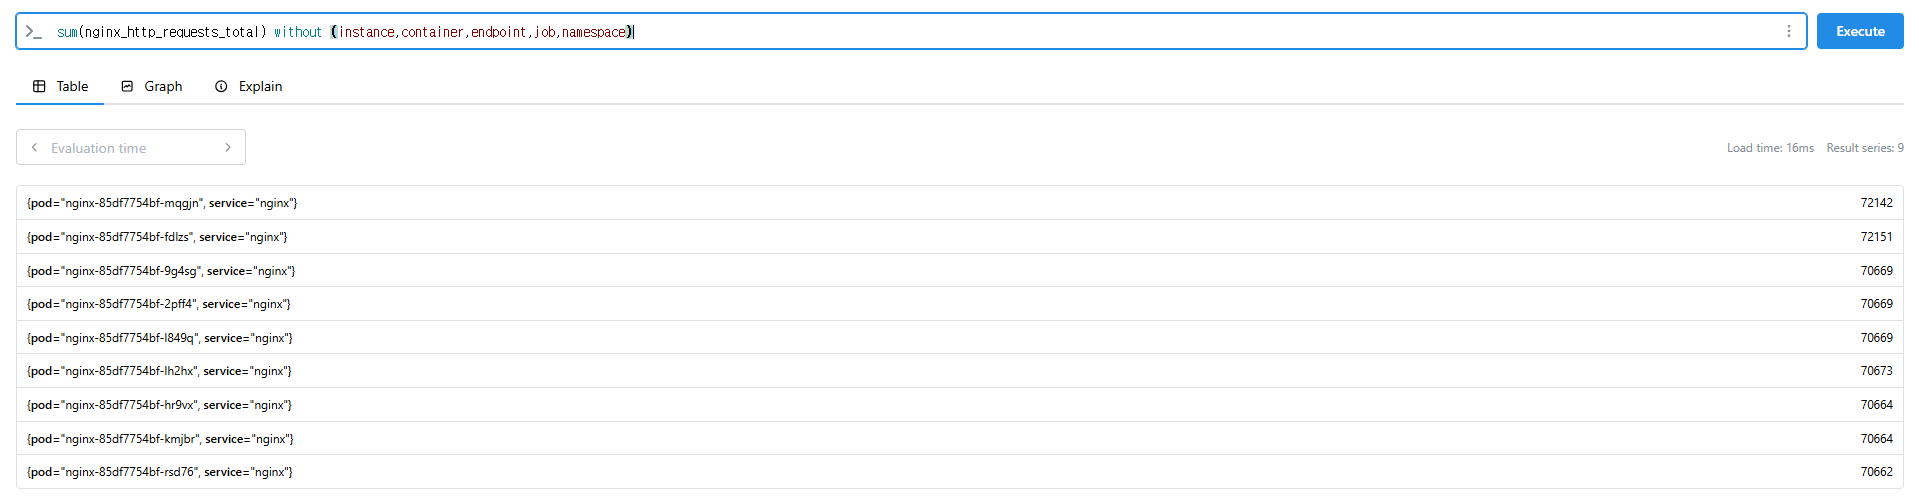
# 특정 내용 제외하고 출력 : without
nginx_http_requests_total
sum(nginx_http_requests_total) without (instance)
sum(nginx_http_requests_total) without (instance,container,endpoint,job,namespace)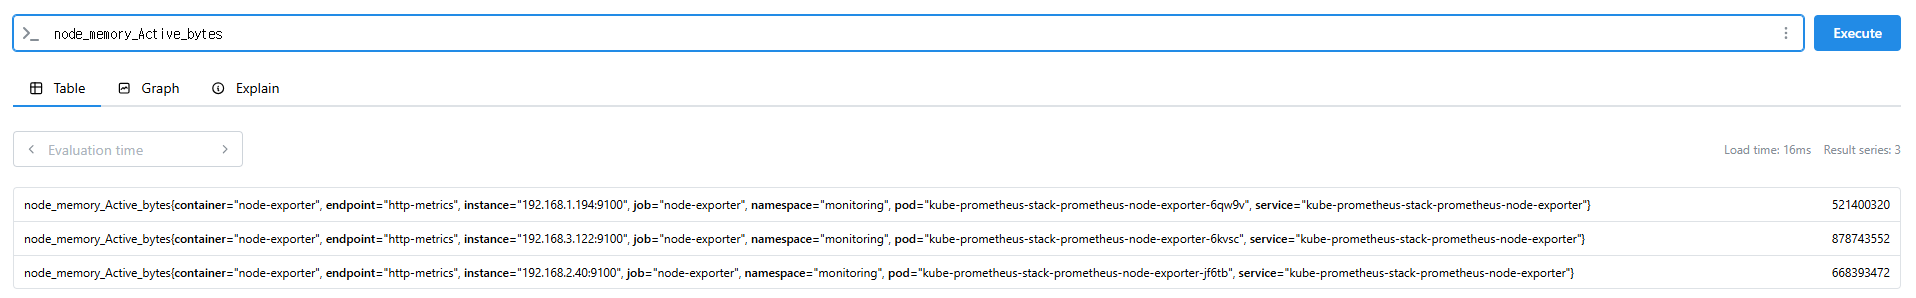
9.2.4 시간 벡터 연산 (Time Series Selectors)
Instant/Range vector selectors, Time Durations, Offset modifier, @ modifier
- 인스턴스 벡터 Instant Vector : 시점에 대한 메트릭 값만을 가지는 데이터 타입
- 레인지 벡터 Range Vector : 시간의 구간을 가지는 데이터 타입
- 시간 단위 : ms, s, m(주로 분 사용), h, d, w, y
# 시점 데이터
node_cpu_seconds_total
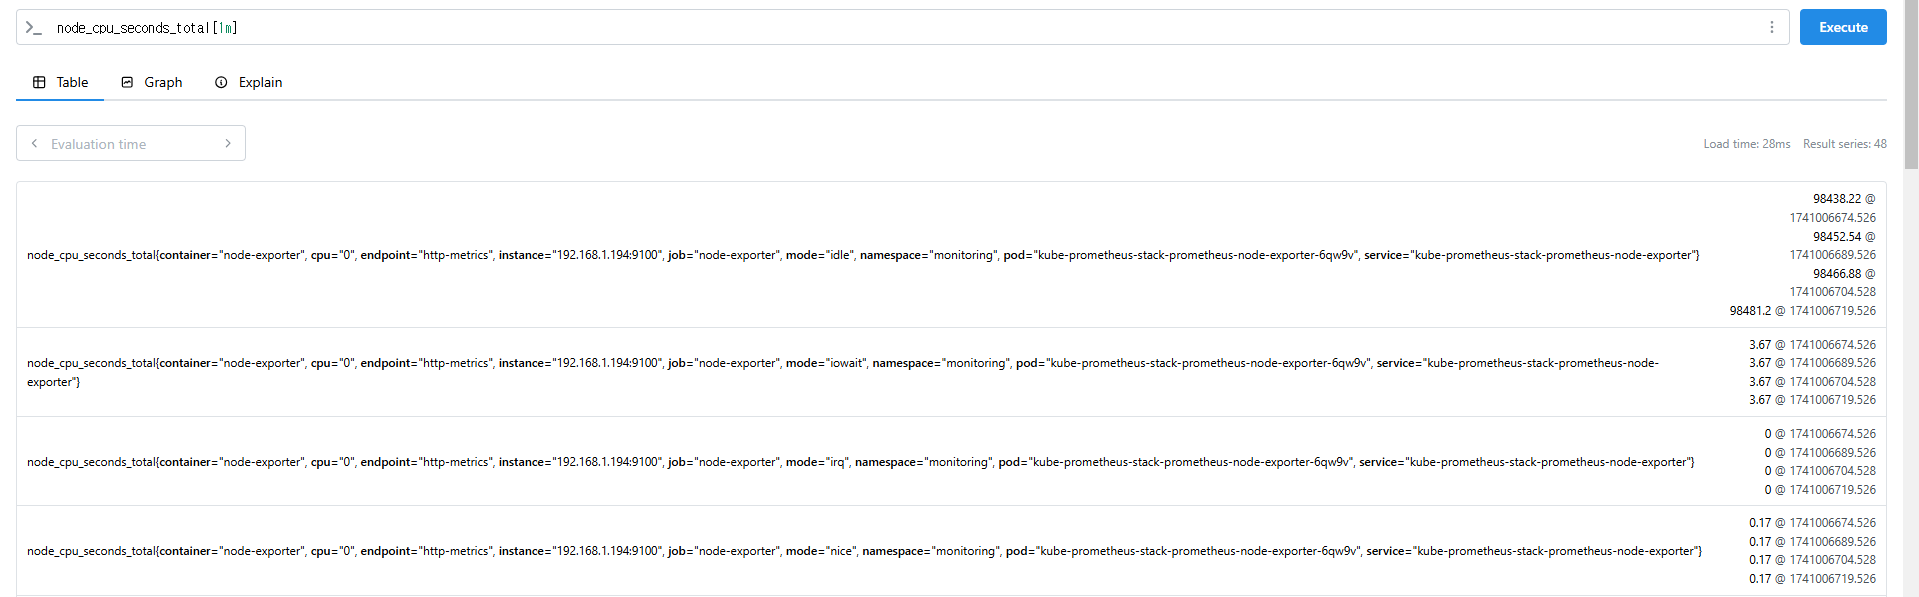
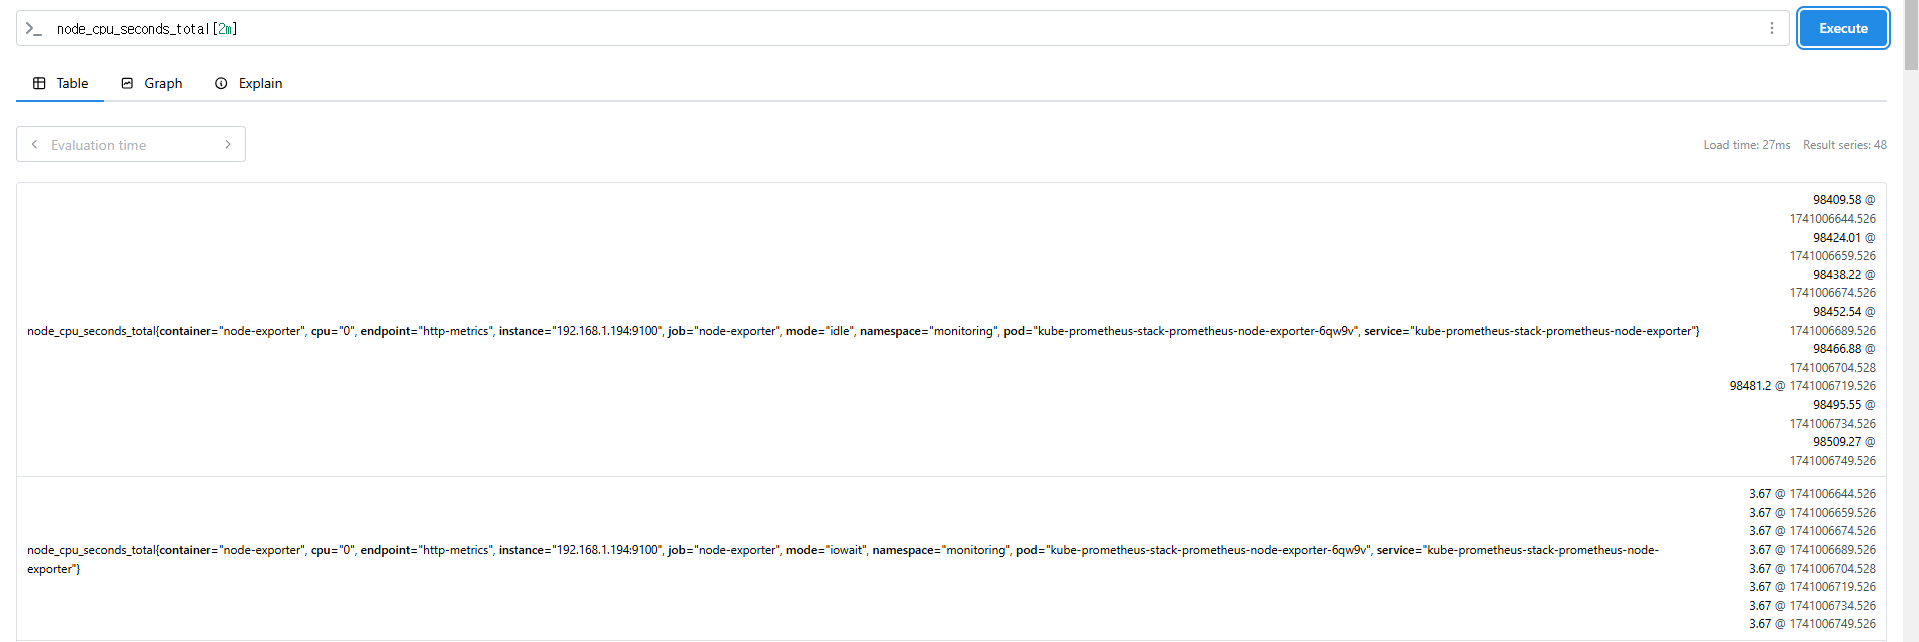
# 15초 마다 수집하니 아래는 지난 4회차/8회차의 값 출력
node_cpu_seconds_total[1m]
node_cpu_seconds_total[2m]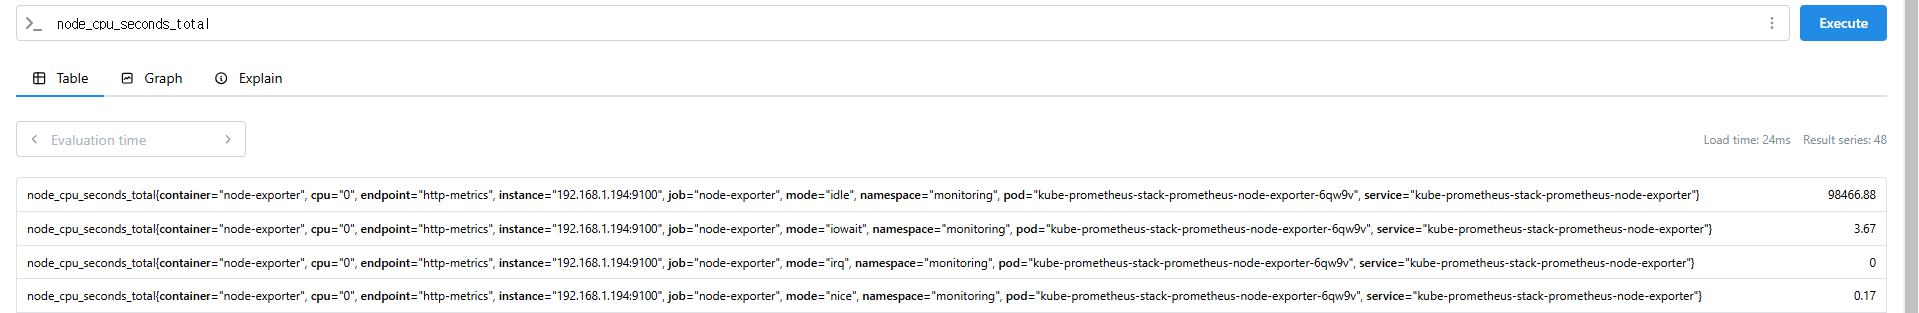
9.3 PromQL을 활용한 실제 예제
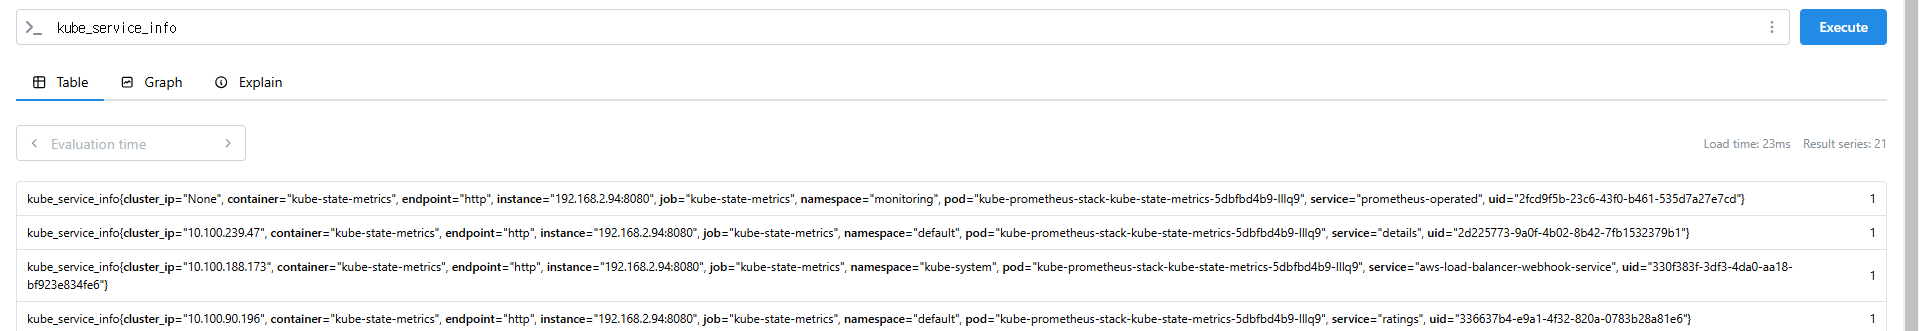
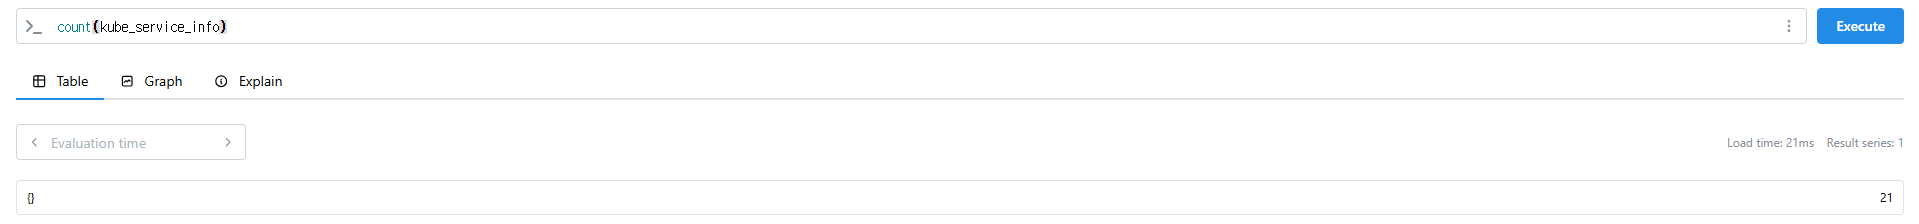
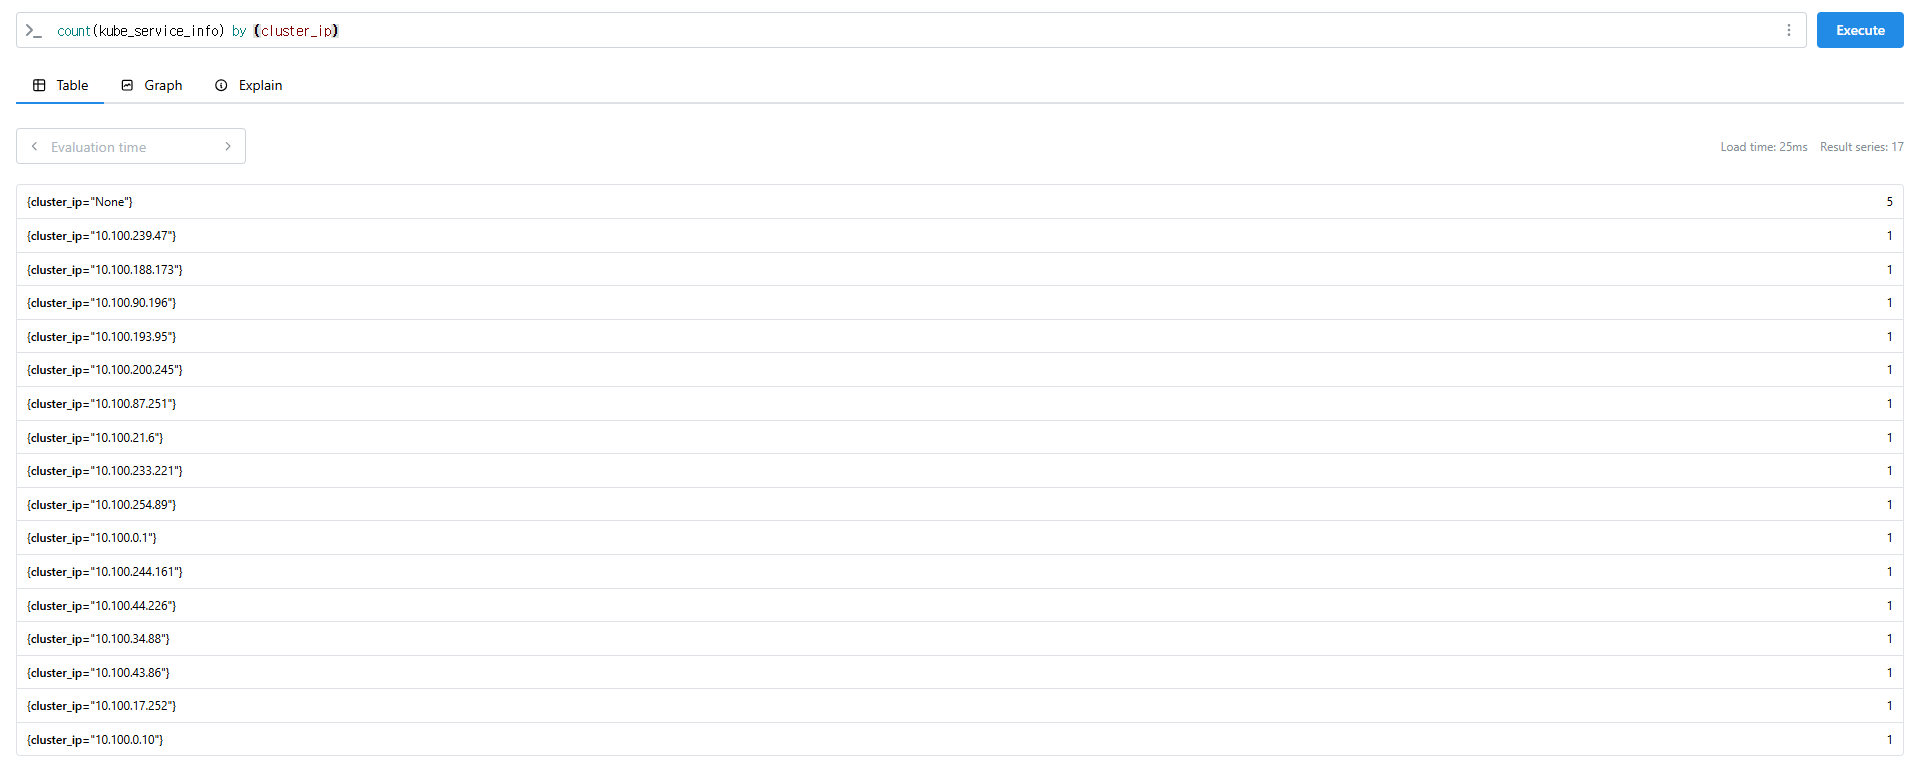
# 서비스 정보 >> 네임스페이스별 >> cluster_ip 별
kube_service_info
count(kube_service_info)
count(kube_service_info) by (namespace)
count(kube_service_info) by (cluster_ip)
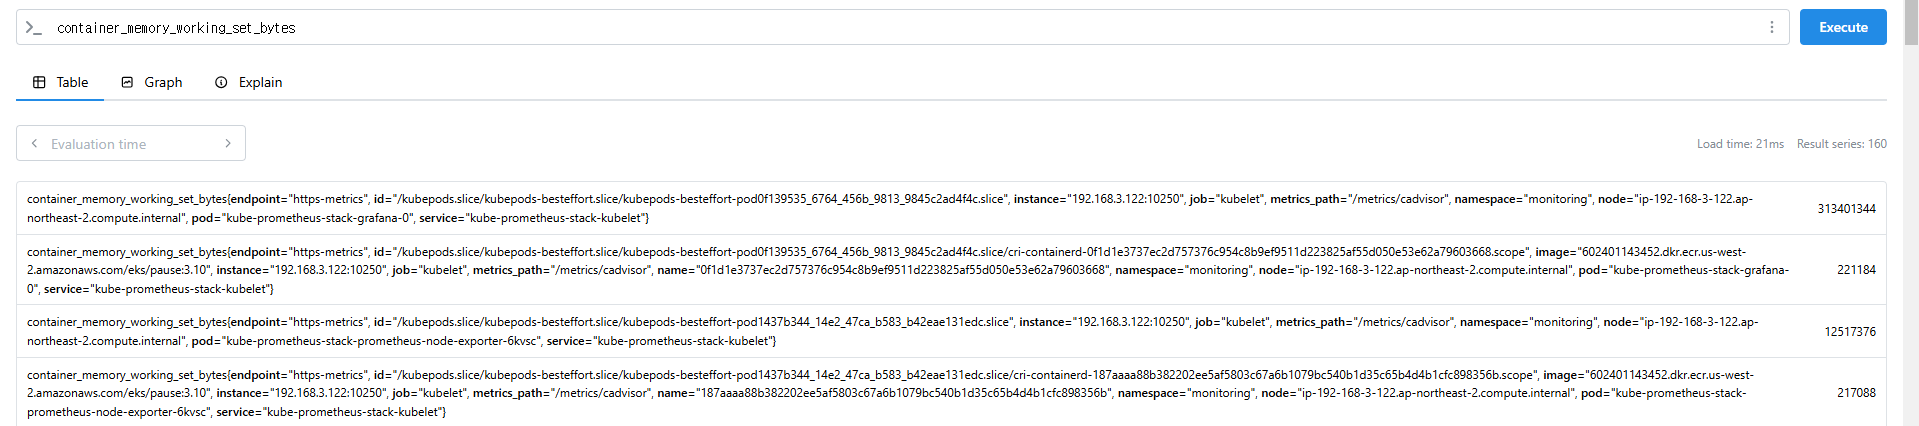
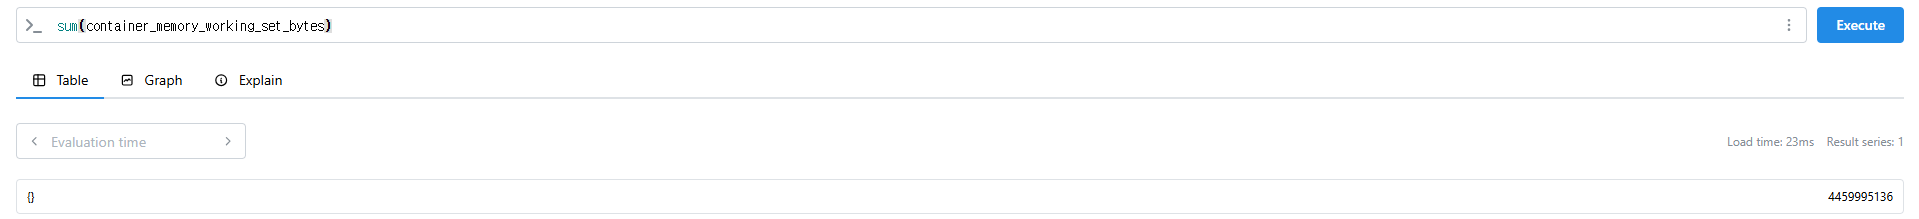
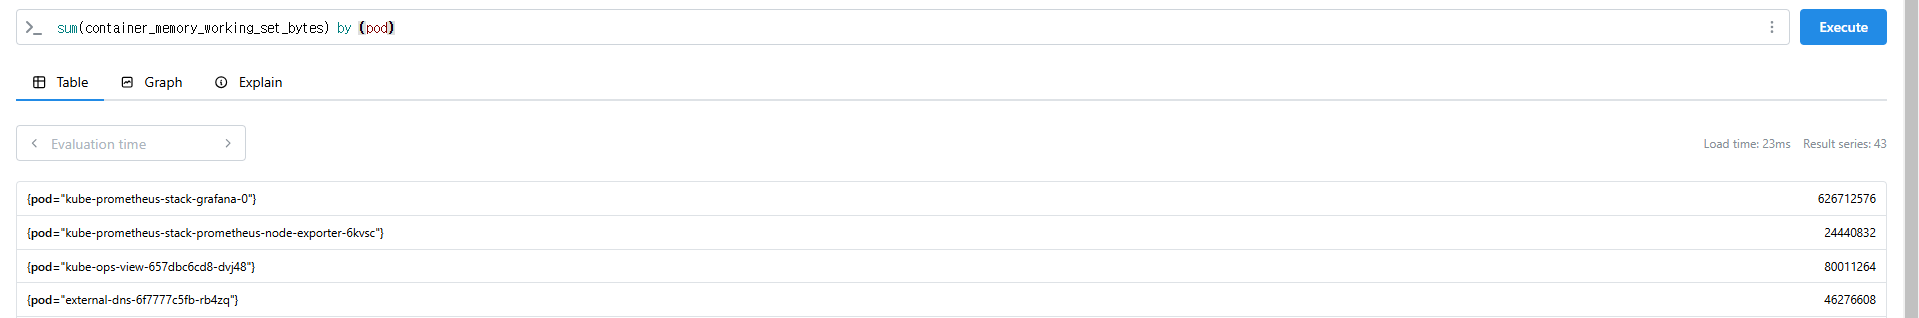
# 컨테이너가 사용 메모리 -> 파드별
container_memory_working_set_bytes
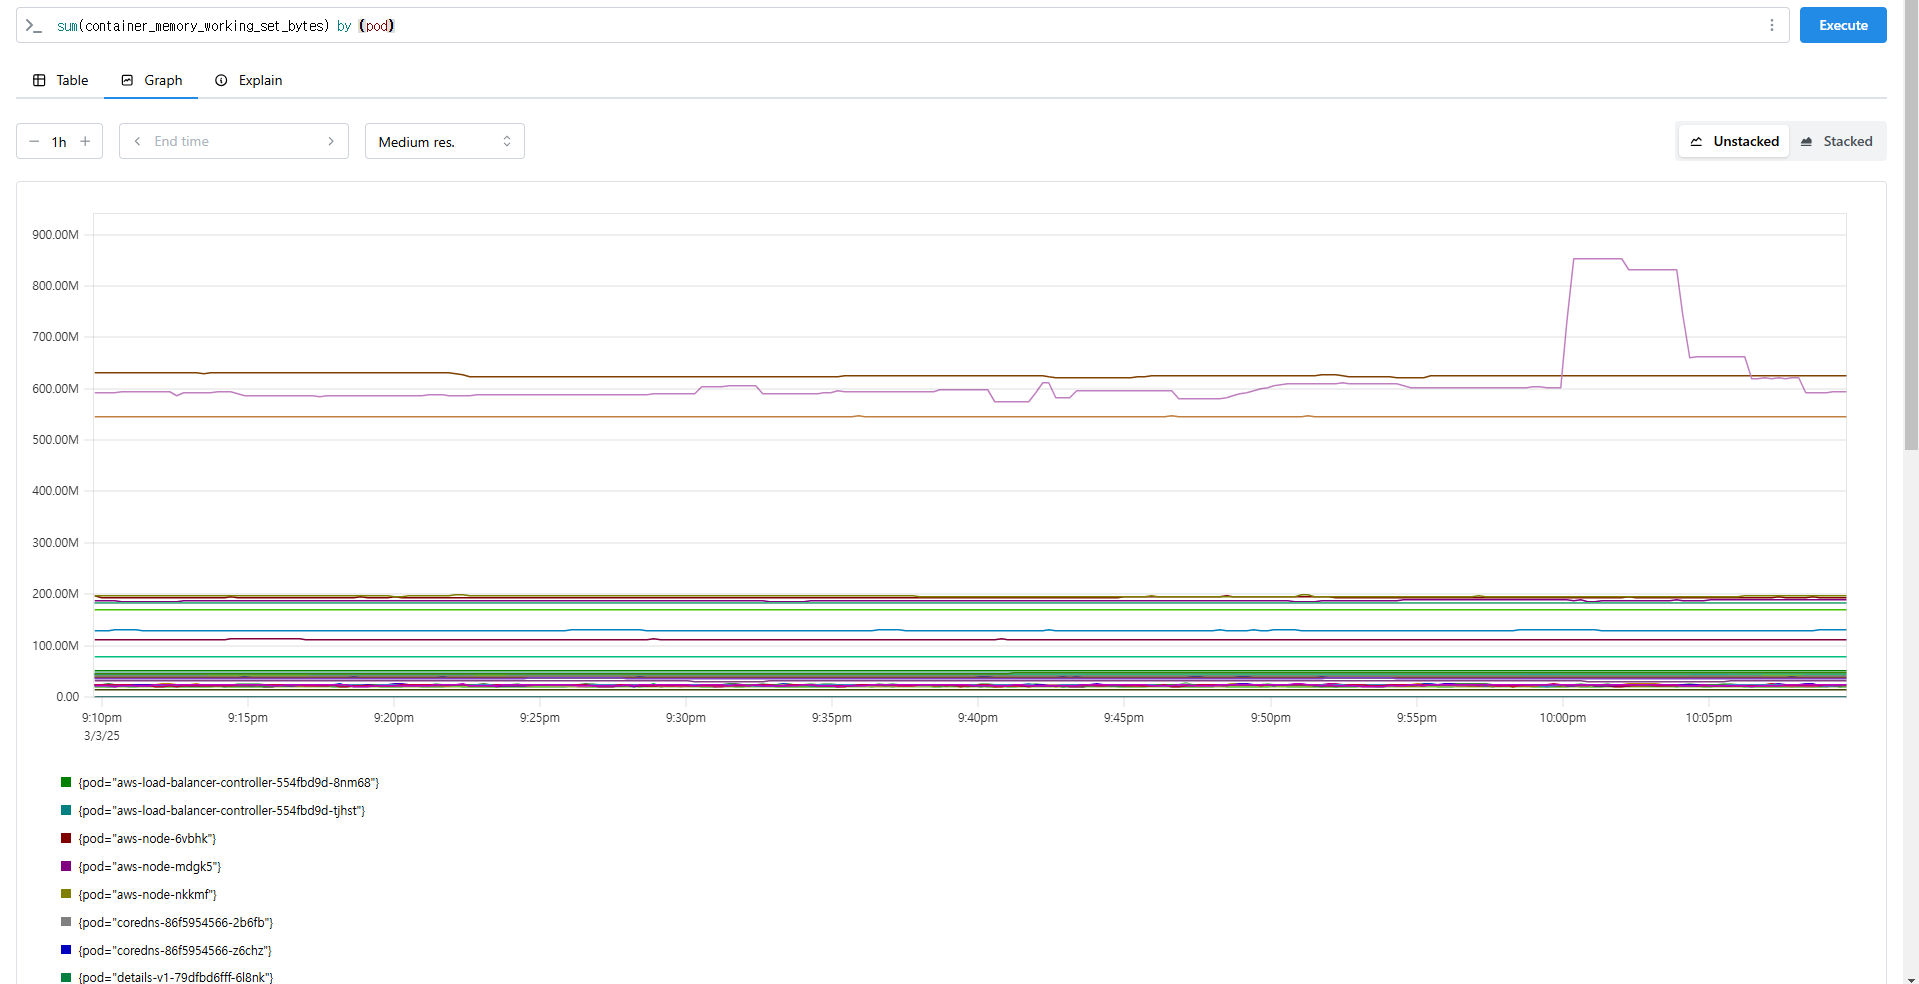
sum(container_memory_working_set_bytes)
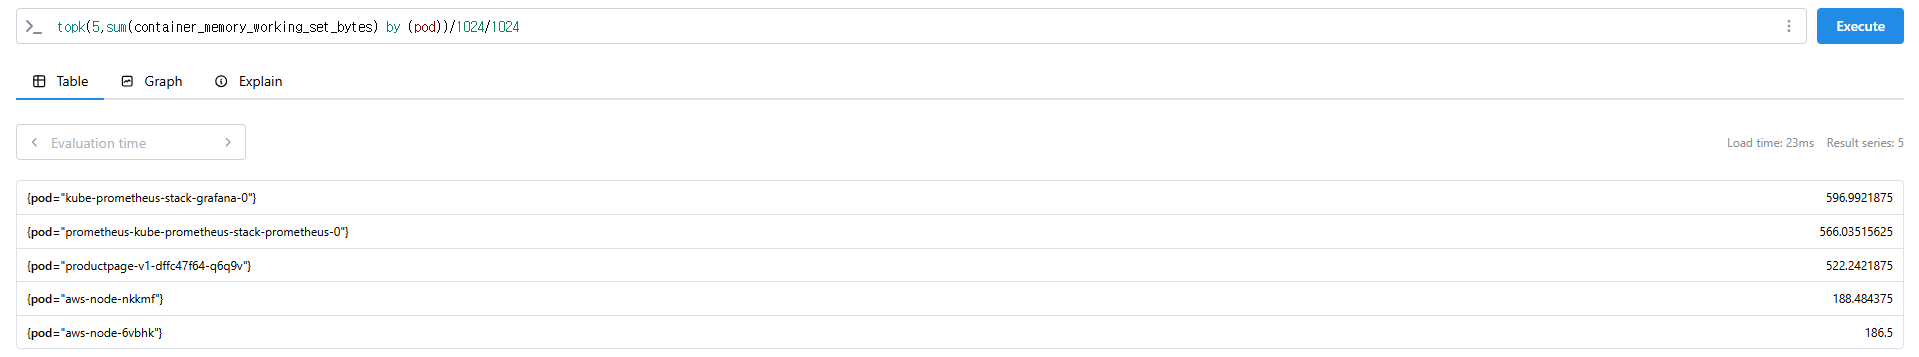
sum(container_memory_working_set_bytes) by (pod)
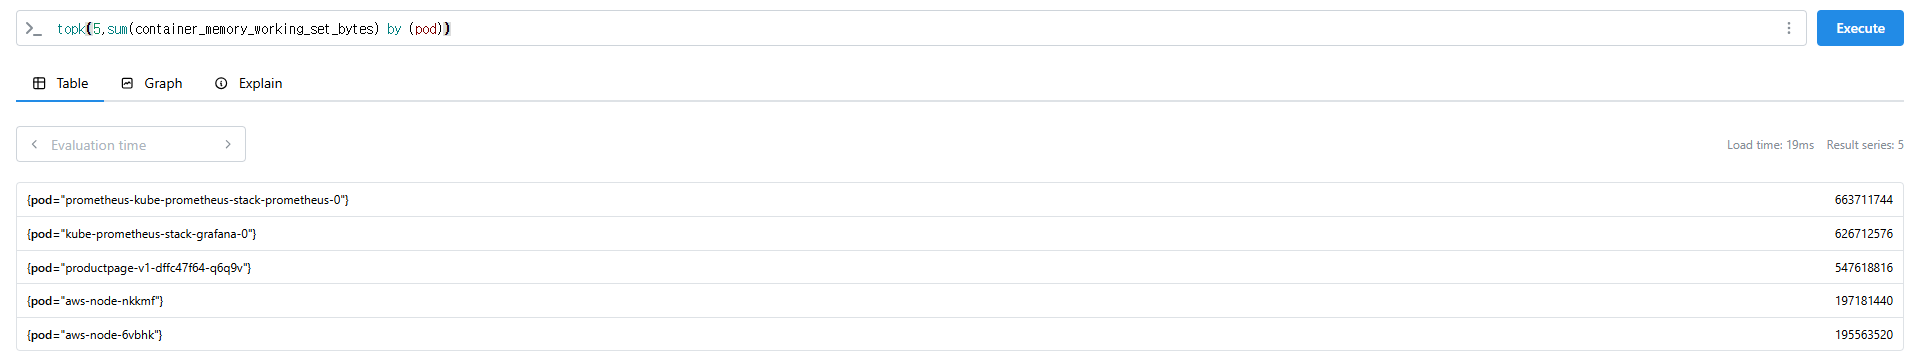
topk(5,sum(container_memory_working_set_bytes) by (pod))
topk(5,sum(container_memory_working_set_bytes) by (pod))/1024/1024