Buffer Cache Hit Ratio(버퍼캐시 히트율)
- 전체 읽는 블록중에서 얼마만큼 버퍼캐시에서 찾았는지 나타내는 비율
- 논리적 블록 읽기(logical reads) = 총읽은 블록 수 = db block gets + consistent gets
- database buffer cache 곧바로 찾아 읽은 블록수 = logical reads - physical reads
BCHR = (buffer cache 곧바로 찾아 읽은 블록수 / 총읽은 블록수) * 100
	 = ((logical reads - physical reads)/logical reads) * 100
     = (1- (physical reads / logical reads)) * 100
     = (1 - (physical reads / (db block gets + consistent gets))) * 100
set autotrace on explain
- SQL문 실제 수행하고 결과와 함께 실행계획 보여줌
set autotrace on explain
select * from hr.emp where employee_id = 100;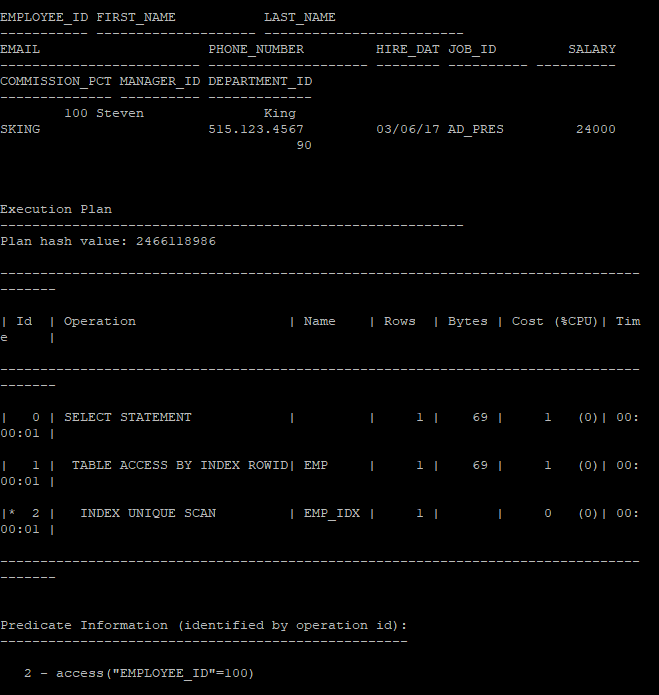
set autotrace on statistics
- SQL문 실제 수행하고 결과와 함께 실행통계 정보 출력
set autotrace on statistics
select * from hr.emp where employee_id = 100;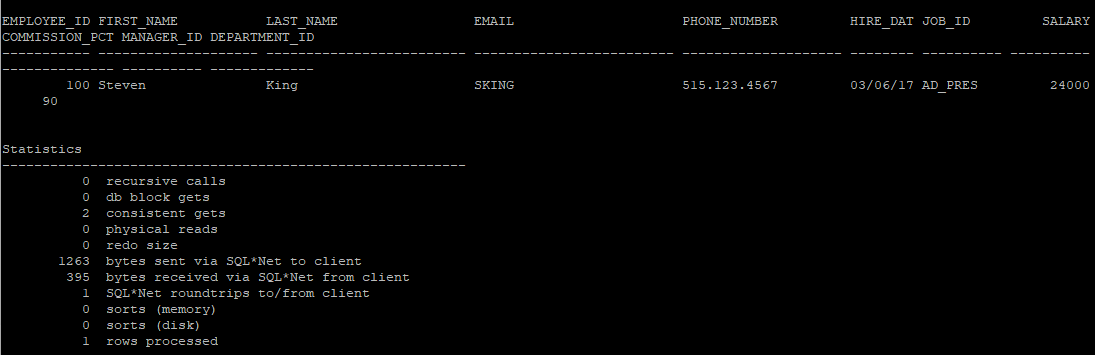
set autotrace traceonly
- SQL문 실제 수행하고 결과는 출력하지 않고 실행계획, 실행통계 정보 출력(execute 단계에서 끝남)
set autotrace traceonly
select * from hr.emp where employee_id = 100;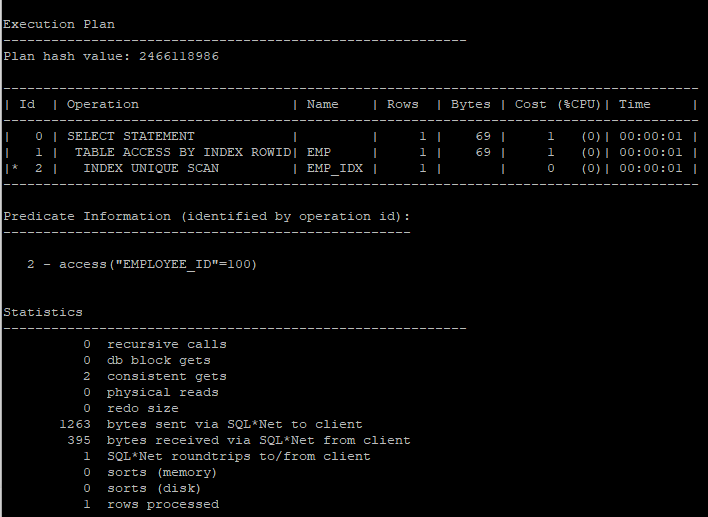
set autotrace traceonly explain
- SQL문 실제 수행하지 않고 실행계획 정보 출력 (parse 단계에서 끝남)
set autotrace traceonly explain
select * from hr.emp where employee_id = 100;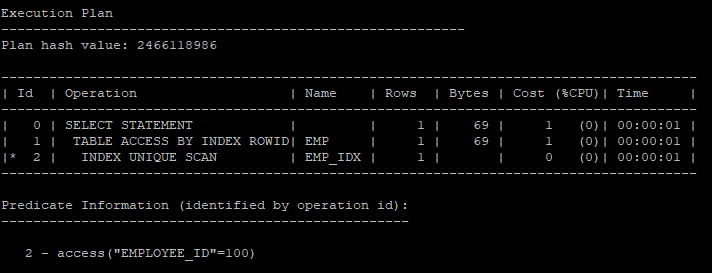
set autotrace off
set autotrace off
- 종료
v$sql_plan
- library cache에 있는 실행계획을 보는 뷰
<<sys session>>
select s.prev_sql_id, s.prev_child_number, v.sql_text
from v$session s, v$sql v
where s.prev_sql_id = v.sql_id
and s.prev_child_number = v.child_number
and s.username = 'HR';
<<hr session>>
select * from hr.emp where employee_id = 100;<<sys session>>
select s.prev_sql_id, s.prev_child_number, v.sql_text
from v$session s, v$sql v
where s.prev_sql_id = v.sql_id
and s.prev_child_number = v.child_number
and s.username = 'HR';
- v$sql_plan으로 보면 실행계획 보기가 까다롭다.
select * from v$sql_plan where sql_id = '5g6ygund8wa94';- 패키지를 이용해 v$sql_plan의 내용을 보기 편하게 보여줌
select * from table(dbms_xplan.display_cursor('5g6ygund8wa94',0,'typical'));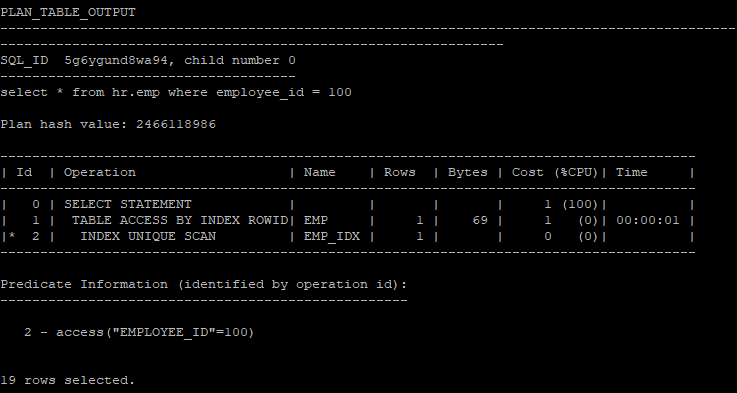
- 바로 직전에 수행한 sql쿼리문의 대한 실행계획 확인
- 단 한번밖에 확인 못한다.
select * from hr.emp where employee_id = 110;

select * from table(dbms_xplan.display_cursor);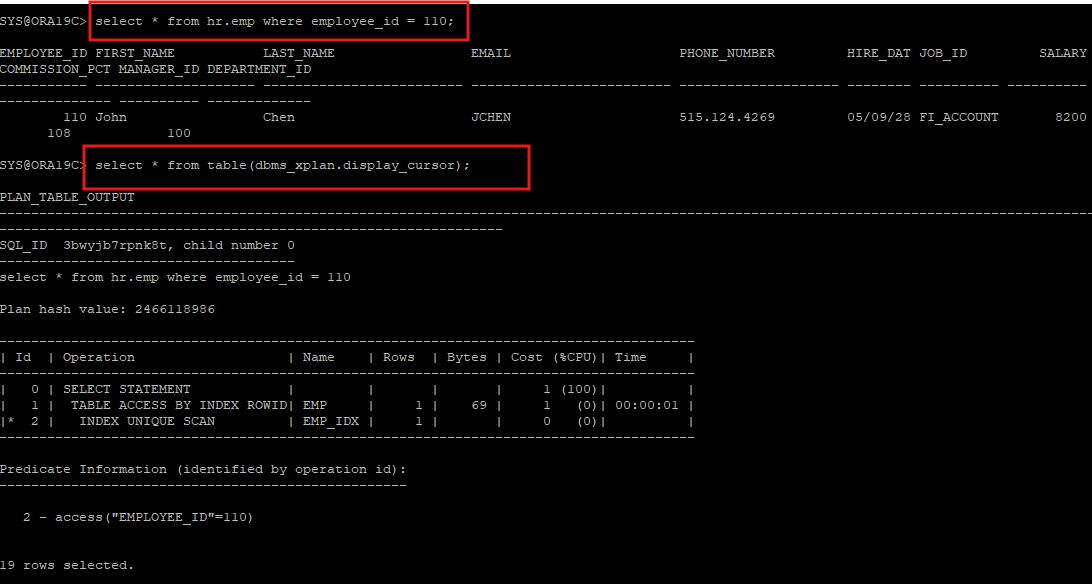
<<hr session>>
- 일반유저들이 dbms_xplan.display_cursor를 사용하려면 권한이 필요하다.
select * from hr.emp where employee_id = 110;

select * from table(dbms_xplan.display_cursor);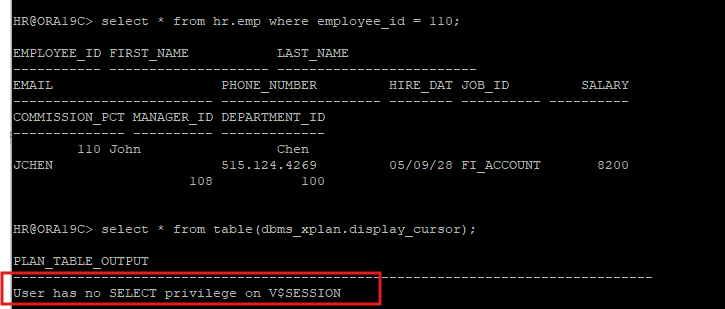
<<sys session>>
- sys 계정에서 권한을 부여해야함.
grant select on v_$session to hr;
grant select on v_$sql to hr;
grant select on v_$sql_plan to hr;
grant select on v_$sql_plan_statistics to hr;
grant select on v_$sql_plan_statistics_all to hr;
<<hr session>>
- hint랑 parameter를 사용해야 각 operation 별 통계정보를 알 수 있다.
select * from hr.emp where employee_id = 110;

select * from table(dbms_xplan.display_cursor(null,null,'allstats last'));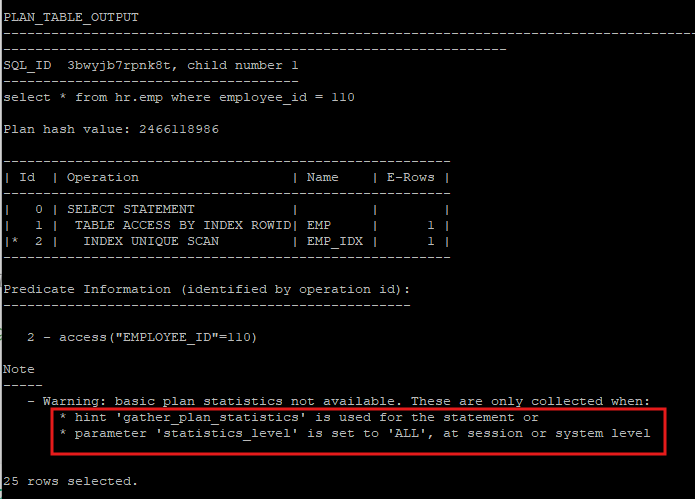
- warning 에서 나온 hint를 사용해서 다시 조회해본다
- buffers(logical i/o), reads(physical i/o)에 나온 i/o 수는 누적으로 생각해야한다.
select /*+ gather_plan_statistics */ * from hr.emp where employee_id = 110;

select * from table(dbms_xplan.display_cursor(null,null,'allstats last'));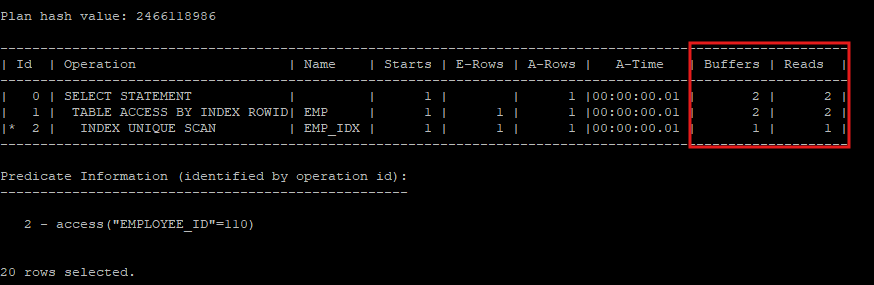
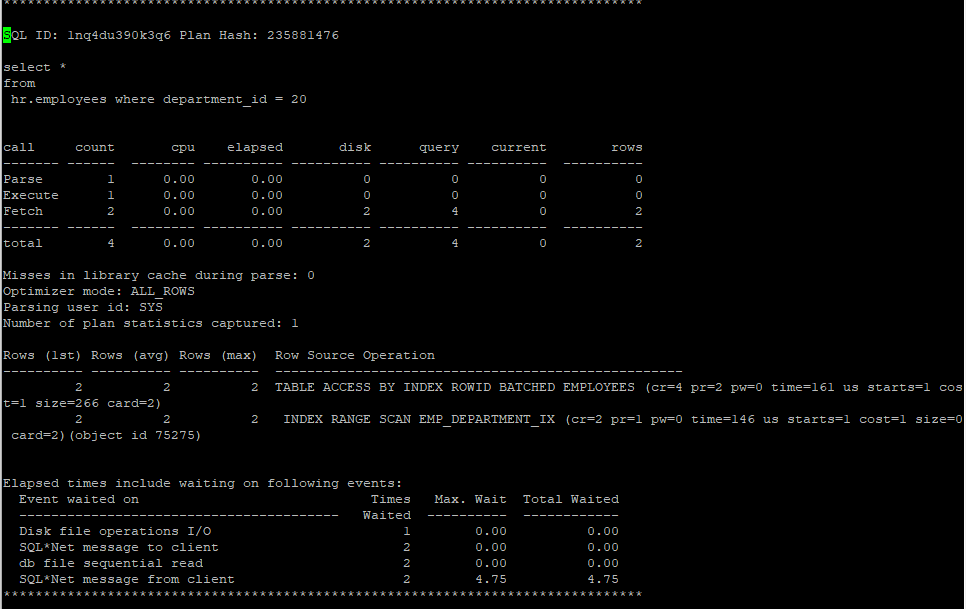
- 20번 부서인 사원은 총 2명이다.
root, branch, leaf block은 크기가 작아 한 블록안에 다 들어있다.
2개의 row를 access 하기 위해 원래는 leaf block은 3번을 i/o를 해야하지만 내부적으로 buffer pinning이 돌아가기 때문에 2번 이후부터는 latch를 잡지 않고 바로 해당 hash value의 값으로 조회가 가능해져 i/o는 2번으로 멈췄다.
전체 buffer는 2번의 leaf block i/0 + data block의 2번 i/o를 하였기 때문에 4번이다.
select /*+ gather_plan_statistics */ * from hr.employees where department_id = 20;

select * from table(dbms_xplan.display_cursor(null,null,'allstats last'));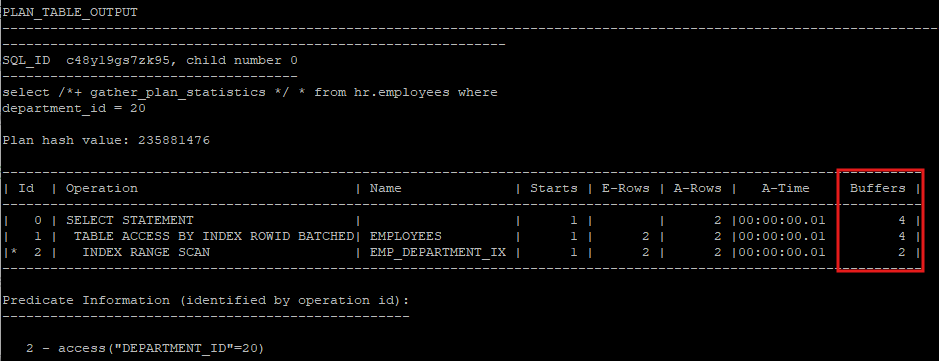
select /*+ gather_plan_statistics index(e EMP_DEPARTMENT_IX) */ * from hr.employees e where department_id = 50;

select * from table(dbms_xplan.display_cursor(null,null,'allstats last'));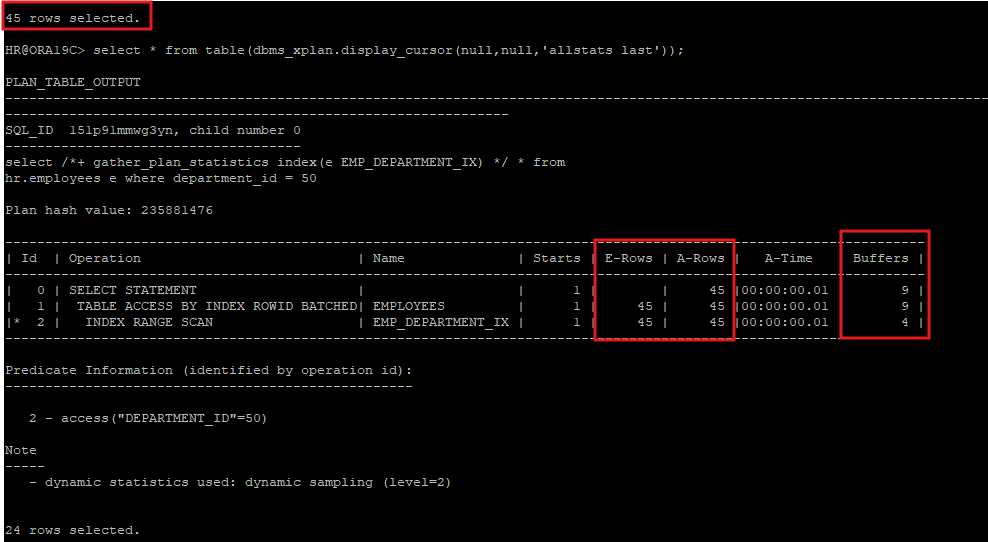
Id : 각 Operation번호
Operation : 실행되는 JOB
Name : Operation이 수행되는 테이블, 인덱스
Starts : 각 Operation을 반복 수행한 건수
E-Rows : 각 Operation을 수행했을때 return 건수(예상치)
A-Rows : 각 Operation을 수행했을때 return 건수(실제)
A-Time : 실제 실행시간 누적치
Buffers : 각 Operation의 logical block의 수 (논리적 블록 수, 전체 읽은 블록 수)
Reads : 각 Operation의 physical block의 수 (디스크에서 읽은 블록 수)
Write : 각 Operation의 disk에 write한 block의 수
- hr session
select /*+ gather_plan_statistics */ * from hr.emp where employee_id = 100;select * from table(dbms_xplan.display_cursor(null,null,'allstats last'));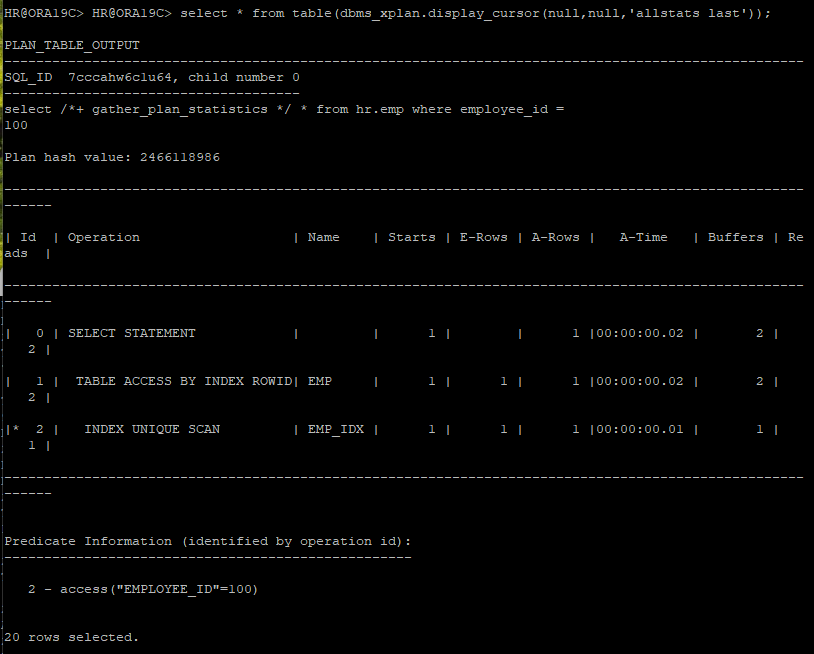
update /*+ gather_plan_statistics */ hr.emp set salary = salary * 1.1 where employee_id = 100;
undo에 대한 행위에 대해 i/o가 발생하면서 select보다 buffers의 수가 늘어난 것을 확인select * from table(dbms_xplan.display_cursor(null,null,'allstats last'));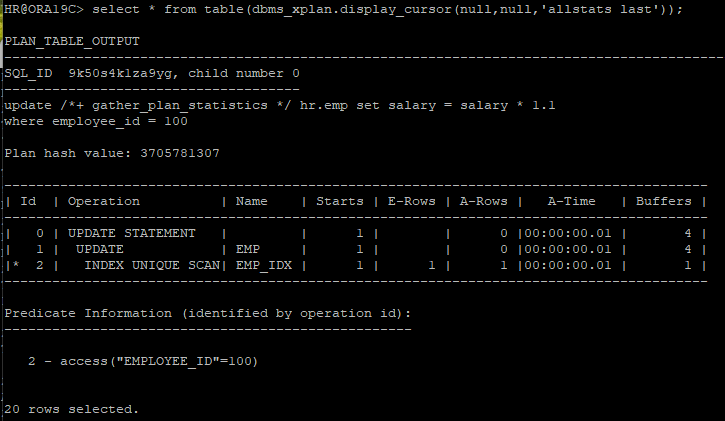
rollback;
delete /*+ gather_plan_statistics */ from hr.emp where employee_id = 100;
undo에 대한 행위 및 index에 대한 정보까지 삭제해야하므로 select, update보다 늘어난 것을 확인select * from table(dbms_xplan.display_cursor(null,null,'allstats last'));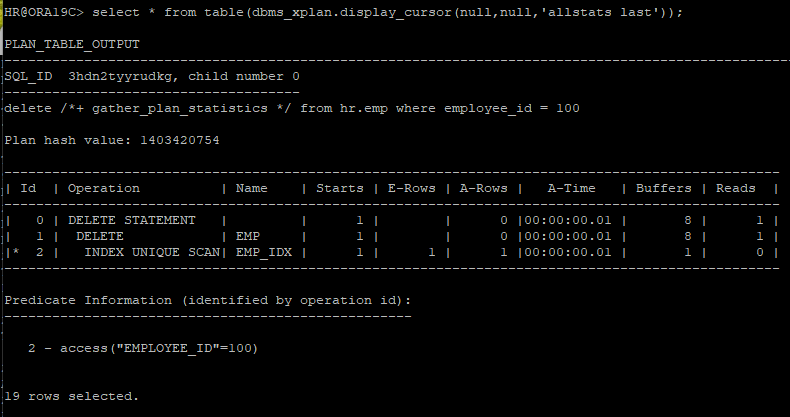
rollback;
buffer pinning
- 버퍼를 읽고 나서 버퍼 pin을 해제하지 않고 데이터베이스 CALL이 진행하는 동안 유지하는 기능
- 같은 블럭(버퍼)를 반복적으로 읽어갈때 효과적인 기능
- latch 점유 시간을 줄일 수 있고 블럭 i/o를 줄일 수 있는 기능
- index range scan을 수행할 때 leaf block을 다시 access하는 i/o를 줄일 수 있고 index에서 찾은 rowid를 이용해 실제 블럭을 access할 때 같은 블럭을 다시 access하면 i/o를 줄일 수 있음
SQL TRACE
- SQL문 수행에 대해 trace file을 생성
- instance level(인스턴스에 접속한 모든 사용자), session level(일반적으로 사용) 수행할 수 있음
- 구문분석, 실행, FETCH 단계에서 어느 부분에서 시간이 오래 걸리는지 통계정보를 제공
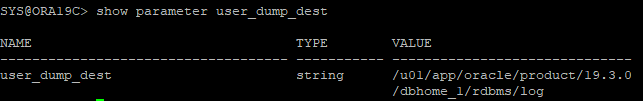
show parameter user_dump_dest: 예전에는 이 위치에 생성됐으나 지금은 사용하지않음select name, value from v$diag_info;: 현재는 이 쿼리로 위치를 확인하고 사용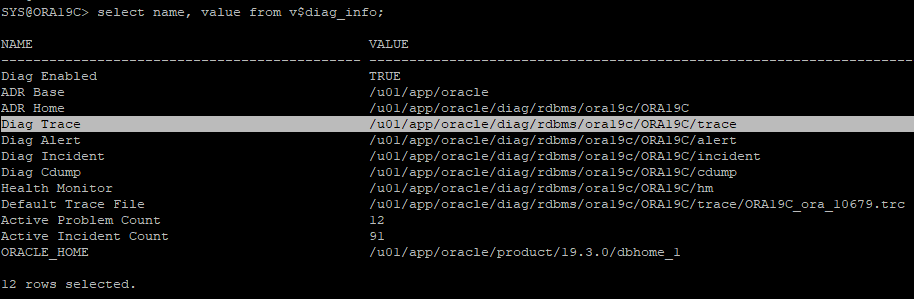
- 해당 위치로 이동 후 확인
cd /u01/app/oracle/diag/rdbms/ora19c/ORA19C/trace,ls
alter session set tracefile_identifier = 'test';- trace file 활성화
alter session set sql_trace = true; - 쿼리 수행 후 trace file 잘 만들어졌는지 확인
select * from hr.employees where employee_id = 100; - trace file 바활성화
alter session set sql_trace = false; - 해당 위치로 이동 후 확인
ls *test*
- trm은 사용안하고 trc파일을 사용하는데 그냥 보면 읽기 어려우므로 보기 편하게 만드는 작업 수행후 확인
tkprof ORA19C_ora_10679_test.trc ex01.txt
SQL ID: 2sgjc8u8ha0m4 Plan Hash: 1833546154

select *
from
 hr.employees where employee_id = 100


call     count       cpu    elapsed       disk      query    current        rows
------- ------  -------- ---------- ---------- ---------- ----------  ----------
Parse        1      0.00       0.00          0          0          0           0
Execute      1      0.00       0.00          0          0          0           0
Fetch        2      0.00       0.02          8          2          0           1
------- ------  -------- ---------- ---------- ---------- ----------  ----------
total        4      0.00       0.02          8          2          0           1

Misses in library cache during parse: 1
Optimizer mode: ALL_ROWS
Parsing user id: SYS
Number of plan statistics captured: 1

Rows (1st) Rows (avg) Rows (max)  Row Source Operation
---------- ---------- ----------  ---------------------------------------------------
         1          1          1  TABLE ACCESS BY INDEX ROWID EMPLOYEES (cr=2 pr=8 pw=0 time=25978 us starts=1 cost=1 size=69 card=1)
         1          1          1   INDEX UNIQUE SCAN EMP_EMP_ID_PK (cr=1 pr=8 pw=0 time=25969 us starts=1 cost=0 size=0 card=1)(object id 72979)
# SELECT : Fetch 라인에서 disk, query 본다
# DML : Excute 라인에서 disk, current 본다
-Parse : SQL문을 파싱하고 실행계획을 생성하는데 대한 통계 정보
-Execute : DML문에 대한 통계 정보
-Fetch : SELECT문에 대한 통계 정보
- count : 실행횟수
- cpu : 처리에 소요되는 시간(초)
- elapsed : 처리에 소요되는 총 경과시간(초)
- disk : 물리적 블록 읽은 수
- query : 일관성 있는 (consistent) 읽기를 위한 논리적 블록 읽은 수(SELECT)
- current : 현재 모드에서 논리적 블록 읽은 수(DML)
- rows : 처리한 행의 수
- cr : consistent read, 논리적 블록 읽은 수
- pr : physical read, 물리적 블록 읽은 수
- pw : physical write, write 블록의 수
- time : 수행단계에서 소요된 시간(microsecond)- 논리적 블록 읽기(logical reads) = 총 읽은 블록 수 = query + current
- BCHR = (1 - (disk / (query + current))) * 100
wait event까지 같이 trace file 생성
-
trace file 검색 이름 설정
alter session set tracefile_identifier = 'hr2'; -
Oracle 데이터베이스에서 SQL 성능 분석을 위해 10046 이벤트를 사용해 추적(trace)을 활성화하는 명령어
alter session set events '10046 trace name context forever, level 8'; -
sql 쿼리문 수행
select * from hr.employees where department_id = 20; -
추적 종료
alter session set events '10046 trace name context off'; -
db file sequential read 이벤트는 single block i/o를 physical i/o로 하게 될때 발생되는 이벤트 이다.
- full table scan을 할때는 주로
db file scattered read이벤트가 발생하는데 가끔db file sequential read이벤트가 발생할 때도 있다. 이는 physical i/o를 multi block i/o로 진행할때 어느 블록 까지 i/o를 하는지는 HWM를 기준으로 한다. 그 HWM는 segment의 header블록이 가지고 있다. 그 header 블록을 buffer에 올릴때는 single block i/o가 발생되기 때문에db file sequential read가 발생한다.
- 대용량 데이터 입력
create table hr.ind_random as select * from all_objects order by dbms_random.value;alter system flush buffer_cache;
alter session set tracefile_identifier = 'hr4';
alter session set events '10046 trace name context forever, level 8';
select count(*) from hr.ind_random where owner='SYS';
alter session set events '10046 trace name context off';SQL ID: 4whh8ak6wd1jc Plan Hash: 3056395443
select count(*)
from
hr.ind_random where owner='SYS'
call count cpu elapsed disk query current rows
------- ------ -------- ---------- ---------- ---------- ---------- ----------
Parse 1 0.00 0.00 0 0 1 0
Execute 1 0.00 0.00 0 0 0 0
Fetch 2 0.00 0.00 1396 1397 0 1
------- ------ -------- ---------- ---------- ---------- ---------- ----------
total 4 0.00 0.00 1396 1397 1 1
Misses in library cache during parse: 1
Optimizer mode: ALL_ROWS
Parsing user id: SYS
Number of plan statistics captured: 1
Rows (1st) Rows (avg) Rows (max) Row Source Operation
---------- ---------- ---------- ---------------------------------------------------
1 1 1 SORT AGGREGATE (cr=1397 pr=1396 pw=0 time=2427 us starts=1)
52254 52254 52254 TABLE ACCESS FULL IND_RANDOM (cr=1397 pr=1396 pw=0 time=4648 us starts=1 cost=266 size=12355 card=2471)
Elapsed times include waiting on following events:
Event waited on Times Max. Wait Total Waited
---------------------------------------- Waited ---------- ------------
Disk file operations I/O 1 0.00 0.00
SQL*Net message to client 2 0.00 0.00
db file sequential read 1 0.00 0.00
direct path read 50 0.00 0.00
PGA memory operation 1 0.00 0.00
SQL*Net message from client 1 0.00 0.00- 오라클이 자동으로 direct path read 방식으로 변경해서 select 한걸 알 수 있다.
- 이벤트를 주어 full table scan을 의도적으로 발생
alter system flush buffer_cache;
alter session set events '10949 trace name context forever, level 1';
alter session set tracefile_identifier = 'hr5';
alter session set events '10046 trace name context forever, level 8';
select count(*) from hr.ind_random where owner='SYS';
alter session set events '10046 trace name context off';
alter session set events '10949 trace name context off';
SQL ID: 4whh8ak6wd1jc Plan Hash: 3056395443
select count(*)
from
hr.ind_random where owner='SYS'
call count cpu elapsed disk query current rows
------- ------ -------- ---------- ---------- ---------- ---------- ----------
Parse 1 0.00 0.00 0 0 0 0
Execute 1 0.00 0.00 0 0 0 0
Fetch 2 0.00 0.01 1396 1399 0 1
------- ------ -------- ---------- ---------- ---------- ---------- ----------
total 4 0.00 0.01 1396 1399 0 1
Misses in library cache during parse: 0
Optimizer mode: ALL_ROWS
Parsing user id: SYS
Number of plan statistics captured: 1
Rows (1st) Rows (avg) Rows (max) Row Source Operation
---------- ---------- ---------- ---------------------------------------------------
1 1 1 SORT AGGREGATE (cr=1399 pr=1396 pw=0 time=10289 us starts=1)
52254 52254 52254 TABLE ACCESS FULL IND_RANDOM (cr=1399 pr=1396 pw=0 time=2997 us starts=1 cost=266 size=12355 card=2471)
Elapsed times include waiting on following events:
Event waited on Times Max. Wait Total Waited
---------------------------------------- Waited ---------- ------------
Disk file operations I/O 1 0.00 0.00
SQL*Net message to client 2 0.00 0.00
db file sequential read 1 0.00 0.00
db file scattered read 47 0.00 0.00
SQL*Net message from client 2 0.00 0.00Serial direct read
-
테이블이나 인덱스에 대한 full table scan 발생할 경우 multi block i/o가 발생한다.
이때 데이터베이스 버퍼 캐시 영역의 부담을 줄 수 있다. -
데이터 파일의 블록을 메모리로 읽어 오려면
cache buffers lru chain latch획득한 후 프리 공간을 스캔하고 프리공간에 올리는 작업을 수행한다. -
_small_table_threshold설정되어 있는 블록의 수 보다 많은 블록을 가지고 있는 테이블을 full table scan이 발생하면 direct path read 방식으로 디스크에 블록들을 PGA영역으로 바로 읽어 오는 기능이 11g 부터 지원이 된다. -
원래는 direct path read 방식은 병렬 처리시에 발생하는 기능이지만, 11g부터 serial direct read 방식으로 구현이 된다.
- Direct Read는 Oracle이 데이터를 버퍼 캐시(buffer cache)에 로드하지 않고 디스크에서 직접 읽는 것을 의미합니다.
- Oracle은 데이터를 읽을 때 일반적으로 데이터를 먼저 버퍼 캐시에 로드한 후 SQL 문이 이를 참조하게 되는데, Direct Read 방식은 버퍼 캐시를 거치지 않고 디스크에서 PGA(Program Global Area)로 데이터를 바로 읽어들입니다.
select a.ksppinm as parameter,b.ksppstvl as session_value, c.ksppstvl as instance_value
from x$ksppi a, x$ksppcv b, x$ksppsv c
where a.indx = b.indx
and a.indx = c.indx
and a.ksppinm in ('_small_table_threshold','_serial_direct_read');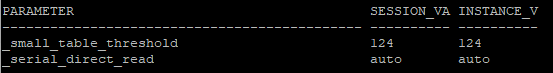
- direct path read 방식을 안하겠다는 이벤트
alter session set events '10949 trace name context forever, level 1';
- segment의 header 블록안의 extent map 안에는 해당 내용들을 담고 있다.
- 해당 header 블록 만큼은 direct path read 방식이어도 buffer cache에 single block i/o로 올려야한다.
select extent_id, block_id, bytes, blocks
from dba_extents
where owner='HR'
and segment_name='IND_RANDOM'
EXTENT_ID BLOCK_ID BYTES BLOCKS
---------- ---------- ---------- ----------
0 9928 65536 8
1 9936 65536 8
2 9944 65536 8
3 9952 65536 8
4 9960 65536 8
5 9968 65536 8
6 9976 65536 8
7 10112 65536 8
8 10120 65536 8
9 10128 65536 8
10 10136 65536 8
11 10144 65536 8
12 10152 65536 8
13 10160 65536 8
14 10168 65536 8
15 10176 65536 8
16 10240 1048576 128
17 10368 1048576 128
18 10496 1048576 128
19 10624 1048576 128
20 10752 1048576 128
21 10880 1048576 128
22 11008 1048576 128
23 11136 1048576 128
24 11264 1048576 128
25 11392 1048576 128
26 11520 1048576 128- index를 설정후 건수 세기
- owner 컬럼에는 not null 제약조건이 걸려있기 때문에 data block을 확인하지 않아도 index안에 있는 건수 만ㅌ으로도 알수 있기 때문에 굳이 table을 조회하지 않는다.
- 하지만 count(*) 가 아닌 select * 일 경우에는 테이블도 조회해야 하기 때문에 엄청난 i/o를 유발할 것이다.
select count(*) from hr.ind_random where owner='SYS';

  COUNT(*)
----------
     52254

SYS@ORA19C> select count(*) from hr.ind_random where owner='HR';

  COUNT(*)
----------
        60

create index hr.ind_random_ix on hr.ind_random(owner);

alter system flush buffer_cache;

alter session set tracefile_identifier = 'hr6';

alter session set events '10046 trace name context forever, level 8';

select count(*) from hr.ind_random where owner='SYS';

alter session set events '10046 trace name context off';
select count(*)
from
 hr.ind_random where owner='SYS'


call     count       cpu    elapsed       disk      query    current        rows
------- ------  -------- ---------- ---------- ---------- ----------  ----------
Parse        1      0.00       0.00          0          0          0           0
Execute      1      0.00       0.00          0          0          0           0
Fetch        2      0.00       0.00        111        111          0           1
------- ------  -------- ---------- ---------- ---------- ----------  ----------
total        4      0.00       0.00        111        111          0           1

Misses in library cache during parse: 1
Optimizer mode: ALL_ROWS
Parsing user id: SYS
Number of plan statistics captured: 1

Rows (1st) Rows (avg) Rows (max)  Row Source Operation
---------- ---------- ----------  ---------------------------------------------------
         1          1          1  SORT AGGREGATE (cr=111 pr=111 pw=0 time=8113 us starts=1)
     52254      52254      52254   INDEX RANGE SCAN IND_RANDOM_IX (cr=111 pr=111 pw=0 time=7454 us starts=1 cost=6 size=12355 card=2471)(object id 76300)


Elapsed times include waiting on following events:
  Event waited on                             Times   Max. Wait  Total Waited
  ----------------------------------------   Waited  ----------  ------------
  Disk file operations I/O                        1        0.00          0.00
  SQL*Net message to client                       2        0.00          0.00
  db file sequential read                       111        0.00          0.00
  SQL*Net message from client                     2        1.55          1.55
- sys유저로 조건을 건 뒤 전체 데이터 조회
- 옵티마이저가 자동으로 index range scan 하는걸 볼 수 있다. 엄청난 i/o가 유발된다.
select /*+ gather_plan_statistics */ * from hr.ind_random where owner='SYS';
select * from table(dbms_xplan.display_cursor(null,null,'allstats last'));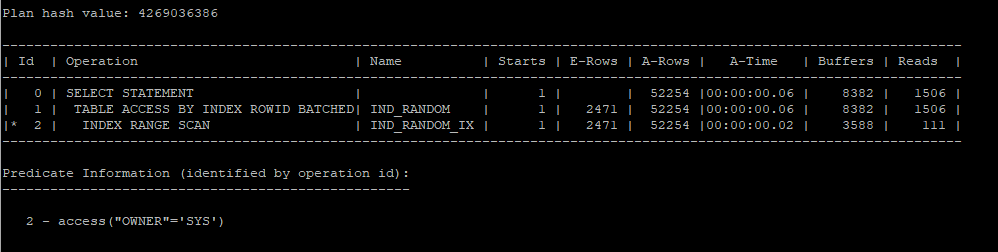
- hint를 주어 full table scan을 유발했다. i/o 수가 많이 줄었다.
select /*+ gather_plan_statistics full(i) */ * from hr.ind_random i where owner='SYS';
select * from table(dbms_xplan.display_cursor(null,null,'allstats last'));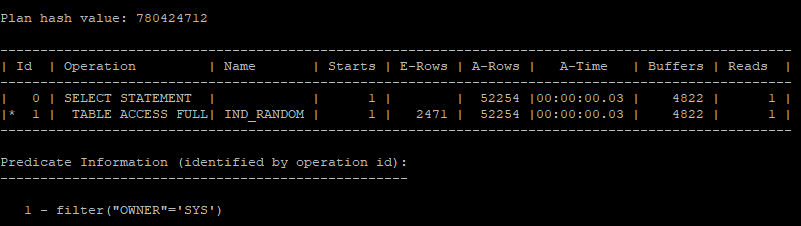
- 해당 실행계획을 보게되면 52254개의 owner가 sys인 값을 index range scan했기 때문에 buffer pinning이 실행되어 112개의 i/o로 줄었지만 object_name 이 all_objects 인 값이 1개 밖에 없는데 해당 값을 찾고자 1385개의 데이터 buffer를 i/o 해야하기때문에 성능이 좋지 않다.
select /*+ gather_plan_statistics */ * from hr.ind_random where owner='SYS' and object_name = 'ALL_OBJECTS';
select * from table(dbms_xplan.display_cursor(null,null,'allstats last'));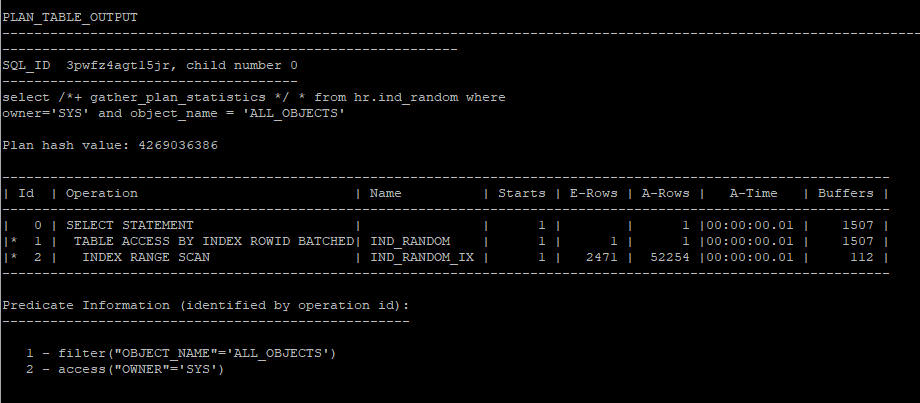
- 해당 문제를 해결하기 위해서는 owner 와 object_name 컬럼을 조합인덱스로 설정해야 한다.
create index hr.ind_random_idx on hr.ind_random(owner,object_name);

select /*+ gather_plan_statistics */ * from hr.ind_random where owner='SYS' and object_name = 'ALL_OBJECTS';
select * from table(dbms_xplan.display_cursor(null,null,'allstats last'));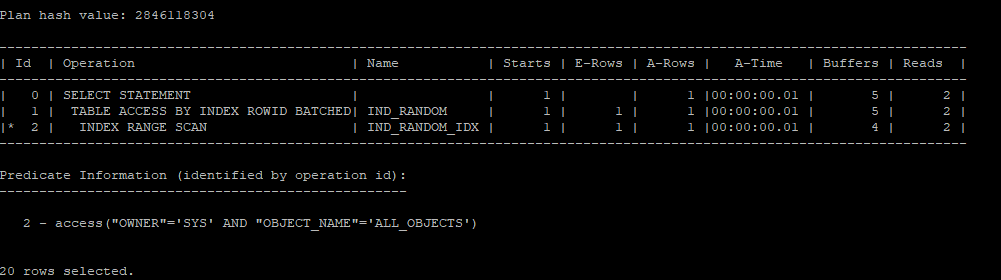
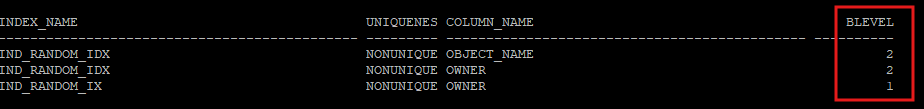
- index의 leaf block 까지 가기 전의 root, branch block의 i/o 수 확인
- BLEVEL이 2이라는건 leaf block 가기전에 2개가 있기 때문에(아마 root, branch가 다른 block에 나뉘어져 있다) leaf block은 3번째 i/o로 보게된다.
select ix.index_name, ix.uniqueness, ic.column_name, ix.blevel
from dba_indexes ix, dba_ind_columns ic
where ix.index_name = ic.index_name
and ix.table_name = 'IND_RANDOM'
and ix.owner='HR';