Matplotlib란?
파이썬에서 데이터를 차트나 plot으로 시각화해주는 라이브러리 패키지이다. 데이터 분석 시각화에 많이 쓰였던 MATLAB 형태의 그래프를 그리기 가능하다.
라인plot, 바, 차트, pie차트, 히스토그램, boxplot, scatterplot 등 다양한 차트와 plot 스타일을 지원한다.
Matplotlib 배워보기
수업시간에 배운 간단한 그래프 시각화 예제들만 진행하겠습니다.
.plot()
- 기본 그래프 그리기 (x축, y축)
from matplotlib import pyplot as plt

plt.plot([0, 1, 2, 3], [5, 2, 10, 12])
plt.show()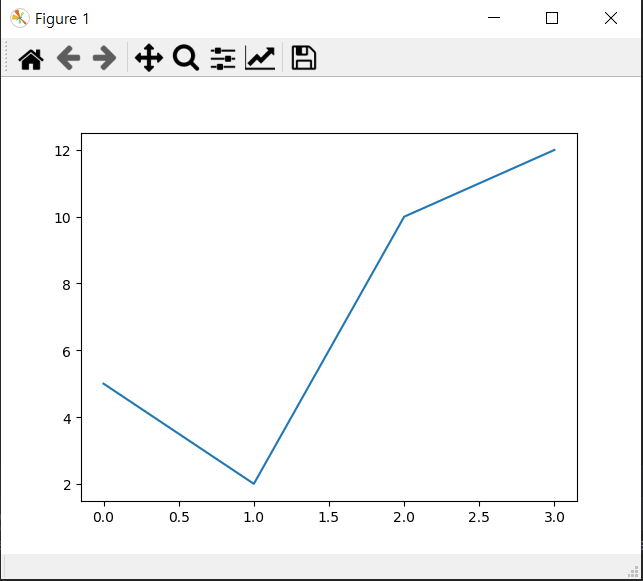
(ex) y(x) = x(x-2) 와 z(x) = -x(x-2) 그래프 그리기
- x는 -10~10까지의 정수
- 같은 좌표에 그리기
x = np.arange(-10, 11, 0.1)
y = x * (x-2)
z = -x * (x-2)
plt.title("test graph") # 표 제목 수정
plt.xlabel("x axis")    # x축 제목
plt.ylabel("y axis")    # y축 제목

plt.plot(x, y, "y:h", label="y values")  # plot(x축, y축) , label=계열 제목
plt.plot(x, z, "r:x", label="z values")  # x축과 y축 매개변수 위치 바꾸면 그래프 모양 달라짐!

plt.legend()    # 범례 추가
plt.xlim(-2, 4) # 처음에 보여지는 x축 설정
plt.ylim(-5, 5) # 처음에 보여지는 y축 설정
plt.grid(True)  # 눈금 활성화
plt.show()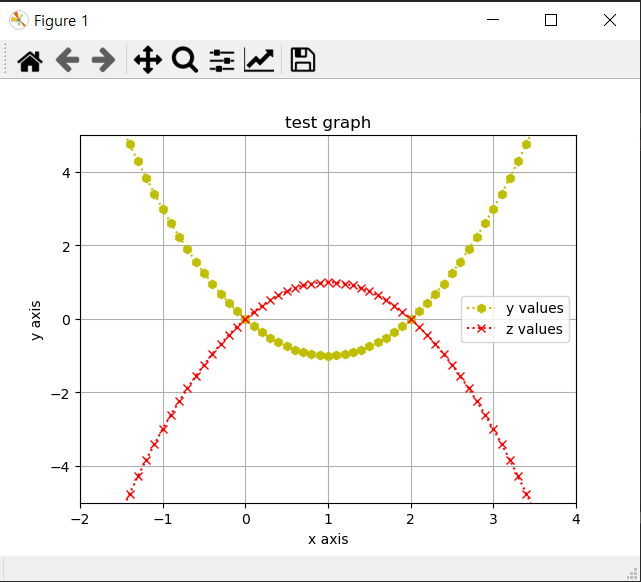
- .bar()
- 막대 그래프 그리기
import pandas as pd
sell = [210000, 340000, 780000, 120000]
day = ["Fri", "Sat", "Sun", "Mon"]

ts = pd.Series(sell, index=day)

idx = np.arange(len(day))

plt.bar(idx, ts)
plt.title("Total Sales")    # 제목 변경
plt.xlabel('Day')   # x축 제목 변경
plt.ylabel("Won")   # y축 제목 변경
plt.xticks(idx, day)    # x축 좌표 요일로 변경
plt.show()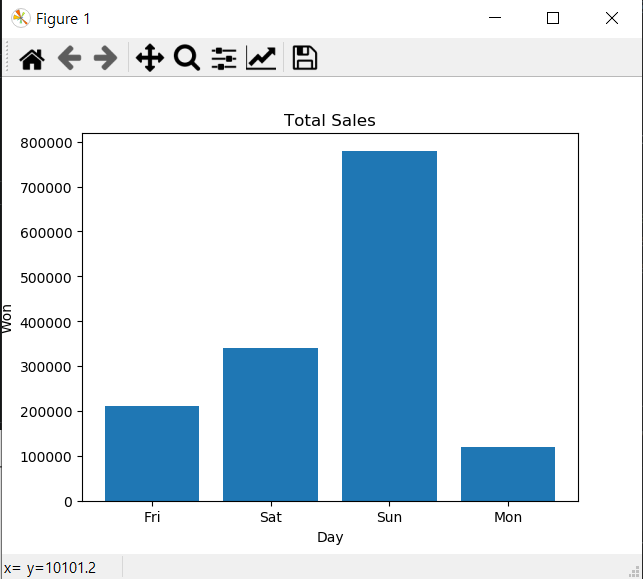
- .pie()
- 원 그래프 그리기
group_names = ['Korea', 'Japan', 'China']
group_sizes = [95, 54, 25]
group_colors = ['yellowgreen', 'lightskyblue', 'lightcoral']

plt.pie(group_sizes, labels=group_names, colors=group_colors,
        startangle=0, autopct='%1.3f%%', textprops={'fontsize':14})
plt.axis('equal')   # equal length of X and Y axis
plt.title('Pie Chart Example', fontsize=18)
plt.legend()
plt.show()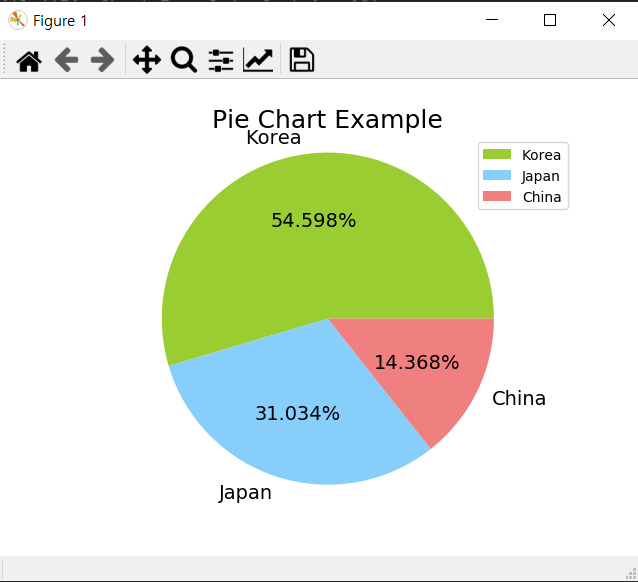
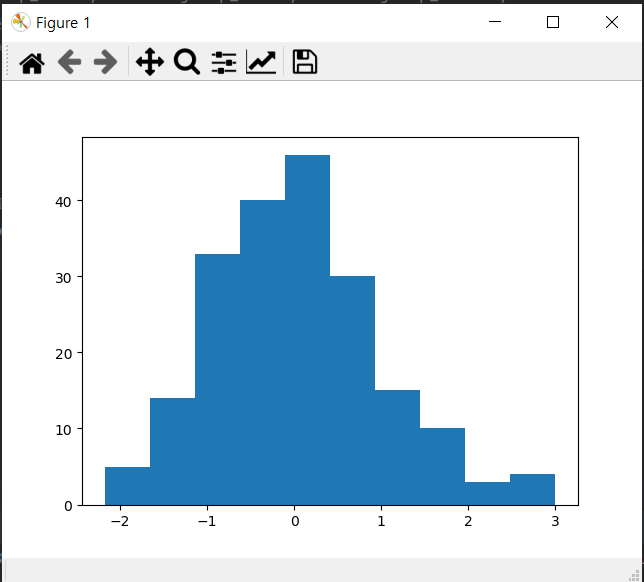
- .hist()
- 히스토그램 그리기
# 히스토그램 그리기
s3 = pd.Series(np.random.normal(0, 1, size=200))

# 주의!) s3.hist() -> 이렇게 하면 안나옴
plt.hist(s3)
plt.show()