✔️ label
plt.plot(df.temperature, df.humidity)
plt.xlabel('xlabel')
plt.ylabel('ylabel')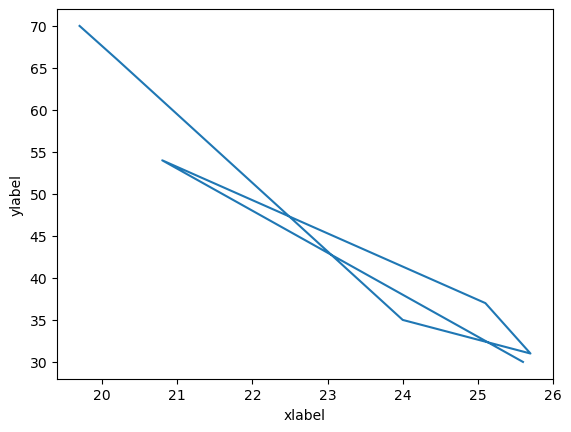
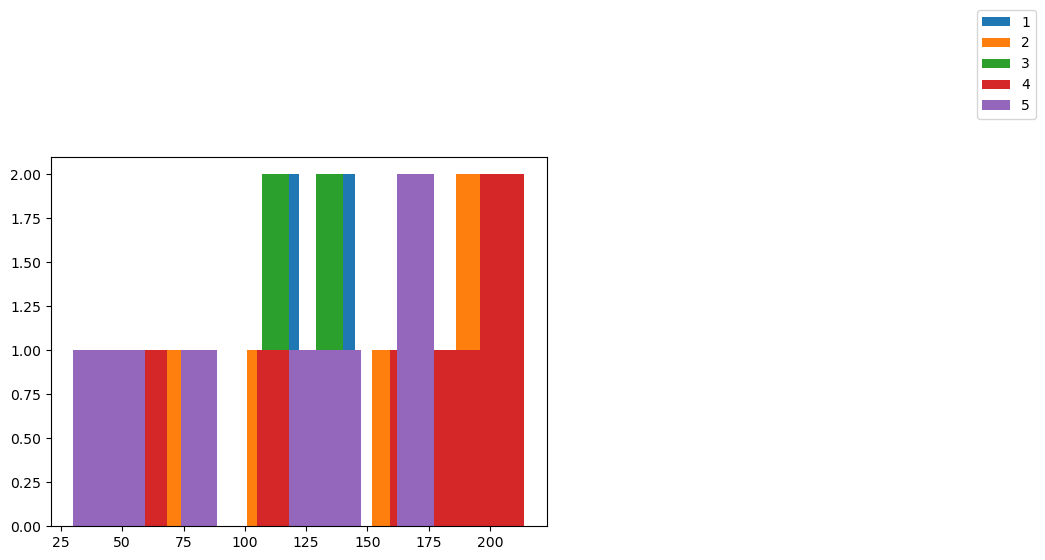
✔️ legend
group_dat = orange_dat.groupby("Tree")
for group, dat in group_dat:
    plt.hist(dat["circumference"],
             label=group)
plt.legend(loc="center right", # loc는 bbox안에서 범례의 위치를 정한다.
           bbox_to_anchor=(0.5,0.5,1.5,1.5)) #범례의 위치와 크기를 정한다. x좌표, y좌표, 가로크기, 세로크기