머신러닝의 전체적인 프로세스
- 데이터 수집
- 크롤링, 설문조사, 회사에 쌓여져 있는 데이터베이스에서 조회
- 데이터 분석
- 내가 가지고 있는 데이터가 어떤 분포를 가지고 있고, 어떤 특성을 가지고 있는가
- pandas 및 numpy를 이용한 통계 분석
- info(), describe() 함수를 이용한 분석을 제일 처음부터 하자
- nan 값의 개수 여부, min(), max()에 의한 최대 최소의 차 등등
- 표준 편차 확인
- 시각화 툴을 이용한 데이터 빈도, 분포도, 추세 등을 확인
- 데이터 분석을 기반으로 한 머신러닝 모델링
- 평가와 검증 과정이 포함 된다.
- train / test split 등을 연구
- 평가 기준 마련하기
캘리포니아 주택가격 데이터셋 분석하기
📍 사용할 데이터셋 다운로드 하기
import os
import tarfile
import urllib.request
DOWNLOAD_ROOT = "https://raw.githubusercontent.com/ageron/handson-ml2/master/"
HOUSING_PATH = os.path.join("datasets", "housing")
HOUSING_URL = DOWNLOAD_ROOT + "datasets/housing/housing.tgz"
def fetch_housing_data(housing_url= HOUSING_URL, housing_path= HOUSING_PATH):
os.makedirs(housing_path, exist_ok= True)
tgz_path = os.path.join(housing_path, "housing.tgz")
urllib.request.urlretrieve(housing_url, tgz_path)
housing_tgz = tarfile.open(tgz_path)
housing_tgz.extractall(path= housing_path)
housing_tgz.close()
fetch_housing_data()📍 다운 받은 데이터셋( csv ) 파일을 pandas 데이터프레임으로 전환
import pandas as pd

def load_housing_data(housing_path=HOUSING_PATH):
	csv_path = os.path.join(housing_path, 'housing.csv')

    return pd.read_csv(csv_path)
📍 데이터셋 확인
housing = load_housing_data()
housing.head()

~~>
✨ 실제 프로젝트를 진행 할 때는 수집해야 할 대상을 미리 선정하는 것이 매우 중요
housing 데이터 알아보기
- longitude : 경도
- latitude : 위도
- housing_median_age : 중간 주택 연도
- total_rooms : 방의 총 개수
- total_bedrooms : 침실의 총 개수
- population : 인구
- households : 가구
- median_income : 중간 소득
- median_house_value : 중간 주택 가격
- ocean_proximity : 바다와의 거리
주택 가격(median_house_value)을 예측할 것
제일 먼저 데이터 프레임의 정보를 확인
- 데이터의 크기( data volume ), 데이터의 종류( data type ), nan값 여부 등을 제일 먼저 확인
housing.info()

~~>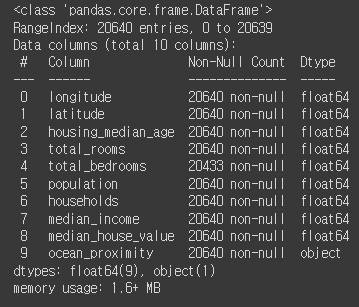
💡 Dtype을 확인해야 하는 이유
- 보통 데이터베이스에서 끌어오면 데이터 타입에 대해서 별 문제가 없다
- 크롤링(스크래이핑)을 했을 때 데이터 타입에 대해서 문제가 생길 때가 종종 있다.
- 웹 페이지( HTML, CSS )에 존재하는 데이터는 무조건 문자열 데이터
- 내가 실수( float )나 정수( integer ) 데이터를 가지고 와도 실제 처리 되는 데이터 타입은 무조건 문자열
- 따라서 원하는 데이터 타입이 아닐 경우 ( 예를 들어 실수 데이터를 원했는데 문자열(object) 타입이면 astype 등을 활용해서 데이터의 타입을 반드시 변경해 줘야한다
- ✨머신러닝이던, 딥러닝이던 무조건 숫자형식의 데이터만 인식이 가능하다!
데이터의 통계적 특성 확인
housing.describe()

~~>
- count : 샘플의 개수
- mean : 평균
- std : 표준편차
- min : 최솟값
- 25% : 1사분위 값( 25% 지점의 값 )
- 50% : 2사분위 값( 50% 지점의 값 == 중간값 )
- 75% : 3사분위 값( 75% 지점의 값 )
- max : 최댓값
데이터의 형태를 빠르게 검토( 시각화 )
import matplotlib.pyplot as plt
%matplotlib inline

housing.hist(bin=50, figsize=(20, 15))

plt.show()

~~>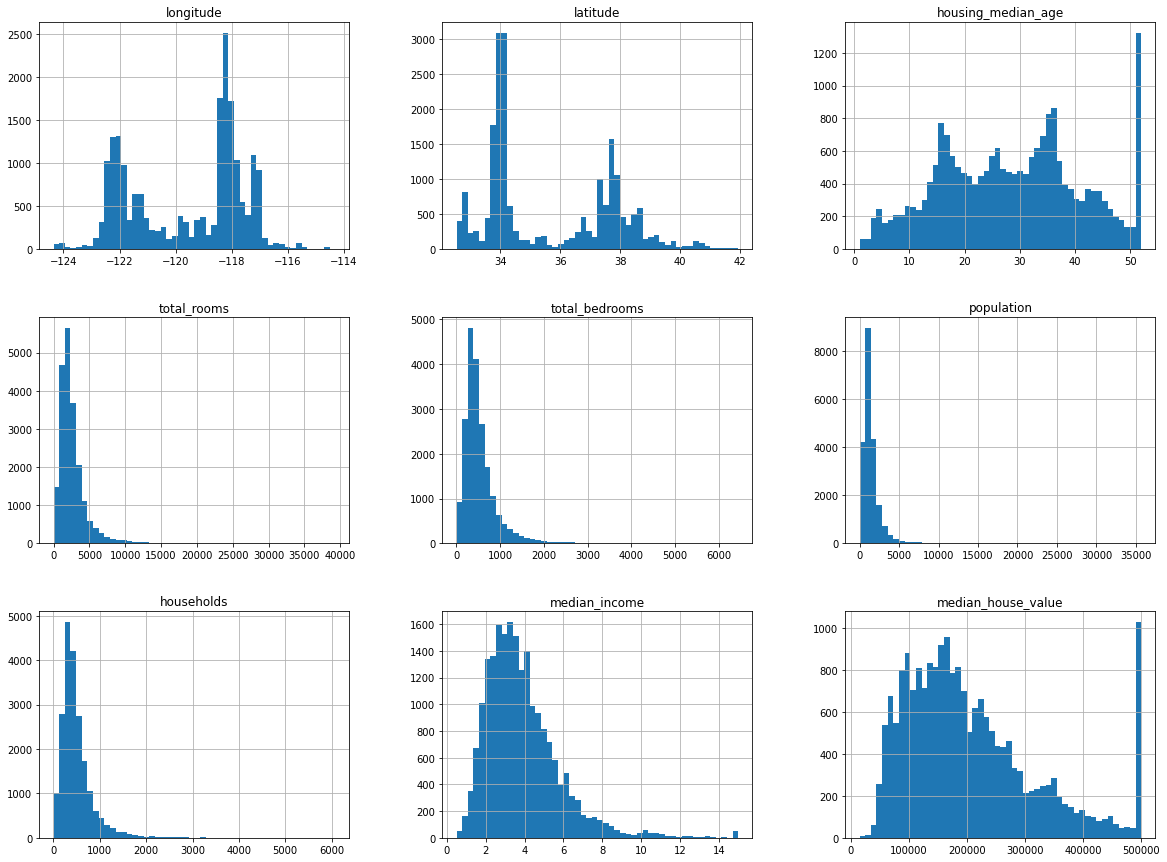
✨ 시각화에 의해서 데이터의 편집 계획이나, 데이터 추가 수집 계획 등을 세울 수가 있다
테스트 세트 만들기
💡 가지고 있는 데이터를 모두 훈련으로 사용하면
- 잘 됐는지, 잘 안됐는지를 판단하기 힘들다
👉 앞으로 만들 머신러닝 모델이 새로운 데이터에 대해서도 잘 예측을 하는지를 평가하기 위해 테스트 세트를 분할
테스트 데이터 쪼개기
- shuffle - split을 기본으로 한다.
- 해시 기준으로 쪼개기
- Stratified split( 계층적 쪼개기 )
📍 랜덤 셔플링
import numpy as np

def split_train_test(data, test_ratio):

    suhffled_indices = np.random.permutation(len(data))	# 데이터 개수 만큼 무작위 인덱스를 가진 리스트 생성
    test_set_size = int(len(data) * test_tatio)	# 지정한 비율대로 테스트 세트의 크기 구하기
    test_indices = shuffled_indices[: test_set_size]	# 원본 데이터에서 test_set_size 만큼을 잘라냄
    train_indices = shuffled_indices[test_set_size: ]	# 나머지 데이터는 훈련 세트로 사용

return data.iloc[train_indices], data.iloc[test_indices] # 각각 train, test로 잘려진 데이터프레임 리턴df_train, df_test = split_train_test(housing, 0.2) # 20%만큼 훈련 세트와 테스트 세트로 나눠준다.
print('훈련 세트의 길이 : {} / 테스트 세트의 길이 : {}' .format(len(df_train), len(df_test)))
~~>
훈련 세트의 길이 : 16512 / 테스트 세트의 길이 : 4128💡 단순하게 랜덤으로 데이터를 섞고 잘랐을 때의 문제
👉 무한하게 랜덤을 돌리게 되면 어느 순간 train / test가 서로 섞이게 되면서 머신이(알고리즘이) 모든 데이터를 사용하게 된다.
해결 방법 1: 랜덤 시드 값을 고정 - 항상 같은 랜덤을 구현하게 된다.`np.random.seed(42)
- 데이터가 삭제나 추가가 되면 랜덤이 초기화 된다. 즉 빈번하게 데이터가 바뀌는 경우에는 효가가 떨어진다는 단점이 있다.
해결 방법 2: 데이터의 고윳값을 활용해서 잘라내는 방법 - 데이터 해쉬를 사용하는 방법
- 해쉬 : 특정값만 가지는 고윳값
- 해쉬값을 정렬한 다음에 20%는 테스트로, 나머지 80%는 훈련세트로 삼ㄴㄴ 방법
- 하나의 데이터에 대한 해시는 언제나 똑같기 때문에, 데이터가 추가가 되던, 삭제가 되던 언제나 테스트는 테스트로, 훈련은 훈련으로 유지 된다.
from zlib import crc32

# 테스트가 되는지, 훈련이 되는지를 결정해 주는 함수
# 리턴은 True, False( True : 테스트, False : 훈련 )
def test_set_check(identifier, test_ratio):

    # crc32 : 해시값을 구하는 과정( 64비트와 32비트 해쉬를 동일하게 구하기 위함 )
    # & 0xffffffff : 해시 마스크 씌우기
    return crc32(np.int64(identifier) &0xffffffff < test_ratio * 2**32

def split_train_test_by_id(data, test_ratio, id_column):

    ids = data[id_column]
    intest_set = ids.apply(lambda id_: test_set_check(id_, test_ratio))

    return data.loc[~in_test_set], data.loc[in_test_set]
💡 인덱스를 활용해서 해쉬로 쪼갤 때의 제약 사항이 심하다
- 데이터의 추가는 반드시 행의 맨 끝에서만 일어나야 한다
- 어떠한 행도 삭제가 되어선 안된다( 인덱스가 안바뀌는 경우는 제외 )
✨ 해쉬가 되어야 할 기준은 언제나 고유한 값으로 이루어져 있는 것을 기준으로 하는 것이 좋다. ( 즉 대표할 수 있는 값 )
📍 1. 인덱스를 활용해서 해시 값으로 나누는 경우
housing_with_id = housing.reset_index()

train_set, test_set = split_train_test_by_id(housing_with_id, 0.2, 'index')
📍 2. 왠만해서는 바뀌지 않을 위경도를 이용해 데이터 세트 나누기
housing_with_id[id] = housing['longituede'] * 1000 + housing['latitude']	# 마음대로 값을 편집
train_set, test_set = split_train_test_by_id(housing_with_id, 0.2, 'id')
샘플링 편향과 계층적 샘플링
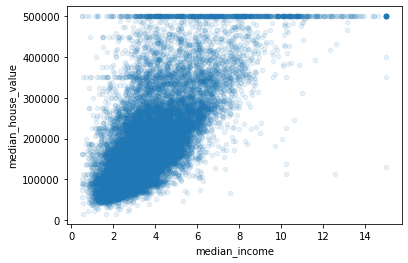
- median_income( 중간 소득 )은 label인 median_house_value를 예측하는데 있어서 매우 중요한 데이터이다
- 그런데 median_income은 저소득 구간에 편중 되어있는 데이터이다.
- 단순하게 랜덤이나 해쉬로만 나누게 되면 데이터으 ㅣ비중이 적은 고소득 구간은 훈련 데이터세트에 포함이 안될 가능성이 너무 크다.
- 반대로 저소득 구간은 훈련 데이터세트에 포함될 가능성이 너무 크다.
housing['income_cat'] = pd.cut(housing['median_income'],	# 구간을 나눌 대상이 되는 시리즈
				bin=[0., 1.5, 3.0, 4.5, 6., np.inf],	# 구간 나누기
				labels=[1, 2, 3, 4, 5])

housing['income_cat'].head()

~~>
0    5
1    5
2    5
3    4
4    3
Name: income_cat, dtype: category
Categories (5, int64): [1 < 2 < 3 < 4 < 5]
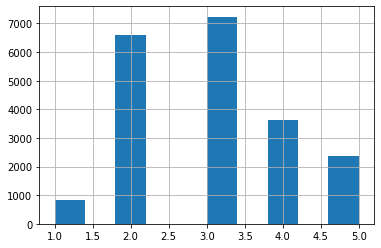
📍 income_cat의 빈도수를 보면 각 카테고리에 해당하는 데이터의 양을 볼 수 있다
housing['income_cat'].hist()

~~>
from sklearn.model_selection import StratifiedShuffleSplit # 사이킷런의 StratifiedShuffleSplit

split = StratifiedShuffleSplit(n_splits=1, test_size=0.2, random_state=42)

for train_index, test_index in split.split(housing, housing["income_cat"]):
	strat_train_set = housing.loc[train_index]
  	strat_test_set  = housing.loc[test_index]
from sklearn.model_selection import train_test_split
def income_cat_proportions(data):
return data["income_cat"].value_counts() / len(data)
train_set, test_set = train_test_split(housing, test_size=0.2, random_state=42)
compare_props = pd.DataFrame({
"전체": income_cat_proportions(housing),
"계층 샘플링": income_cat_proportions(strat_train_set),
"무작위 샘플링": income_cat_proportions(train_set),
}).sort_index()
compare_props["무작위 샘플링 오류율"] = 100 * compare_props["무작위 샘플링"] / compare_props["전체"] - 100
compare_props["계층 샘플링 오류율"] = 100 * compare_props["계층 샘플링"] / compare_props["전체"] - 100
compare_props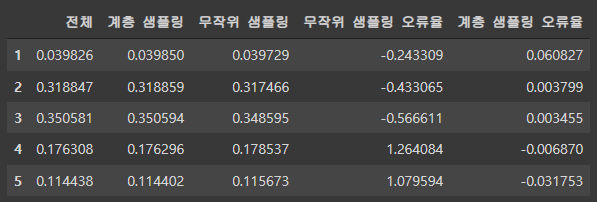
✨ 계층적 샘플링은 한쪽으로 데이터가 많이 편향되어 있을 때 사용
탐색적 데이터 분석
housing = strat_train_set.copy()	# 계층 분할을 수행한 훈련 데이터세트
housing.head()

~~>
housing.plot(kind='scatter', x='longitude', y='latitude')

~~>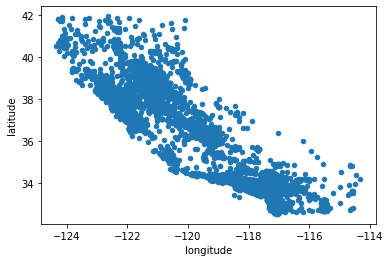
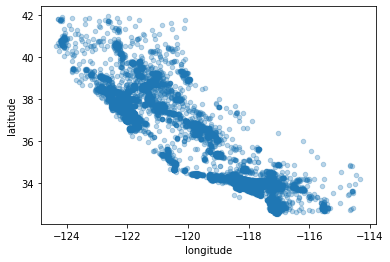
💡 위의 시각화만 보고 어디에 집이 많고 적은지 알 수 있을까?
housing.plot(kind='scatter', x='longitude', y='latitude', alpha=.3)

~~>
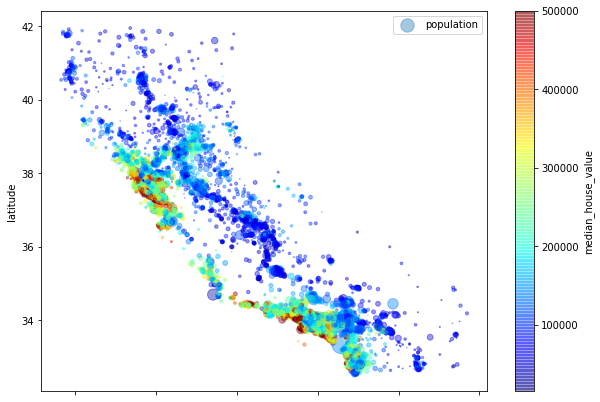
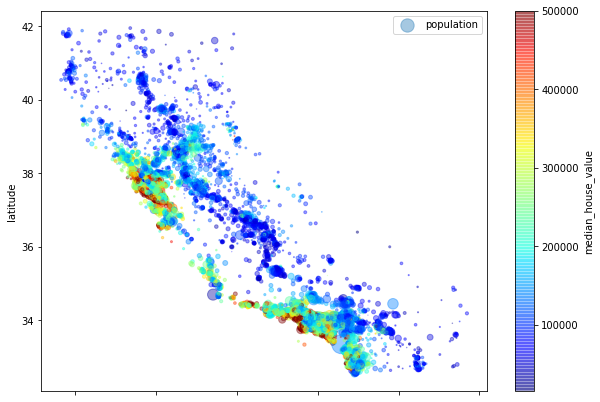
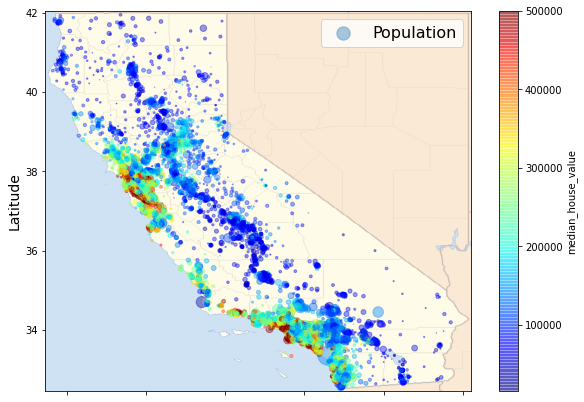
👉 주택의 가격을 색상으로 표현, 인구수를 원의 크기로 확인
housing.plot(kind='scatter', x='longitude', y='latitude', alpha=.4, s=housing["population"] / 100, label="population", figsize=(10, 7), c='median_house_value', cmap=plt.get_cmap('jet'),
             colorbar=True)

plt.legend()

~~>
# Download the California image
images_path = os.path.join(".", "images", "end_to_end_project")
os.makedirs(images_path, exist_ok=True)
DOWNLOAD_ROOT = "https://raw.githubusercontent.com/ageron/handson-ml2/master/"
filename = "california.png"
print("Downloading", filename)

url = DOWNLOAD_ROOT + "images/end_to_end_project/" + filename
urllib.request.urlretrieve(url, os.path.join(images_path, filename))
import matplotlib.image as mpimg
california_img=mpimg.imread(os.path.join(images_path, filename))
ax = housing.plot(kind="scatter", x="longitude", y="latitude", figsize=(10,7),
s=housing['population']/100, label="Population",
c="median_house_value", cmap=plt.get_cmap("jet"),
colorbar=True, alpha=0.4,
)
plt.imshow(california_img, extent=[-124.55, -113.80, 32.45, 42.05], alpha=0.5,
cmap=plt.get_cmap("jet"))
plt.ylabel("Latitude", fontsize=14)
plt.xlabel("Longitude", fontsize=14)
plt.legend(fontsize=16)
plt.show()
~~>
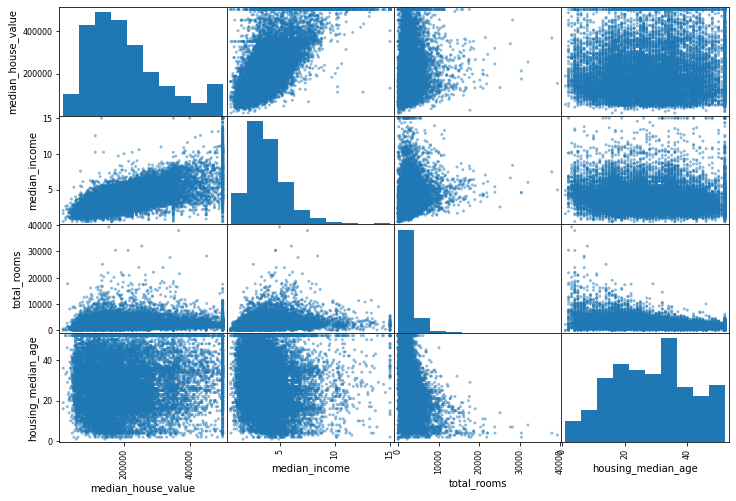
상관관계 조사하기
from pandas.plotting import scatter_matrix

attributes = ["median_house_value", "median_income", "total_rooms", "housing_median_age"]

scatter_matrix(housing[attributes], figsize=(12, 8))

plt.show()

~~>
housing.plot(kind='scatter', x='median_income', y='median_house_value', alpha=0.1)

~~>
특성 조합
방의 개수와 인구수
- 가구당 방의 개수
- 전체 방에 대한 침실의 비율
- 가구당 인구수
📍 특성 조합을 하기 전 상관계수 확인
corr_matrix = housing.corr()📍 중간 주택 가격에 대한 다른 특성들과의 상관계수 구하기
corr_matirx['median_house_value'].sort_values(ascending=False)

~~>
median_house_value    1.000000
median_income         0.687160
total_rooms           0.135097
housing_median_age    0.114110
households            0.064506
total_bedrooms        0.047689
population           -0.026920
longitude            -0.047432
latitude             -0.142724
Name: median_house_value, dtype: float64housing["rooms_per_household"] = housing["total_rooms"] / housing["households"] # 가구당 방의 비율
housing["bedrooms_per_room"] = housing["total_bedrooms"] / housing["total_rooms"] # 전체 방에 대한 침실의 비율
housing["population_per_household"] = housing["population"] / housing["households"] # 가구당 인구 비율📍 특성 조합 후의 상관 계수 확인
corr_matrix = housing.corr()
corr_matirx['median_house_value'].sort_values(ascending=False)

~~>
median_house_value          1.000000
median_income               0.687160
rooms_per_household         0.146285
total_rooms                 0.135097
housing_median_age          0.114110
households                  0.064506
total_bedrooms              0.047689
population_per_household   -0.021985
population                 -0.026920
longitude                  -0.047432
latitude                   -0.142724
bedrooms_per_room          -0.259984
Name: median_house_value, dtype: float64
✨✨✨ 어떤 특성 조합을 해야 할지도 연구가 필요하다!!