S1-WEEK2 Note 01 : Hypothesis Test
학습목표
- Estimation / Sampling
- 가설검정
- T-test
Warm-up : Hypothesis Testing
Step in data-driven decision-making
- Formulate a hypothesis
- Find the right test
- Execute the test
- Make a decision
Hypotheses
- Null hypothesis : H_0
- Alternative hypothesis : H_1 or H_A
Warm-Up : t-test
Hypothesis Test
Descriptive Statistics(기술통계치)
대표적 : count, mean, standard dev, min, 1Q, median, 3Q, max...
이외에도
Mean(평균) / Median(중앙) / Mode(최빈)
Range
Var / SD
Kurtosis(첨도)
Skewness(왜도(비대칭도))
가 있다
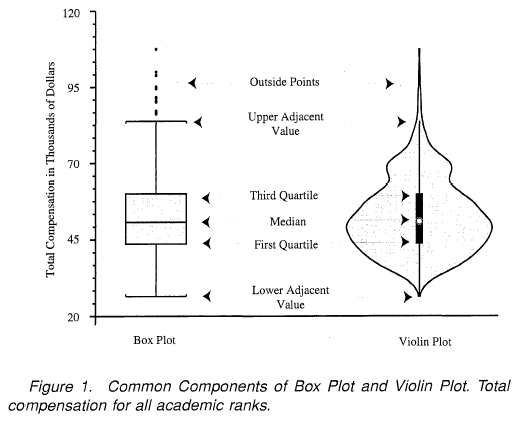
기술 통계치 시각화
- boxplot
- violin plot(boxplot에 빈도추가)
Inferetial Statistics(추리통계치)
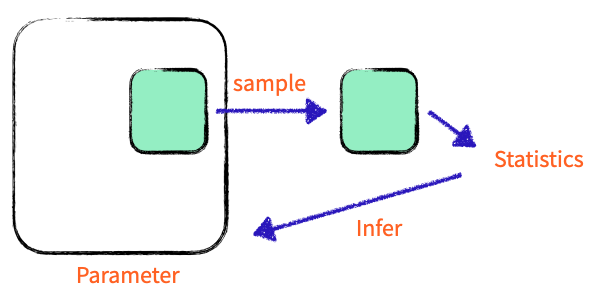
- population에서 sample 추출
- sample의 statistic 계산
- sample의 statistics를 population의 statistic과 비교, infer
- Population
- Parameter
- Statistic
- Estimator(추정량)
표집값들로부터 모수의 값을 추정하는 방법 - Standard Deviation(표준편차)
- Standard Error
Sampling
-
Simple random sampling : 무작위 추출

-
Systematic sampling : 규칙 추출

-
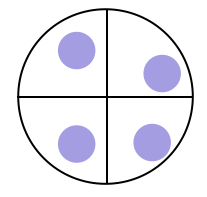
Stratified random sampling : 모집단을 grouping 후, group 별 무작위 추출
-
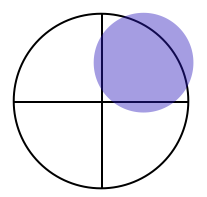
Cluster sampling : 모집단을 grouping 후, 특정그룹 무작위 선택
가설 검정
np.random.seed()
난수를 예측가능하게 만듦
Standard Error of the Sample Mean(표본 평균의 표준 오차)
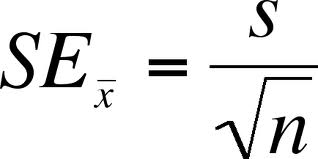
s (우측) = 표본의 표준편차 (sample standard deviation)
n = 표본의 수 (sample size)
표본의 수(n)가 클수록
추측은 더 정확해지고(SE가 작아짐)
높은 신뢰도를 바탕으로 모집단에 대해 예측 가능
Student T-test
T-test Process
- Null Hypothesis(귀무가설) 설정 (fair coin, p = 0.5)
- Alternative Hypothesis(대안가설) 설정 (not fair coin, p != 0.5)
- Confidence Level(신뢰도) 설정 : 모수가 신뢰구간 안에 포함될 확률
신뢰도 95%의 의미
= 모수가 신뢰 구간 안에 포함될 확률이 95%
= 귀무가설이 틀렸지만 우연히 성립할 확률이 5%
- p-value 확인 (0<p-value<1)
p-value가 (1-Confidence)보다 낮은 경우, 귀무가설을 기각하고 대안 가설을 채택함
- 신뢰도 95% : p-value 0.05
pvalue < 0.05 (5%) : 귀무가설이 옳을 확률이 5%이하 -> 틀렸다 (일반적인 기준)
pvalue > 0.1 (10%) : 귀무가설이 옳을 확률이 10%이상인데 -> 귀무가설이 맞다 ~ 틀리지 않았을것이다
- 신뢰도 99% : p-value 0.01
T-test with Scipy
https://docs.scipy.org/doc/scipy/reference/generated/scipy.stats.ttest_1samp.html
sample에 따른 분류 : one sample t-test, two sample t-test
-
one sample t-test
1개의 sample값들의 평균이 특정값과 동일한지 비교 -
two sample t-test
2개의 sample 값들의 평균이 서로 동일한지 비교.
조건에 따른 분류 : one-side test, two-side test
-
One side test
샘플 데이터의 평균이 "X"보다 크다 혹은 작다 / 크지 않다 작지 않다 -
Two side (tail / direction) test
샘플 데이터의 평균이 "X"와 같다 / 같지 않다
