S1-WEEK2 Note 02 : Hypothesis Test 2
학습목표
- t-test를 위한 조건
- t-test외에 다른 가설검정 방법
- Type of Error
- -test의 목적과 사용예시
- 모수통계와 비모수통계의 차이
Warm-up : 자유도
독립변수의 수
ex) x+y+z = 10 : 독립변수2, 종속변수1
t-test
그룹의 평균값 비교
t-test 조건
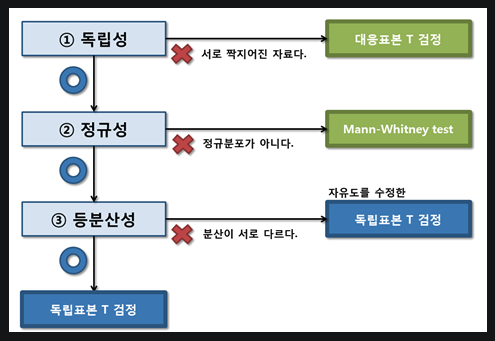
1. 독립성
두 그룹이 paired한 쌍이 아니어야함

2. 정규성
두 그룹이 어느정도 유사한 수준의 분산 값을 가지는지
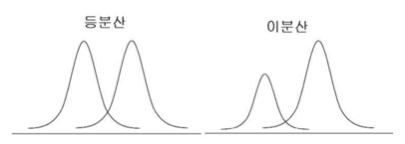
3. 등분산성
정규(noraml) 분포인지
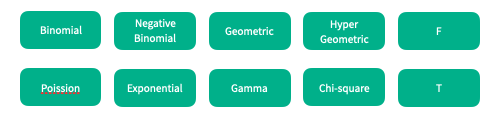
- 분포의 종류
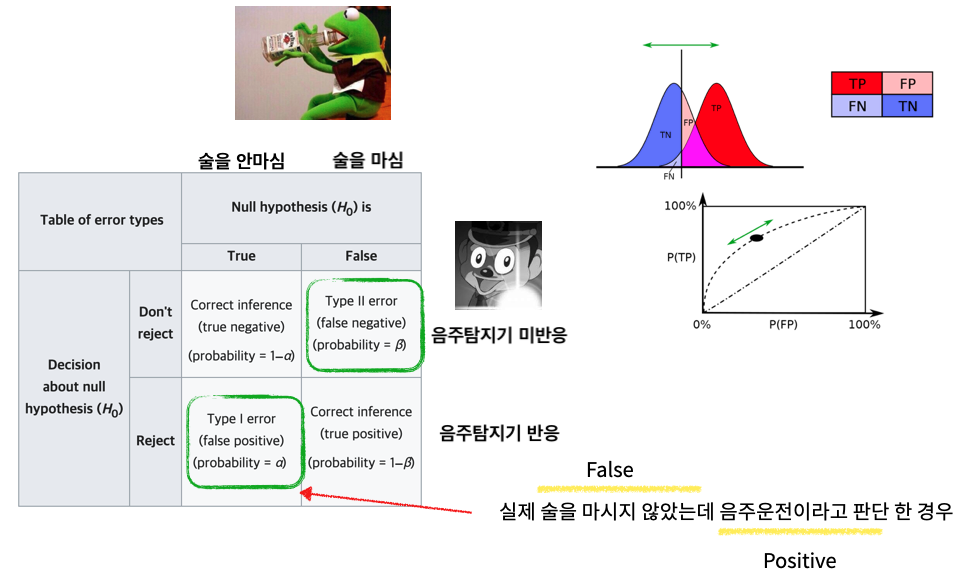
Type of Error
Non parametric methods (distribution free method)
모집단이 특정 확률 분포 (normal과 같은)를 따른 다는 전제를 하지 않는 방식
test도 Non parametric methods의 한 종류
- Categorical 데이터
- 극단적 outlier
인 경우 유용한 방법
test (Goodness of Fit test)
주어진 데이터가
- 특정 예상되는 분포와 동일한 분포를 나타내는지(one sample)
- 두 분포가 독립인지(two sample)
에 대한 가설검정
one sample test
Null Hypothesis : Distribution is similar (or specific input)
Alternative Hypothesis : Distribution is not similar (or specific input)
 제곱 -> 모든 값을 양수로 만들고 관측과 예측값의 차이를 더 강조
*exp = sum(obs) / count
-> p-value
: 데이터 scale에 따라 같은 분포여도 다른값
-> 표준화 된 값 필요
two sample test
Null Hypothesis : Varialbe is independent
귀무가설 : 두 변수간 연관이 없다
Alternative Hypothesis : Varialbe is not independent (or specific input)
대안가설 : 두 변수간 연관이 있다


Numerical -> Categorial
Type casting
numerical 이지만, continuous하지 않은 경우
바로 category로 사용
ex) 1, 2, 3 -> 1, 2, 3
Binning
numerical 이지만, continuous
구간별로 나누어 사용
ex) 1.4, 2, 3.1, 2.8, 1.1, 2.5 -> A : 1 ~ 2, B : 2 ~ 3, C : 3 ~ 4
자유도 (Degrees of Freedom)
해당 parameter를 결정짓기 위한 독립적으로 정해질 수 있는 값의 수
보통
-
test 자유도
1-sample (적합도 검정), DF = # categories-1
2-sample (독립성 검정), DF = (#행 - 1)*(#열 - 1) -
scipy.stats.chi2_contingency
시행 결과값은 순서대로
1 : statistic 2 : p-value 3 : degree of freedom 4 : expected value for Observed
을 의미
*correction은 default로 True(자유도 = 1)