- 데이터 마이닝의 목적이 무엇긴가?
- 최적의 평가지표는 무엇인가?
-> Nevertheless, there are various common issues and themes in evaluation, and frameworks and techniques for dealing with them.
1. Evaluating Classifiers
How should we measure generalization performance of the model?
Bad Positive(해로운 양성) and Harmless Negative(무해한 음성) exist
1.1 Plain Accuracy and Its Problems
Accuracy = “Number of correct decision made” / “Total number of decision made”
=> Accuracy = 1 – “error rate”
Unfortunately, it is usually too simplistic for applications of data mining techniques to real business problems and has some well-known problems. (혼동행렬 필요성)
– Problems with unbalanced classes
– Problems with unequal costs and benefits
1.2 Confusion Matrix
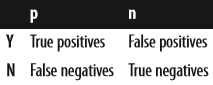
In the confusion matrix, the main diagonal contains the counts of correct decisions. The errors of the classifier are the false positive (negative instances predicted as positive) and false negative (positive instances predicted as negative)
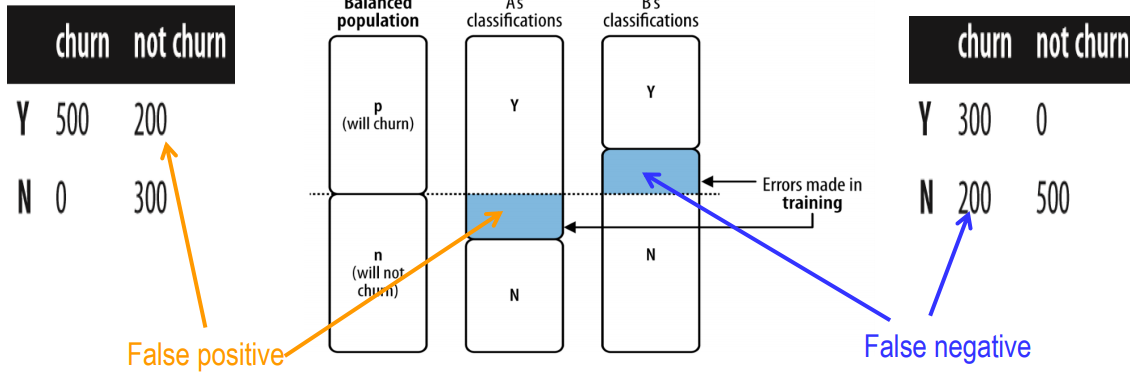
이 그림은 모델이 고객 이탈(churn) 여부를 예측할 때 발생하는 오류를 보여준다. 왼쪽 예시에선 실제로 이탈하지 않는 고객을 이탈한다고 잘못 예측하는 경우(오류)를 False Positive라고 한다. 오른쪽 예시에선 실제로 이탈할 고객을 이탈하지 않는다고 잘못 예측하는 경우를 False Negative라고 한다.
함정) If we simply classify everyone as negative we could achieve a base rate accuracy of 90%! 즉, 모두를 negative 라고 예측해도 accuracy는 90% 가 된다..
Costs of Churn Rate Models
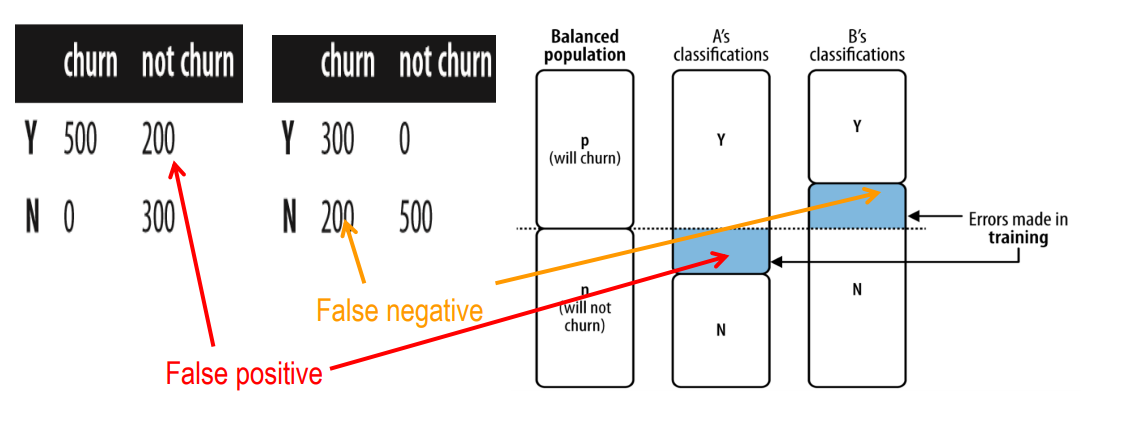
- The cost of giving a customer a retention incentive which still results in stay (a false positive).
- The cost of losing a customer because no incentive was offered (a false negative)
- Ideally, we should estimate the cost or benefit of each decision a classifier can make.
-> 그러니까 이탈한다고 예상했는데 떠나지 않는데 incentive 주니까 cost 가 늘어나는거고
이탈안한다고 에상했는데 떠나는 사람이라서 incentive를 주지 않음으로써 cost가 늘어나는 것!
2. A Key Analytical Framework: Expected Value
수식
- …
- is a possible decision outcome;
- is its probability(확률); and
- is its value(가치)
Remind
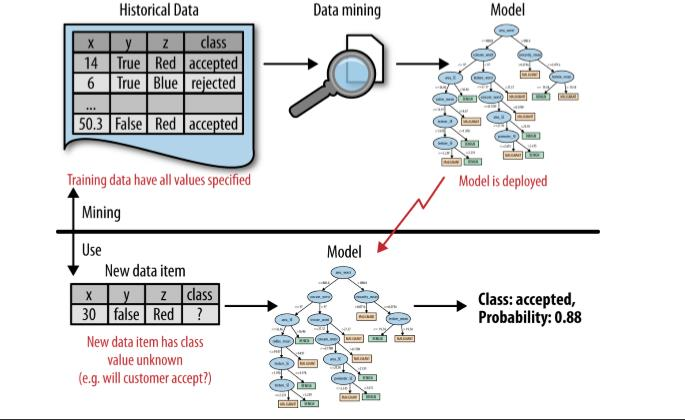
In mining phase, data mining produces the probability estimation model.
- The historical data have the target (“class”) value specified.
In use phase, the model is applied to a new, unseen case and it generates a probability estimate for it.
- New data item has class value unknown.
- The model predicts both the class value and the probability that the class variable will take on that value
3. Using Expected Value to Frame Classifier Use
Targeted Marketing에서의 기대 가치 (Expected Benefit) 계산 방법
Targeted Marketing에서는 고객별로 "반응할 가능성이 높은 고객(likely responder)"과 "반응할 가능성이 낮은 고객(not likely responder)"을 분류한 뒤, 반응 가능성이 높은 고객들을 타겟팅합니다.
상황 가정
- 제품은 오직 이 오퍼(offer)를 통해서만 구매할 수 있습니다.
- 만약 고객에게 오퍼를 제안하지 않으면, 해당 고객은 제품을 사지 않습니다.
주요 개념 정의
- : 고객 특성 벡터 를 가진 고객이 반응할 확률 (Estimated probability of response)
- : 반응하지 않을 확률 (Estimated probability of no response)
- : 고객이 반응할 때 얻는 가치(Value from response)
- : 고객이 반응하지 않을 때 얻는 가치(Value from no response)
기대 가치(EB, Expected Benefit) 공식
타겟팅 시 기대 가치:
확률 는 과거 데이터를 바탕으로 만든 예측 모델에서 얻습니다. 가치 는 비즈니스 이해 단계(가치 산정)에서 결정합니다.
비용 및 가치 설정 예제
- 마케팅 비용: 고객 1인당 $1
- 타겟팅하지 않을 경우: 고객은 절대 구매하지 않으므로 이익은 0.
즉, (비용만 발생) - 고객이 반응해 제품을 구매할 경우:
- 판매가격: $200
- 제품 관련 비용: $100
- 순이익: $200 - $100 = $100
- 마케팅 비용 $1 차감 후 순이익: $100 - $1 = $99
즉,
따라서:
여기서 이므로:
타겟팅의 기대 가치가 0보다 커야 타겟팅하는 것이 이득입니다:
즉, 반응 확률이 1%보다 높다면 타겟팅 하는 것이 기대 이익을 낼 수 있습니다.
=> We can use the expected value framework to determine the best decisions for each particular model, and then use the expected value to compare the models.
4. Expected profit
Expected profit =
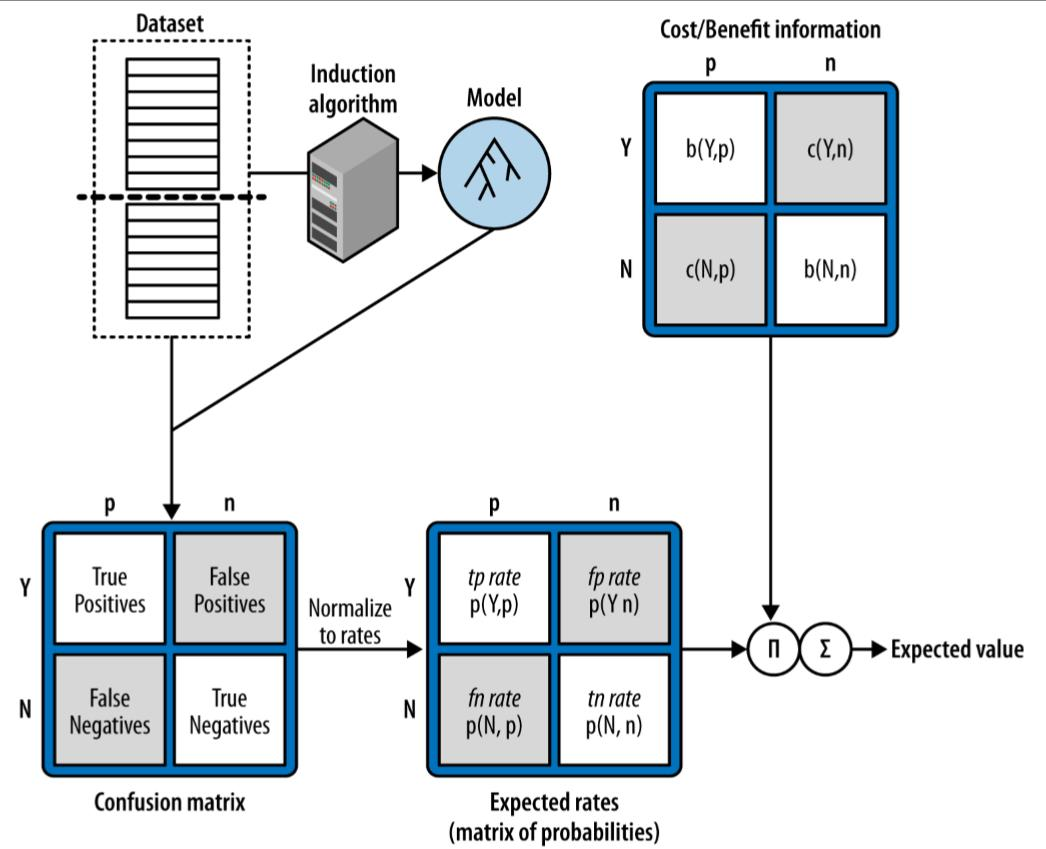
기대 가치(기대 이익)는 “각 결과가 발생할 확률 × 그 결과에서 얻는 이익(또는 손실)”을 모두 합한 값
4.1 예측 결과를 활용한 기대 이익(Expected Profit) 계산 예시
머신러닝 모델을 사용해 고객 반응 여부를 예측할 때, 모델의 성능을 단순 정확도뿐만 아니라 비즈니스적인 가치(이익/비용) 측면에서 평가할 수 있습니다. 이를 위해 “혼동 행렬(Confusion Matrix)”과 각 결과(참/거짓 양성, 참/거짓 음성)에 대응하는 비용/이익(Cost/Benefit) 정보를 결합해 기대 이익(Expected Profit)을 계산할 수 있습니다.
용어 정리
-
: 모델이 h(가설, 예측)한 결과와 실제 결과 a가 동시에 일어날 확률
-
b(h, a): 특정 예측(h)과 실제 결과(a)에 따른 이익(또는 비용)
예시 상황
- 총 고객 수: 110명
- 모델 예측 결과와 실제 반응을 기반으로 혼동행렬을 확률로 변환:
- True Positive (Y,p): p(Y,p) = 56/110
b(Y,p) = 99 달러 - False Positive (Y,n): p(Y,n) = 7/110
b(Y,n) = -1 달러 - False Negative (N,p): p(N,p) = 5/110
b(N,p) = 0 달러 - True Negative (N,n): p(N,n) = 42/110
b(N,n) = 0 달러
- True Positive (Y,p): p(Y,p) = 56/110
기대 이익 공식
여기서 p(h, a)는 혼동행렬을 통해 얻은 확률이고, b(h, a)는 각 결과별 이익/비용을 나타냅니다.
이러한 방식으로 예측 모델의 결과를 비즈니스적 가치와 결합하면, 단순한 예측 정확도를 넘어 실제 활용 가능한 의사결정 지표를 얻을 수 있습니다.
5. Evaluation Metrics
| 실제 Positive (P) | 실제 Negative (N) | 합계 | |
|---|---|---|---|
| 예측 Positive(Y) | TP | FP | TP+FP(Yes) |
| 예측 Negative(N) | FN | TN | TN+FN(No) |
| 합계 | P = TP+FN | N = TN+FP | Total |
- TPR(민감도, 재현율) = TP / P
- FNR = FN / P
- FPR(오보율) = FP / N
- TNR(특이도) = TN / N
- Precision(정밀도) = TP / (TP+FP)
- Accuracy(정확도) = (TP+TN) / Total
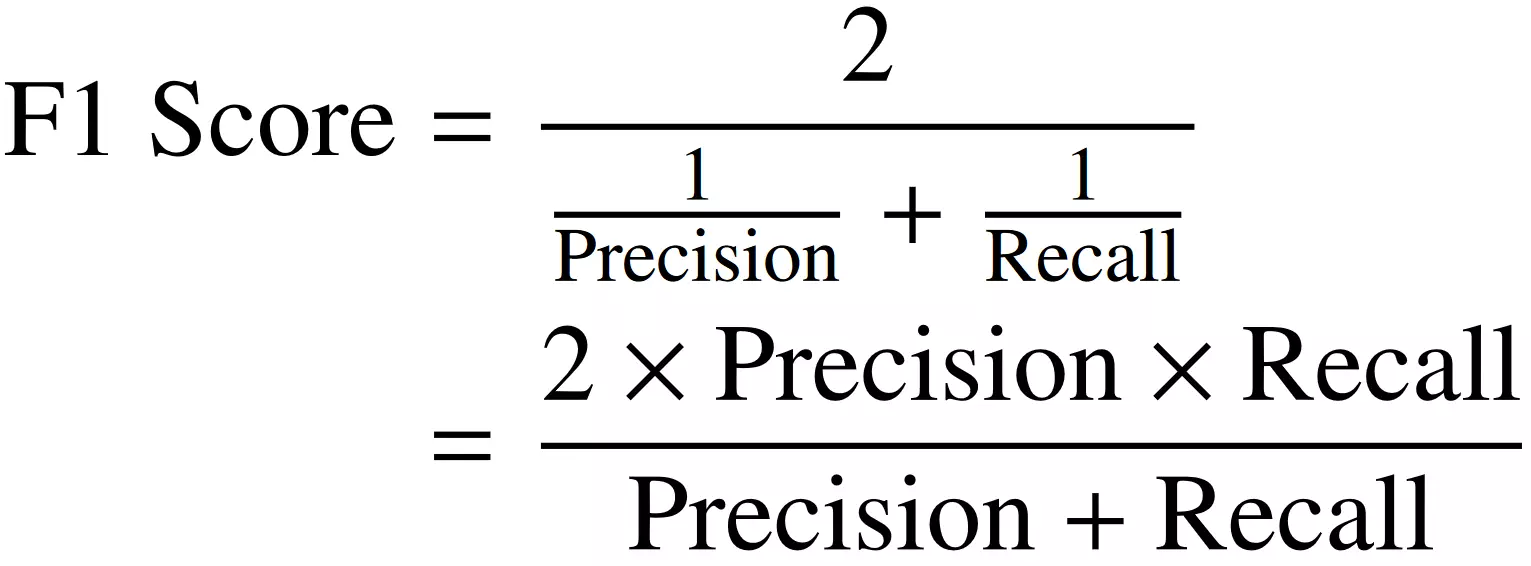
- F-measure = 2 (Precision Recall) / (Precision + Recall)
주요 지표 정의
| 지표 | 수식 | 의미 |
|---|---|---|
| True Positive Rate (TPR) | TPR = TP / P | 실제 양성 중 양성으로 정확히 예측한 비율 (민감도, 재현율) |
| False Negative Rate (FNR) | FNR = FN / P | 실제 양성 중 음성으로 잘못 예측한 비율 |
| False Positive Rate (FPR) | FPR = FP / N | 실제 음성 중 양성으로 잘못 예측한 비율 (오보율) |
| True Negative Rate (TNR) | TNR = TN / N | 실제 음성 중 음성으로 정확히 예측한 비율 (특이도) |
| Recall(재현율) = TPR | Recall = TP / P | 실제 양성 중 양성으로 맞춘 비율 (민감도) |
| Precision(정밀도) | Precision = TP / (TP+FP) | 양성 예측 중 실제 양성 비율 |
| Specificity(특이도) = TNR | Specificity = TN / N | 실제 음성 중 음성으로 맞춘 비율 |
| Accuracy(정확도) | Accuracy = (TP+TN)/Total | 전체 중 맞게 예측한 비율 |
| F-measure(F1-score) | F = 2(PrecisionRecall)/(Precision+Recall) | 정밀도와 재현율의 조화 평균 |
6. Alternative Calculation
Alternative Calculation은 모델 성능을 클래스 사전확률과 결합하여 상황이 변해도 쉽게 기대 이익을 재계산할 수 있는 방법을 제시
=
= • (the expected profit from the positive examples)+ •(the expected profit from the negative examples)
즉, 와 을 알고 있다면(사전확률) 나머지는 조건부 확률을 이용하여 구할 수 있다는 말이다.
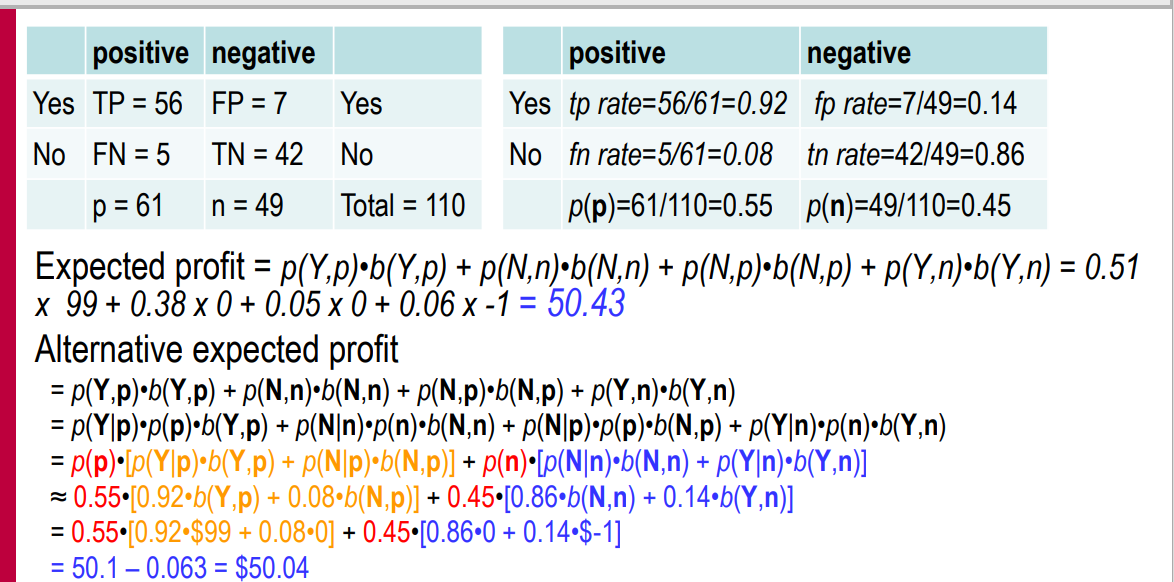
즉, alternative calculation(대안 계산 방식)은 모델 성능과 클래스 비율을 분리해서 생각할 수 있게 해줍니다. 데이터셋 변화나 클래스 분포가 달라지더라도, 우리가 모델 성능을 나타내는 조건부 확률과 사전확률을 알고 있다면 새로운 상황에서의 기대 이익을 쉽게 계산할 수 있습니다.
7. Evaluation, Baseline Performance, and Implications for Investments in Data
What would be a reasonable baseline against which to compare model performance?
➔ Each model should perform considerably better than random guessing.
-
For classification tasks, one good baseline is the majority classifier, a naïve classifier that always chooses the majority class of the training dataset.
-
For regression problems, one baseline is to predict the average value over the population (usually the mean or median).
Data mining should add significant value beyond baseline.
8. Summary
- A vital part of data science is arranging for proper evaluation of models.
- The expected value calculation is a good framework for proper evaluation of models.
- To calculate the overall expected value of a model, the costs and benefits of decisions must be specified.
- Different data sources may have different associated costs, and careful evaluation may show which can be chosen to maximize the return on investment.
즉, 단순히 모델의 정확도나 정밀도 같은 성능 지표만 보는 것이 아니라, 실제 비즈니스 상황에서 어떤 의사결정을 내렸을 때 발생하는 비용과 이익을 수치화하고 이를 기대값 형태로 계산해야 한다는 것입니다.
이를 통해 데이터를 활용한 비즈니스 의사결정 시 비용 대비 이익을 합리적으로 고려하고, 투자 대비 최대한의 수익을 얻을 수 있는 방향으로 모델과 데이터 소스를 선택하라는 뜻