프로메테우슨느 파일을 저장하기 때문에 스토리지 용량을 추가하는 것을 권장한다.
apt update & essential build 상태는 설치전에 항상 확인한다.
sudo apt update
sudo apt install build-essential -y
2.1.1 다운로드
실습에서는 2.40.6 버전의 linux amd64 버전을 쓴다.
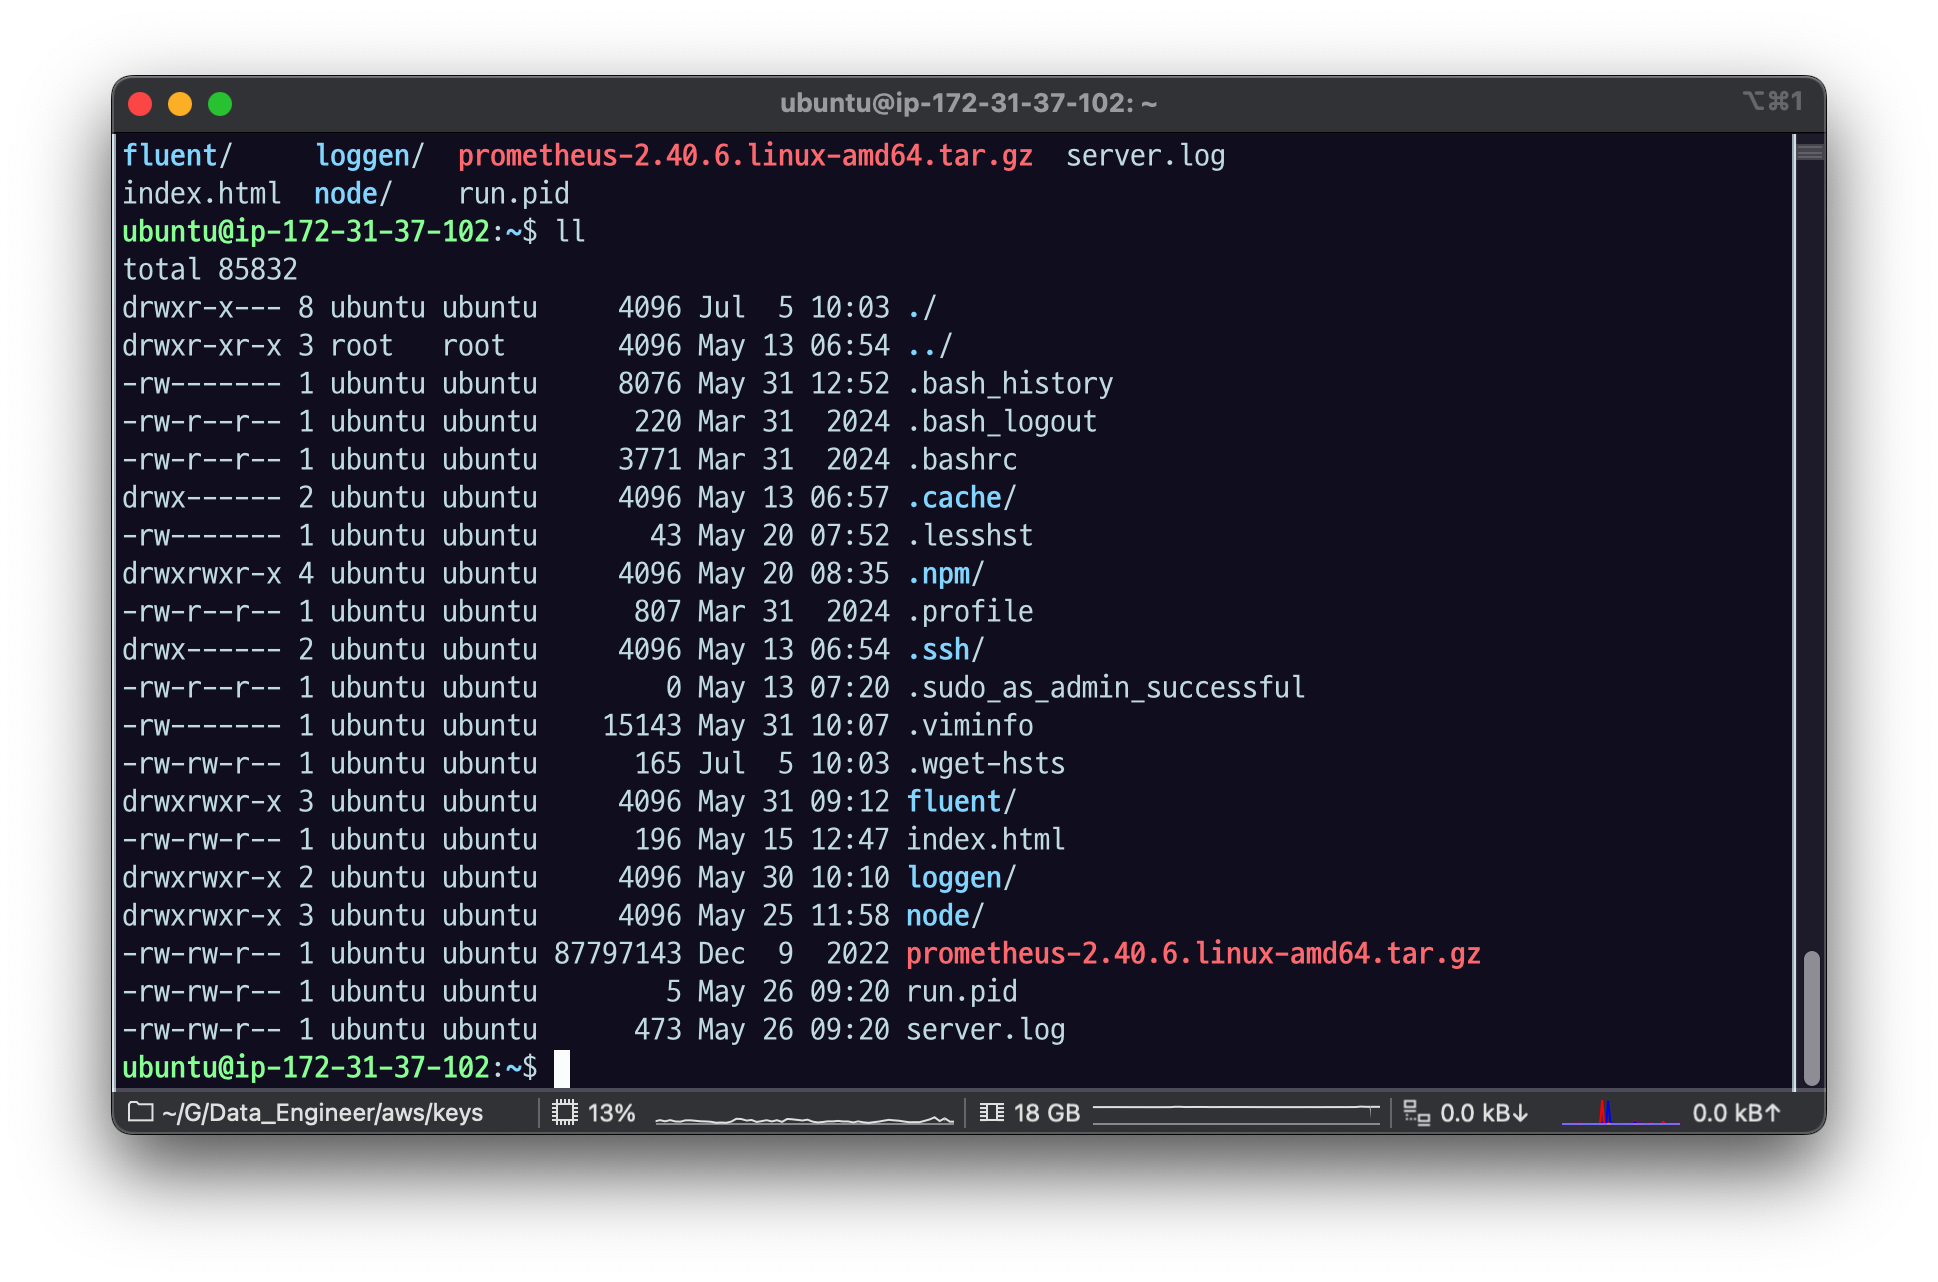
wget https://github.com/prometheus/prometheus/releases/download/v2.40.6/prometheus-2.40.6.linux-amd64.tar.gz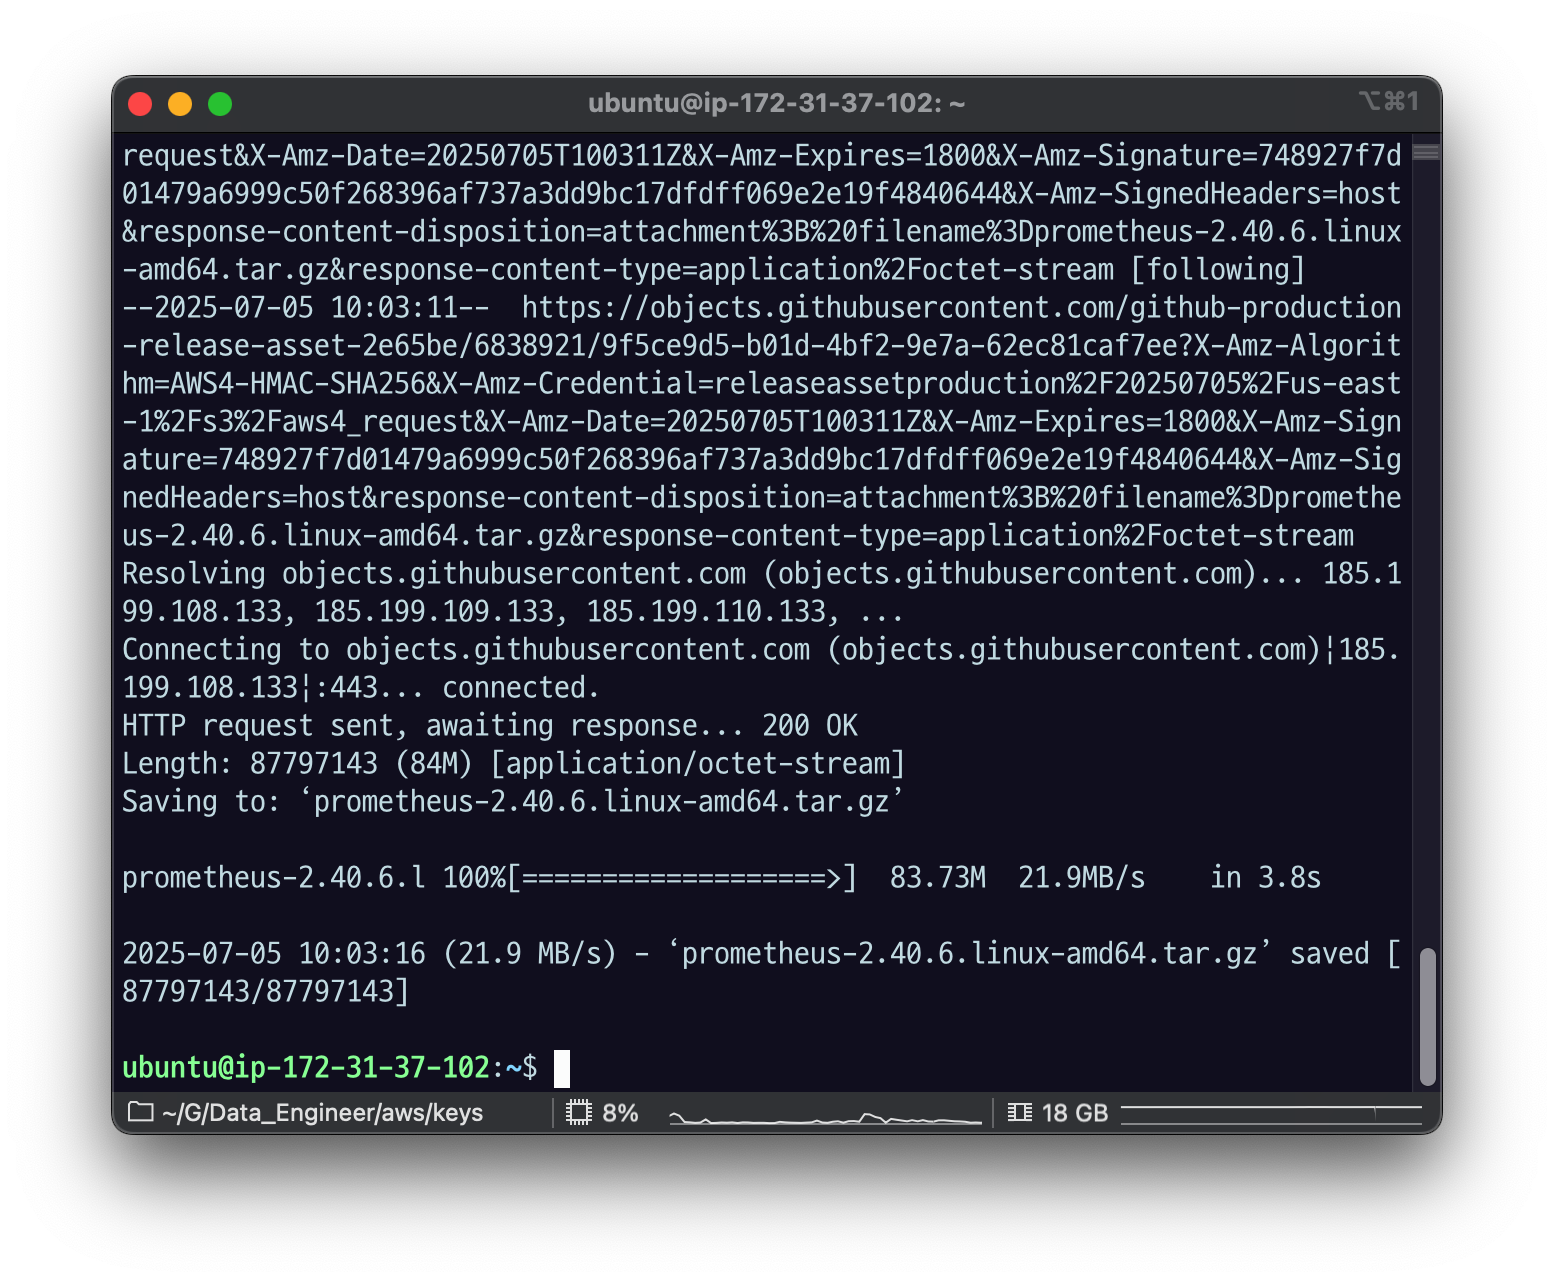
2.1.2 설치
설치
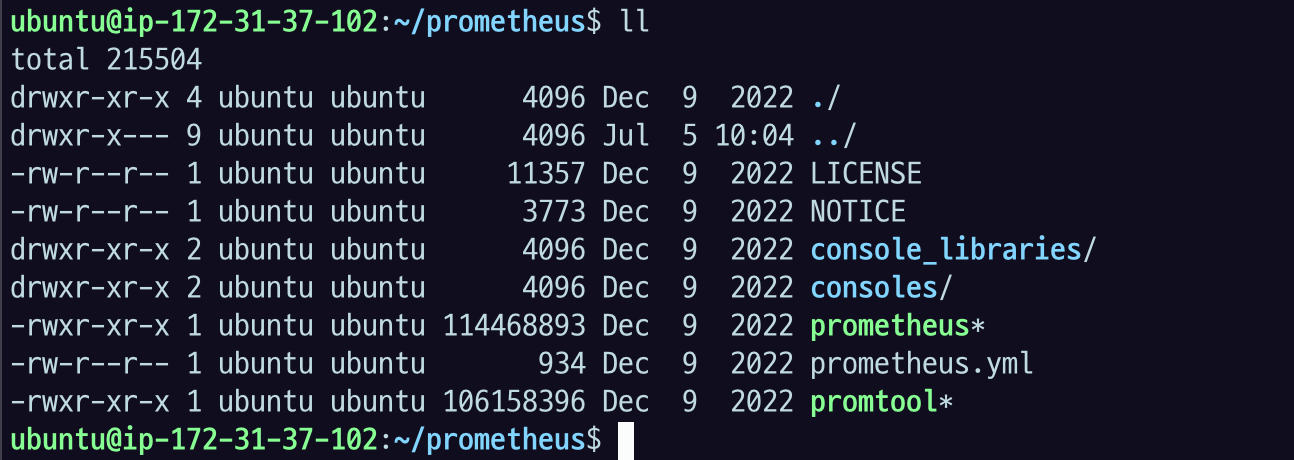
tar xvfz prometheus-*.tar.gz
mv prometheus-2.40.6.linux-amd64 prometheus
cd prometheus
export PROMETHEUS_HOME=$(pwd)
2.1.3 실행
기본 설치된 prometheus.yml 을 이용해서 실행한다.
./prometheus --config.file=prometheus.yml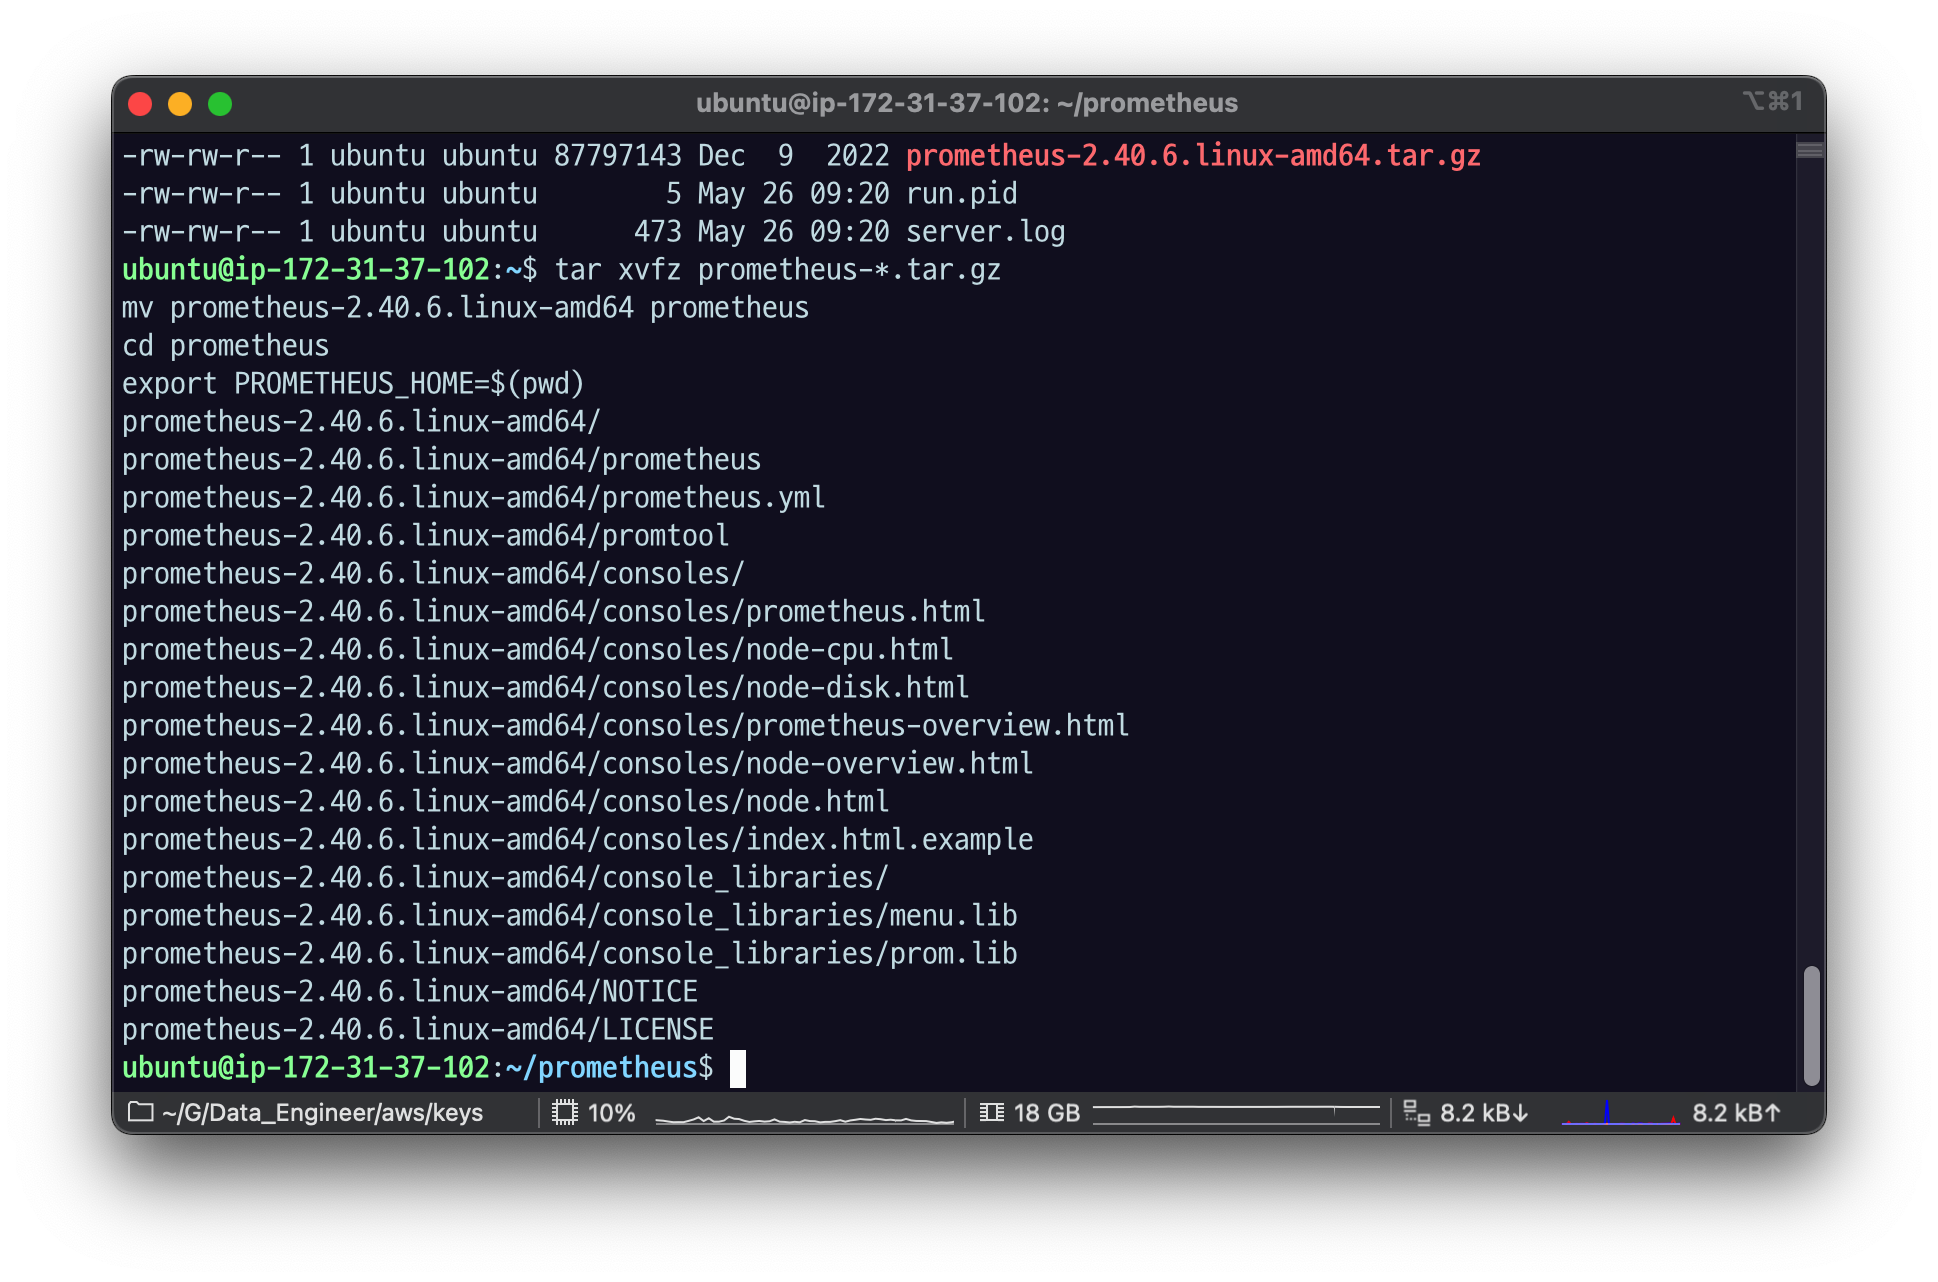
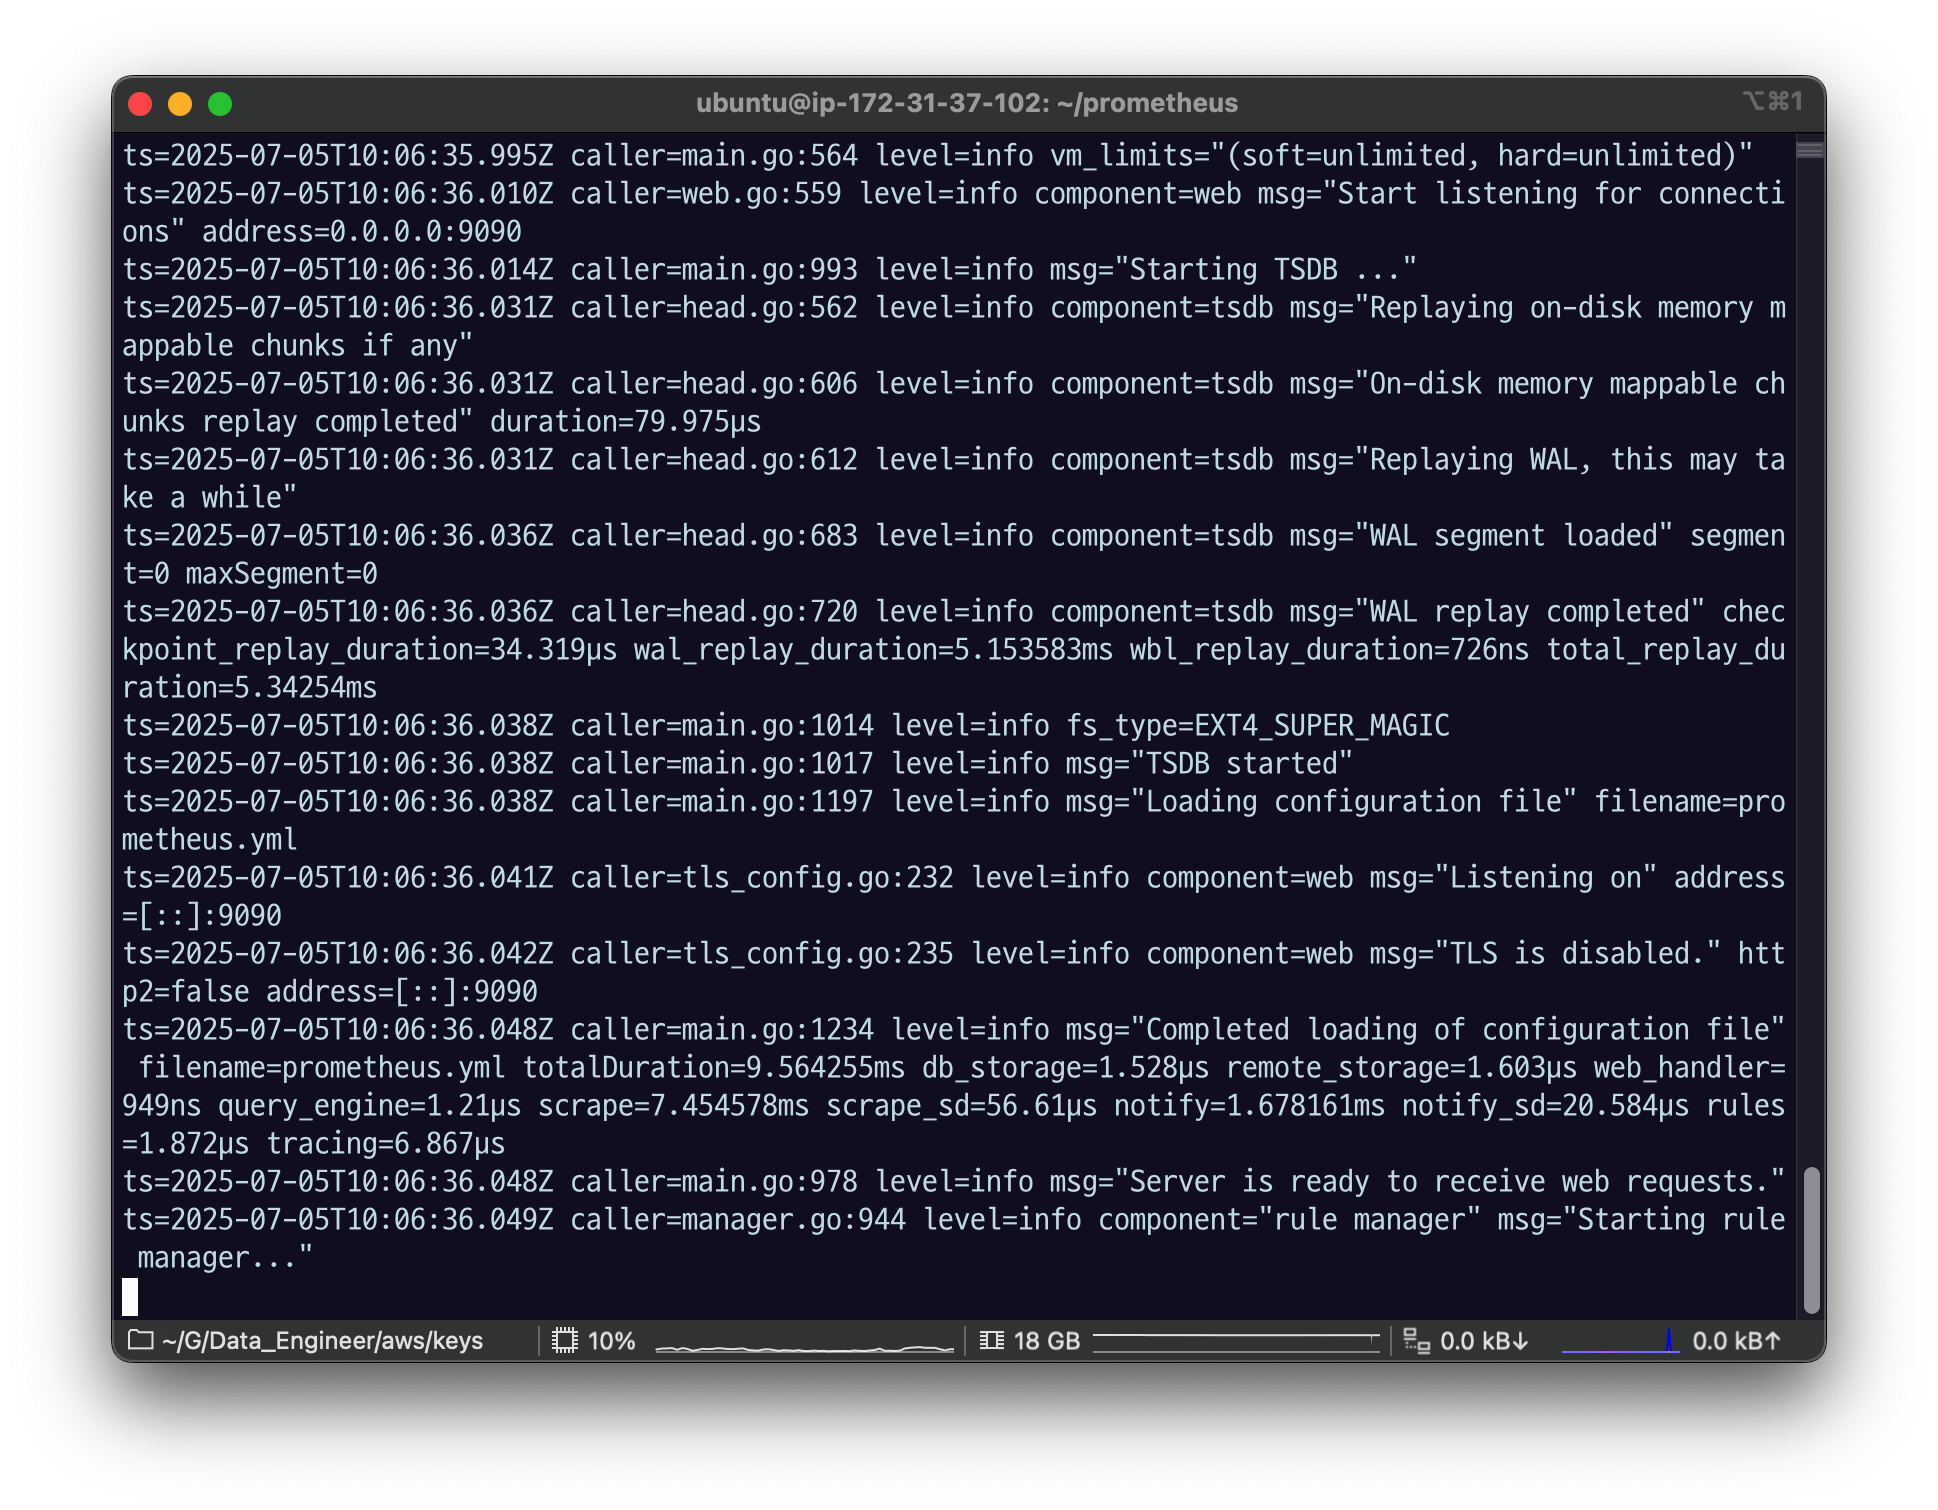
TSDB started, 로그가 나오면서 마지막에 starting rule manager.. 가 나오면 잘 실행 된 것.
2.1.4 확인
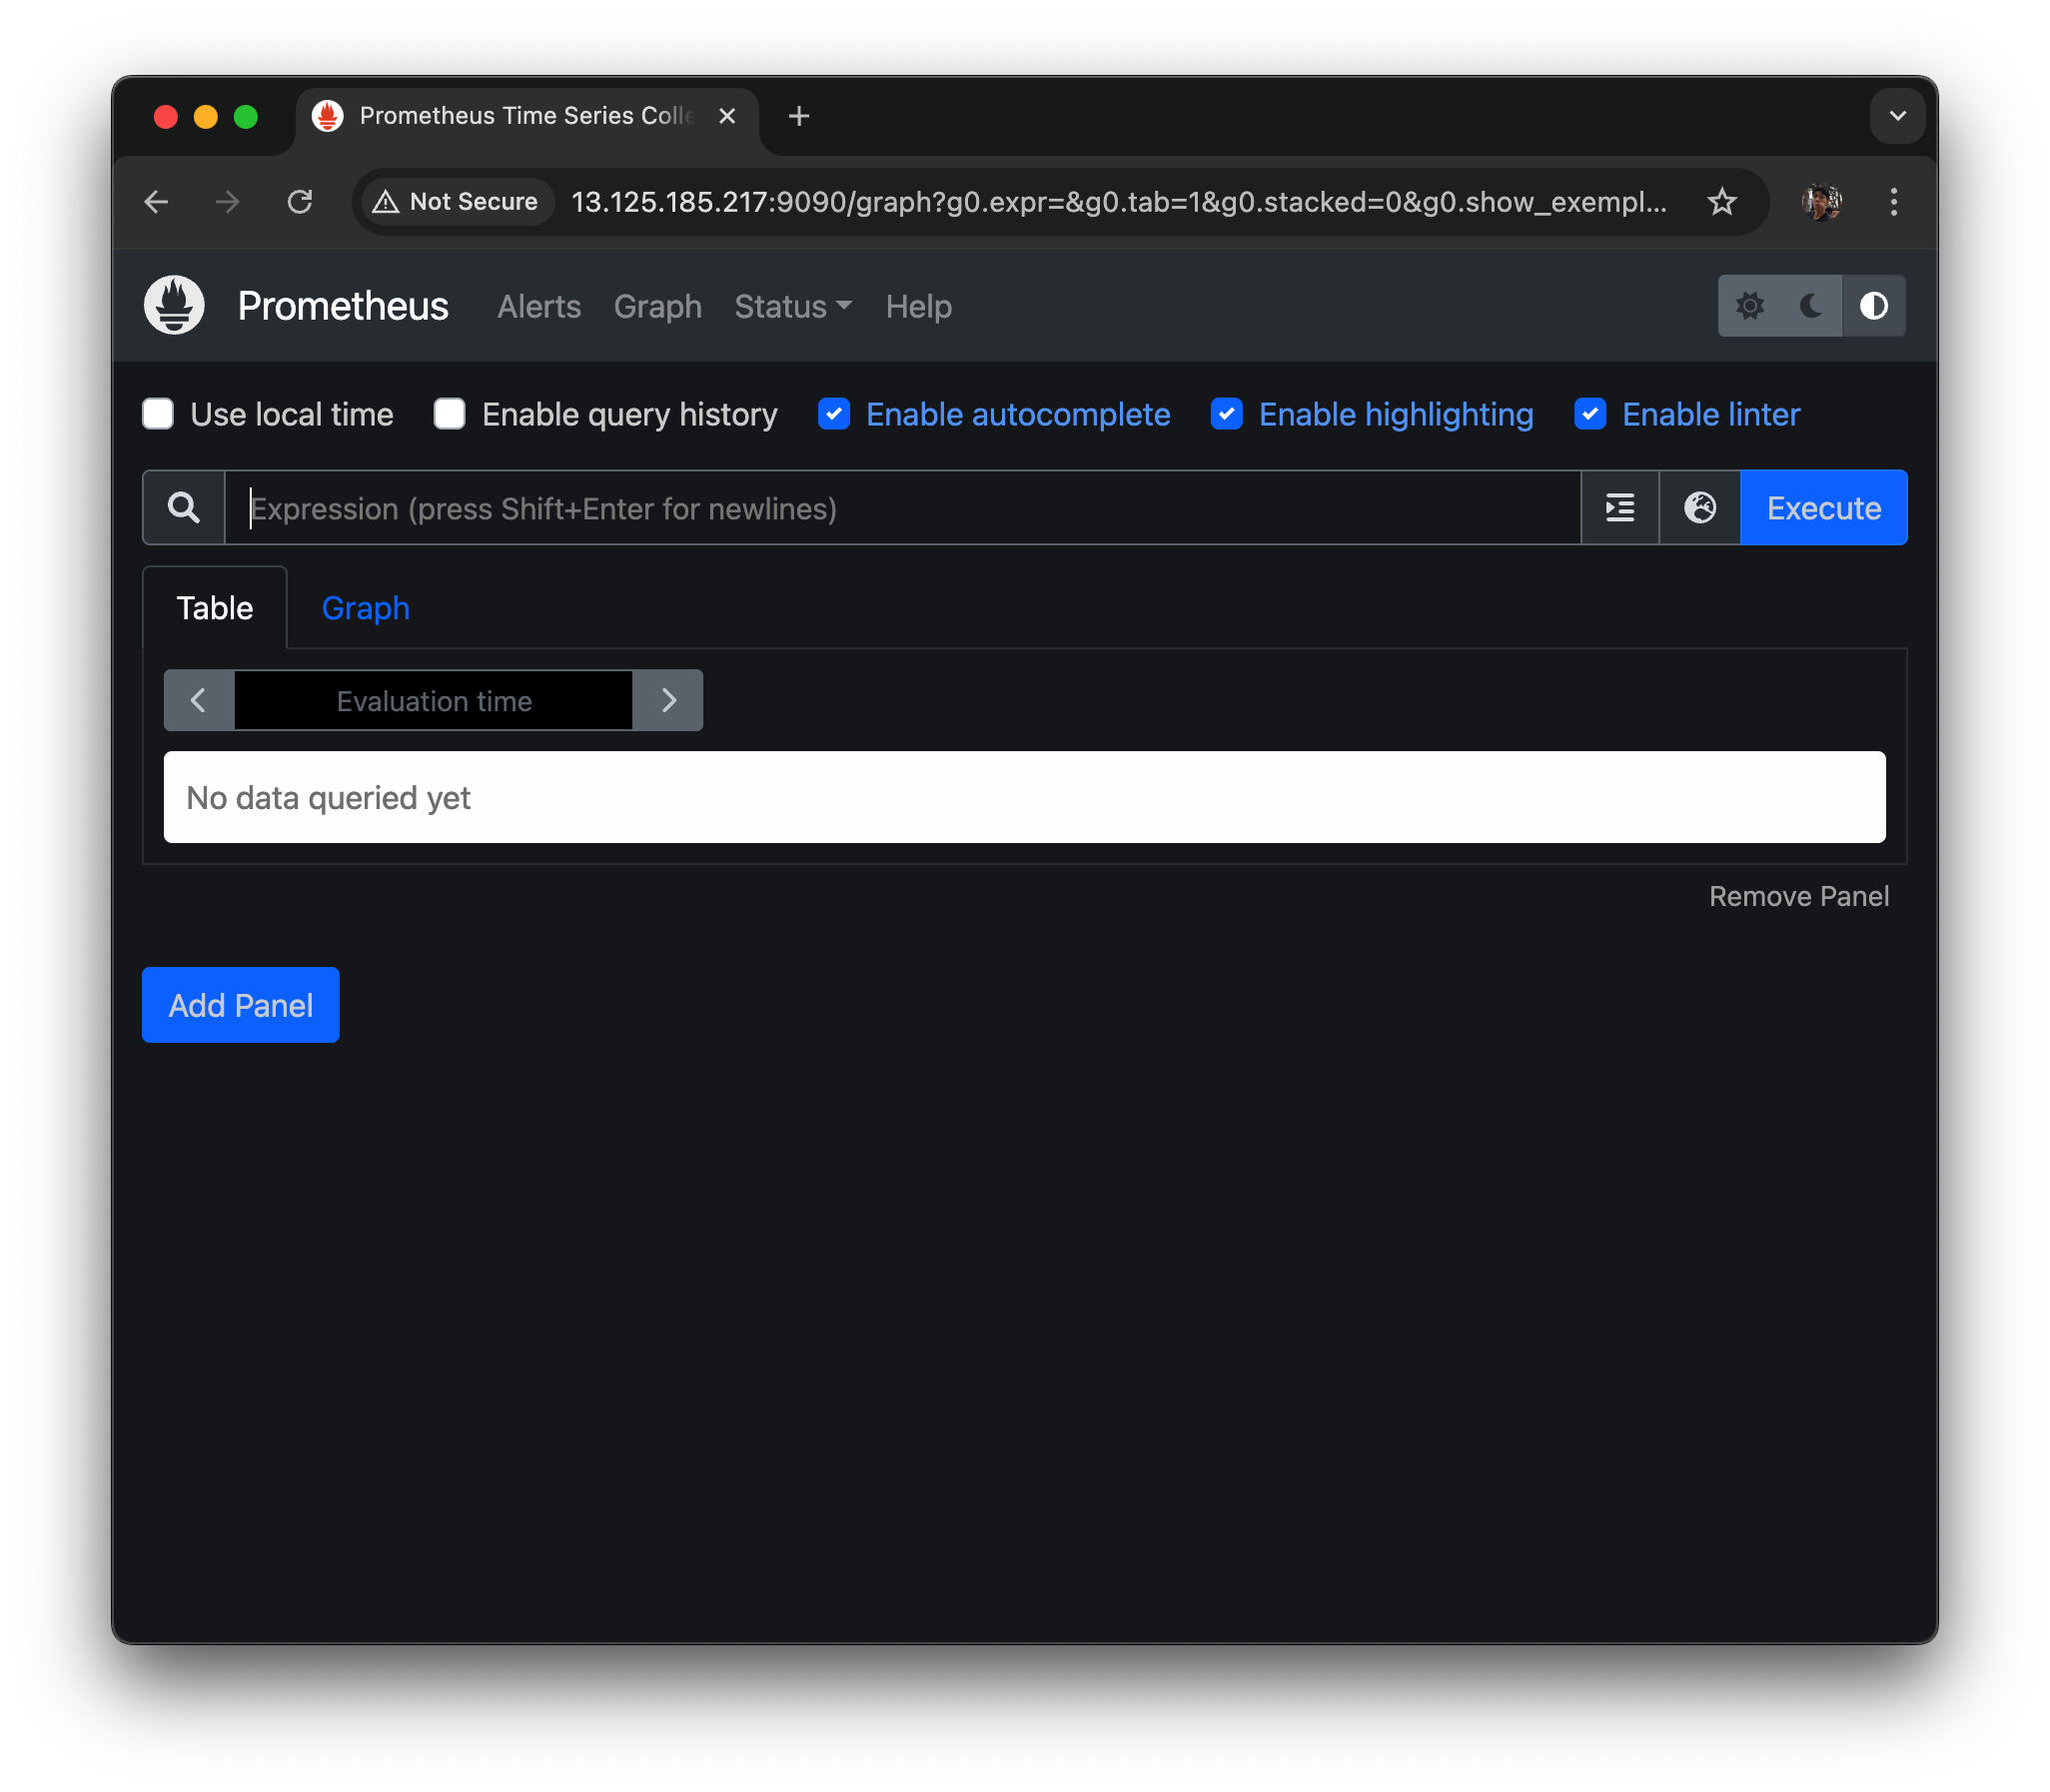
브라우저에 와서 내 주소에 기본 포트인 9090 쳐서 들어가보자.
- prometheus 가 자기자신의 데이터를
localhost:9090/metrics로 노출한다.
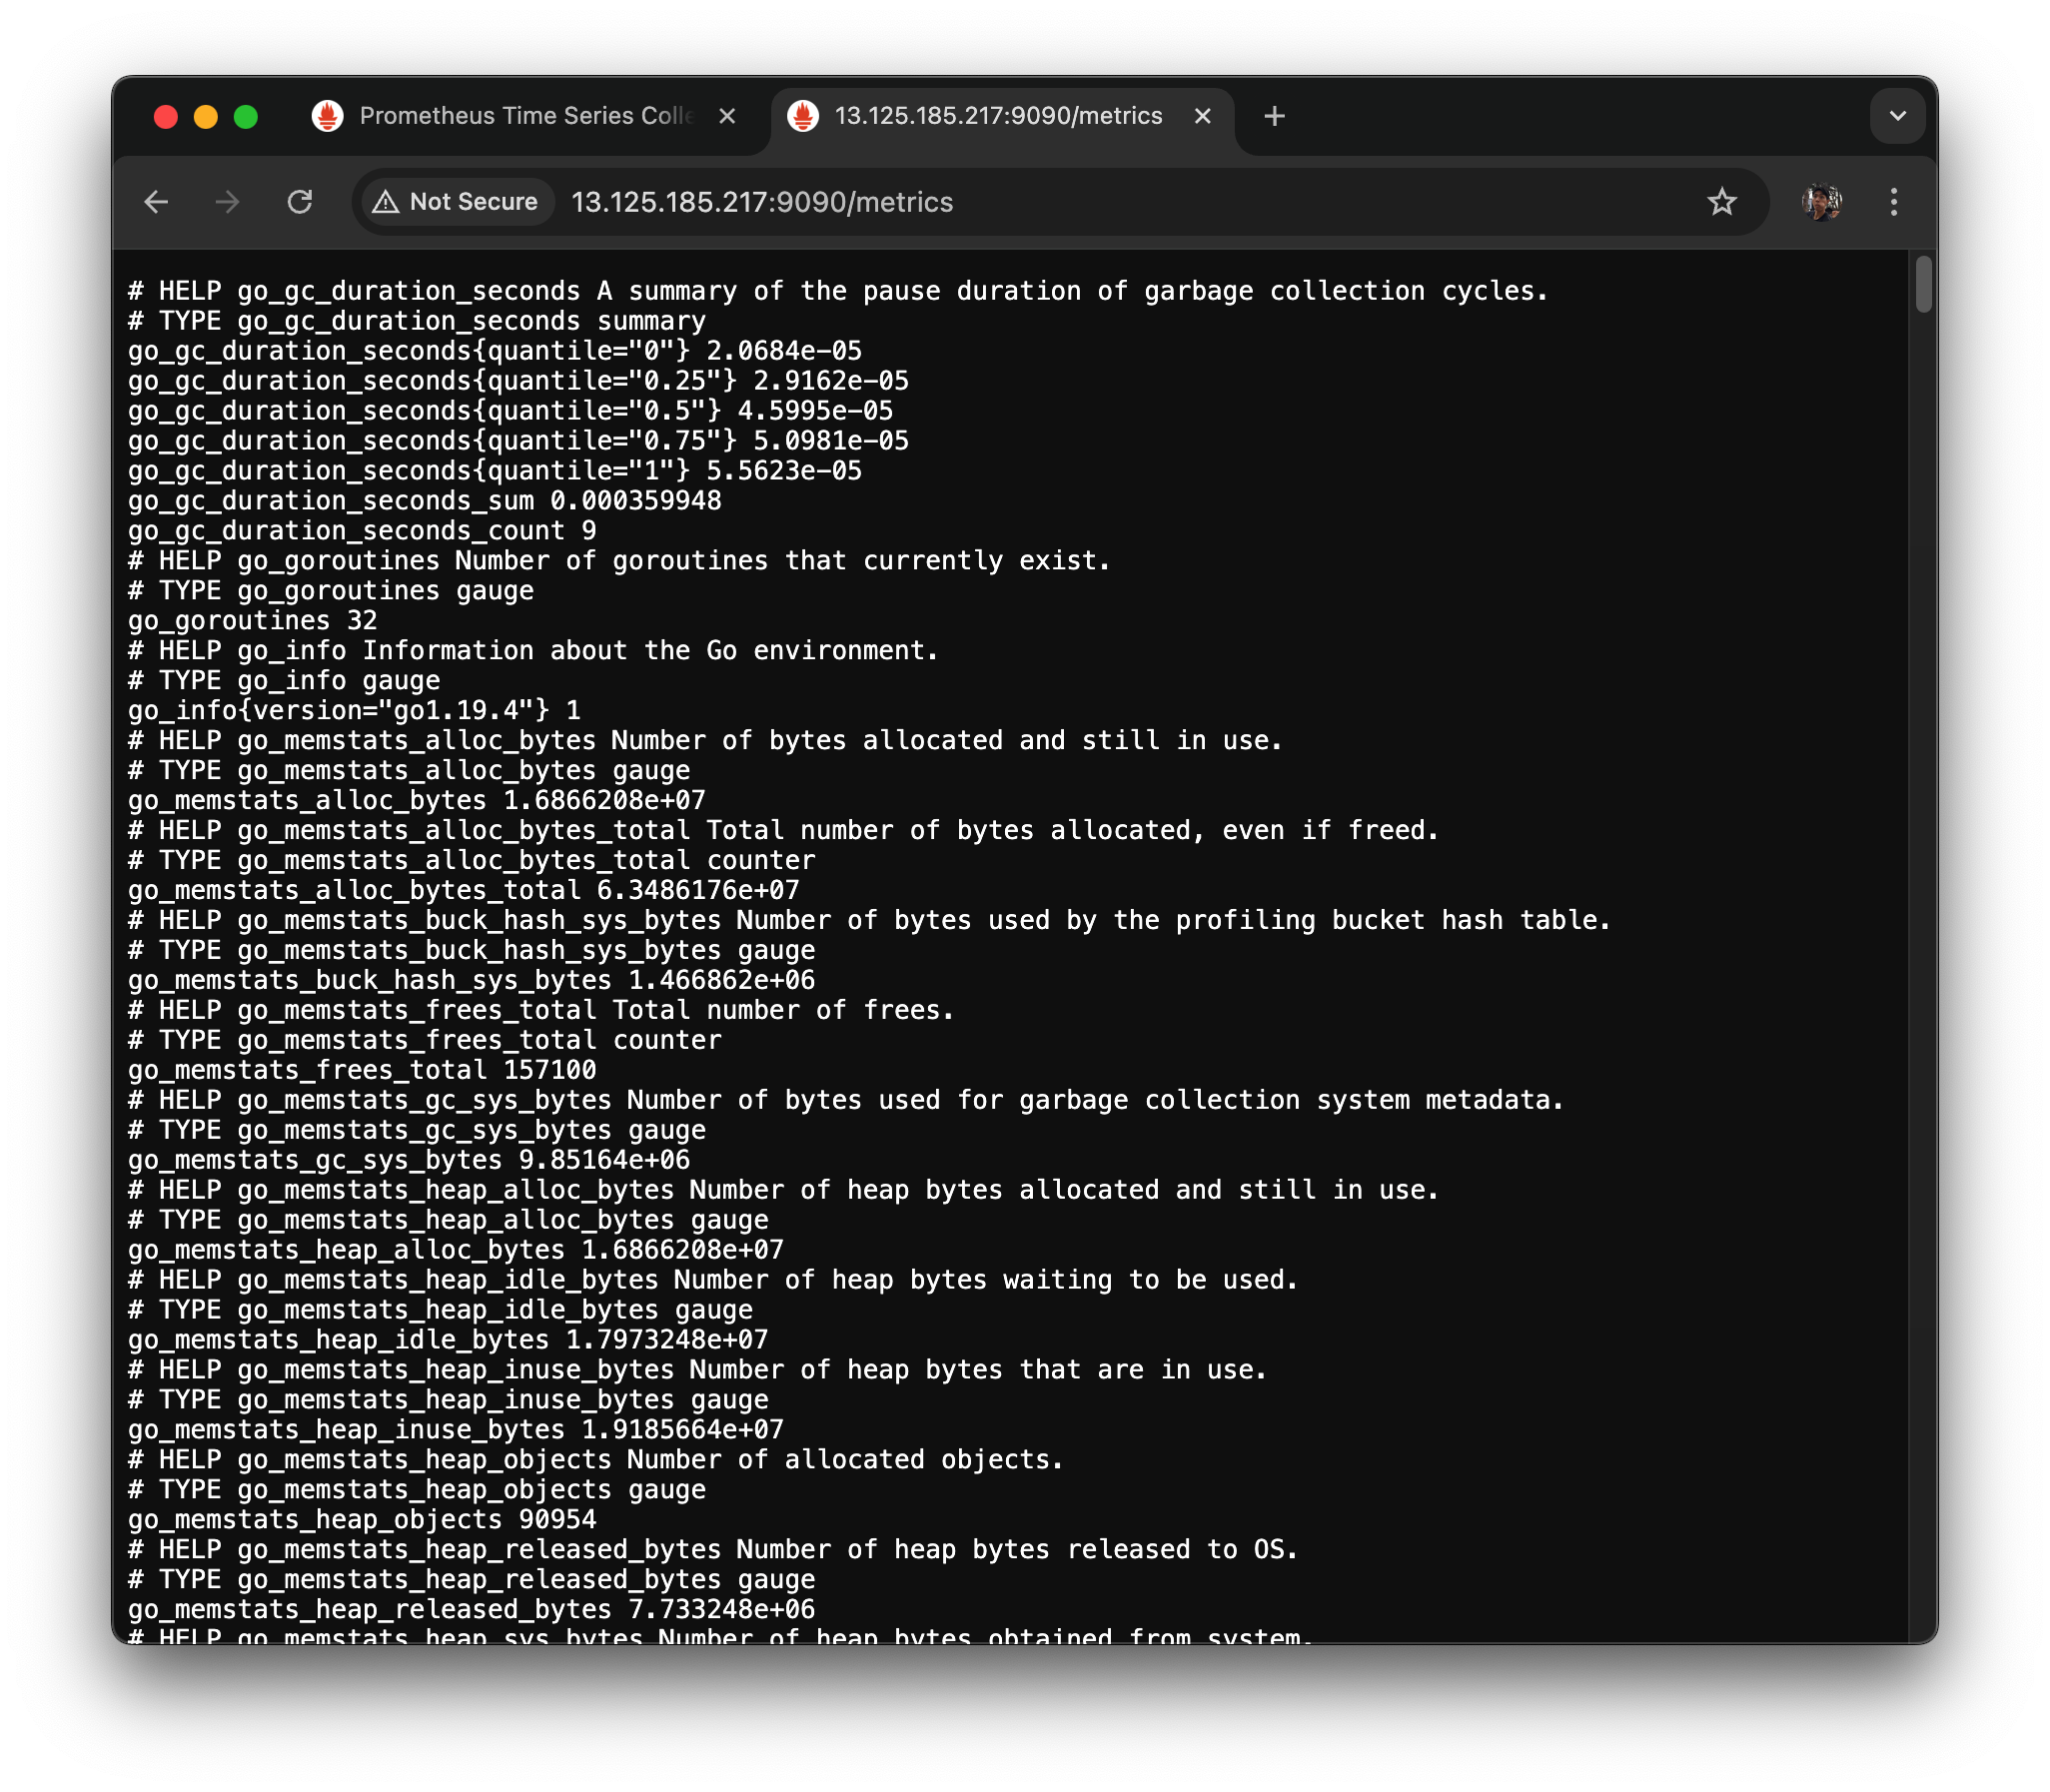
go lang 으로 만들어져 있는데
여기 에 있는 매트릭들이 자기 자신이 수집을 한다.
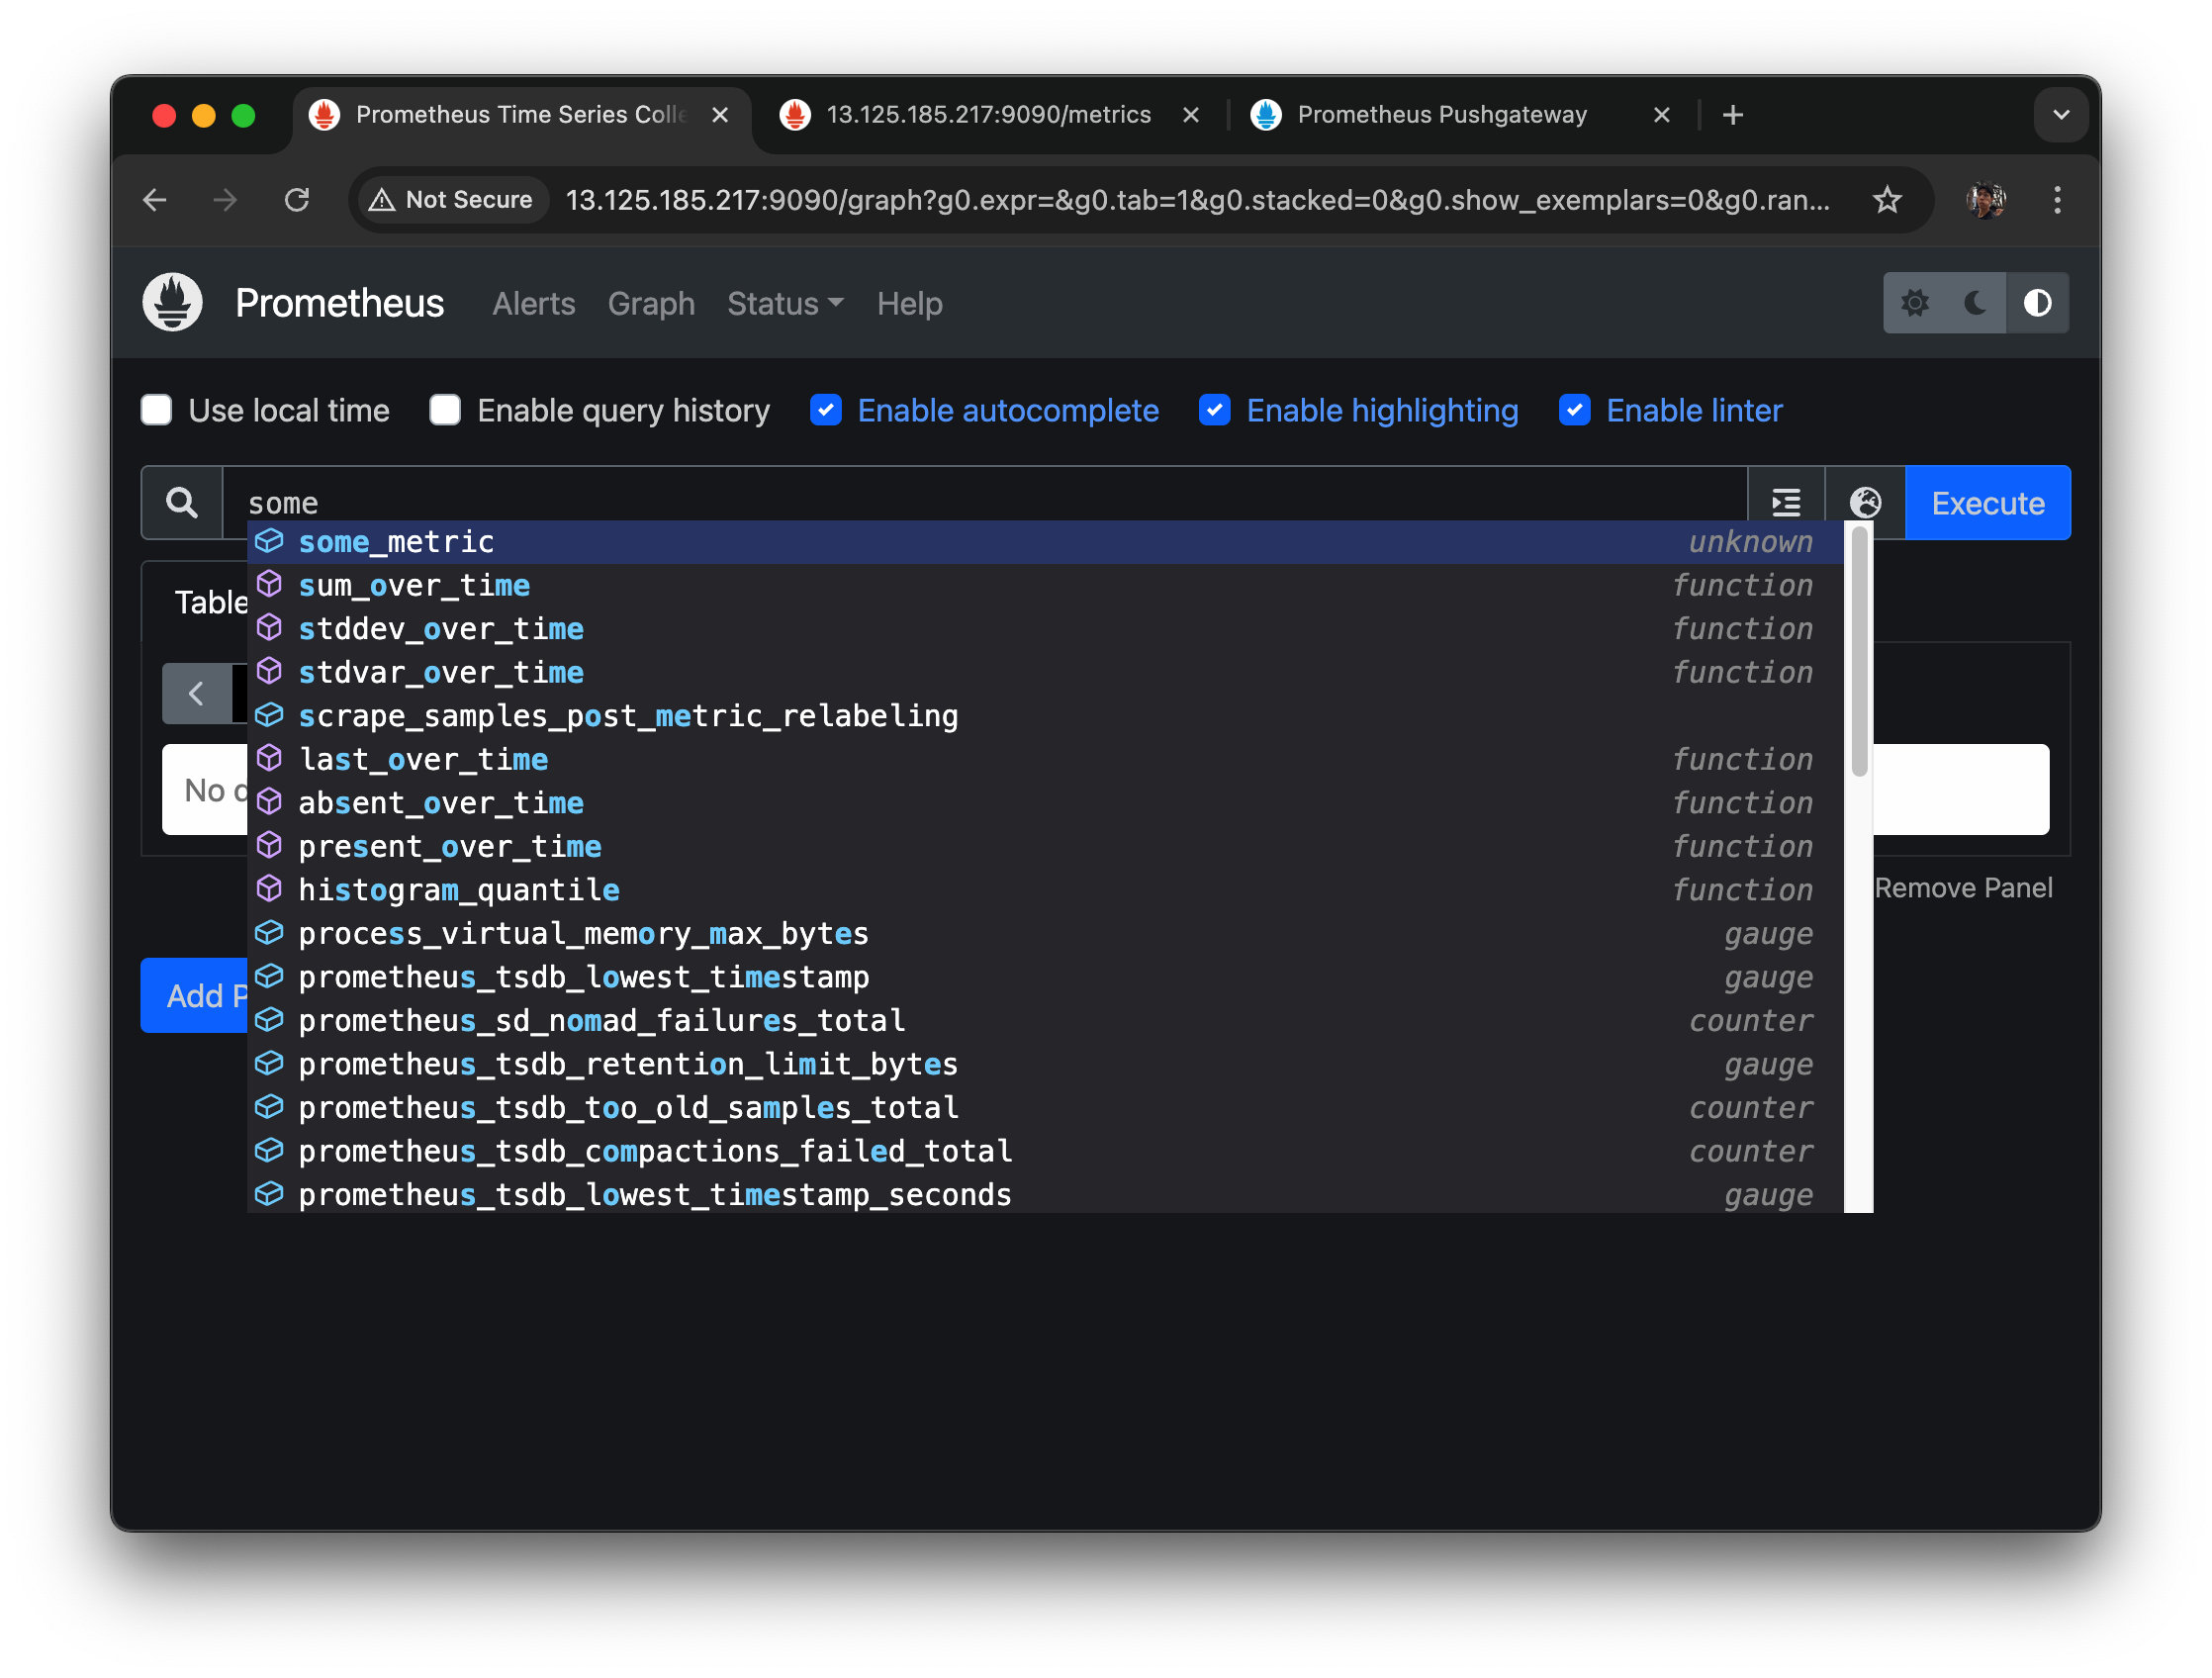
아까 GUI로 돌아가서
go_memstats_alloc_bytes metric을 검색해보면
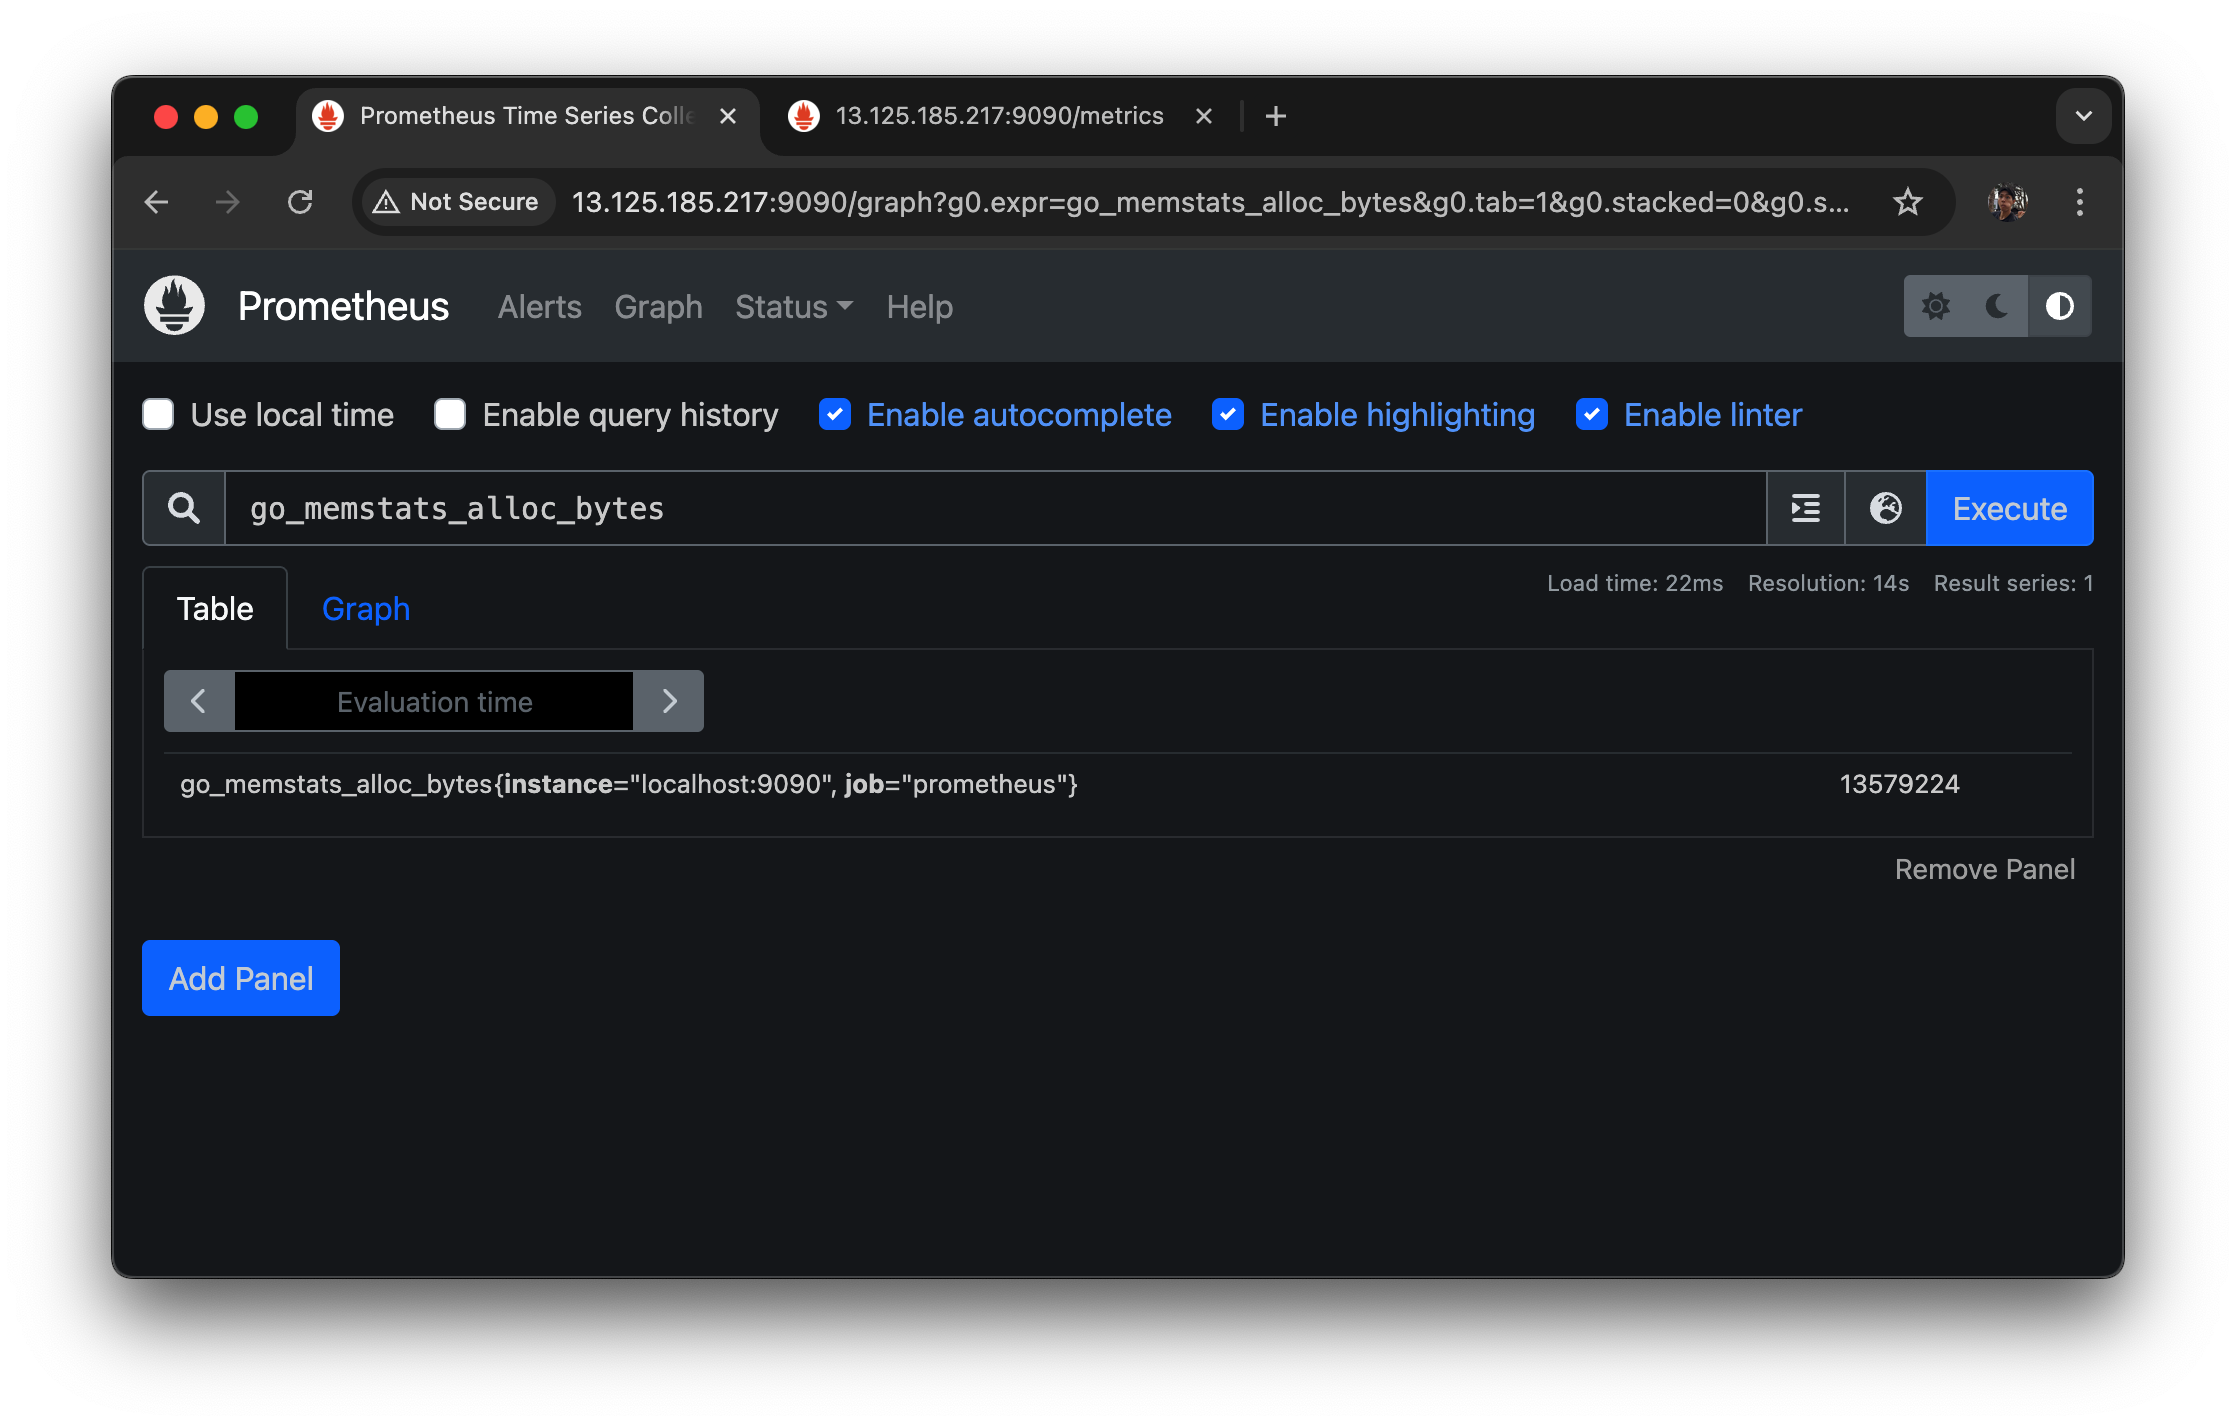
이 메트릭이 이렇게 수집 됐다.
인스턴스는 뭐고, job 은 프로메테우스다.
이런 식으로 수집이 되어 있다.
이 정보는 어떻게 남냐를 확인해보자.
다시 인스턴스로 돌아와서,
ctrl+C로 중지해주고,
vi prometheus.yml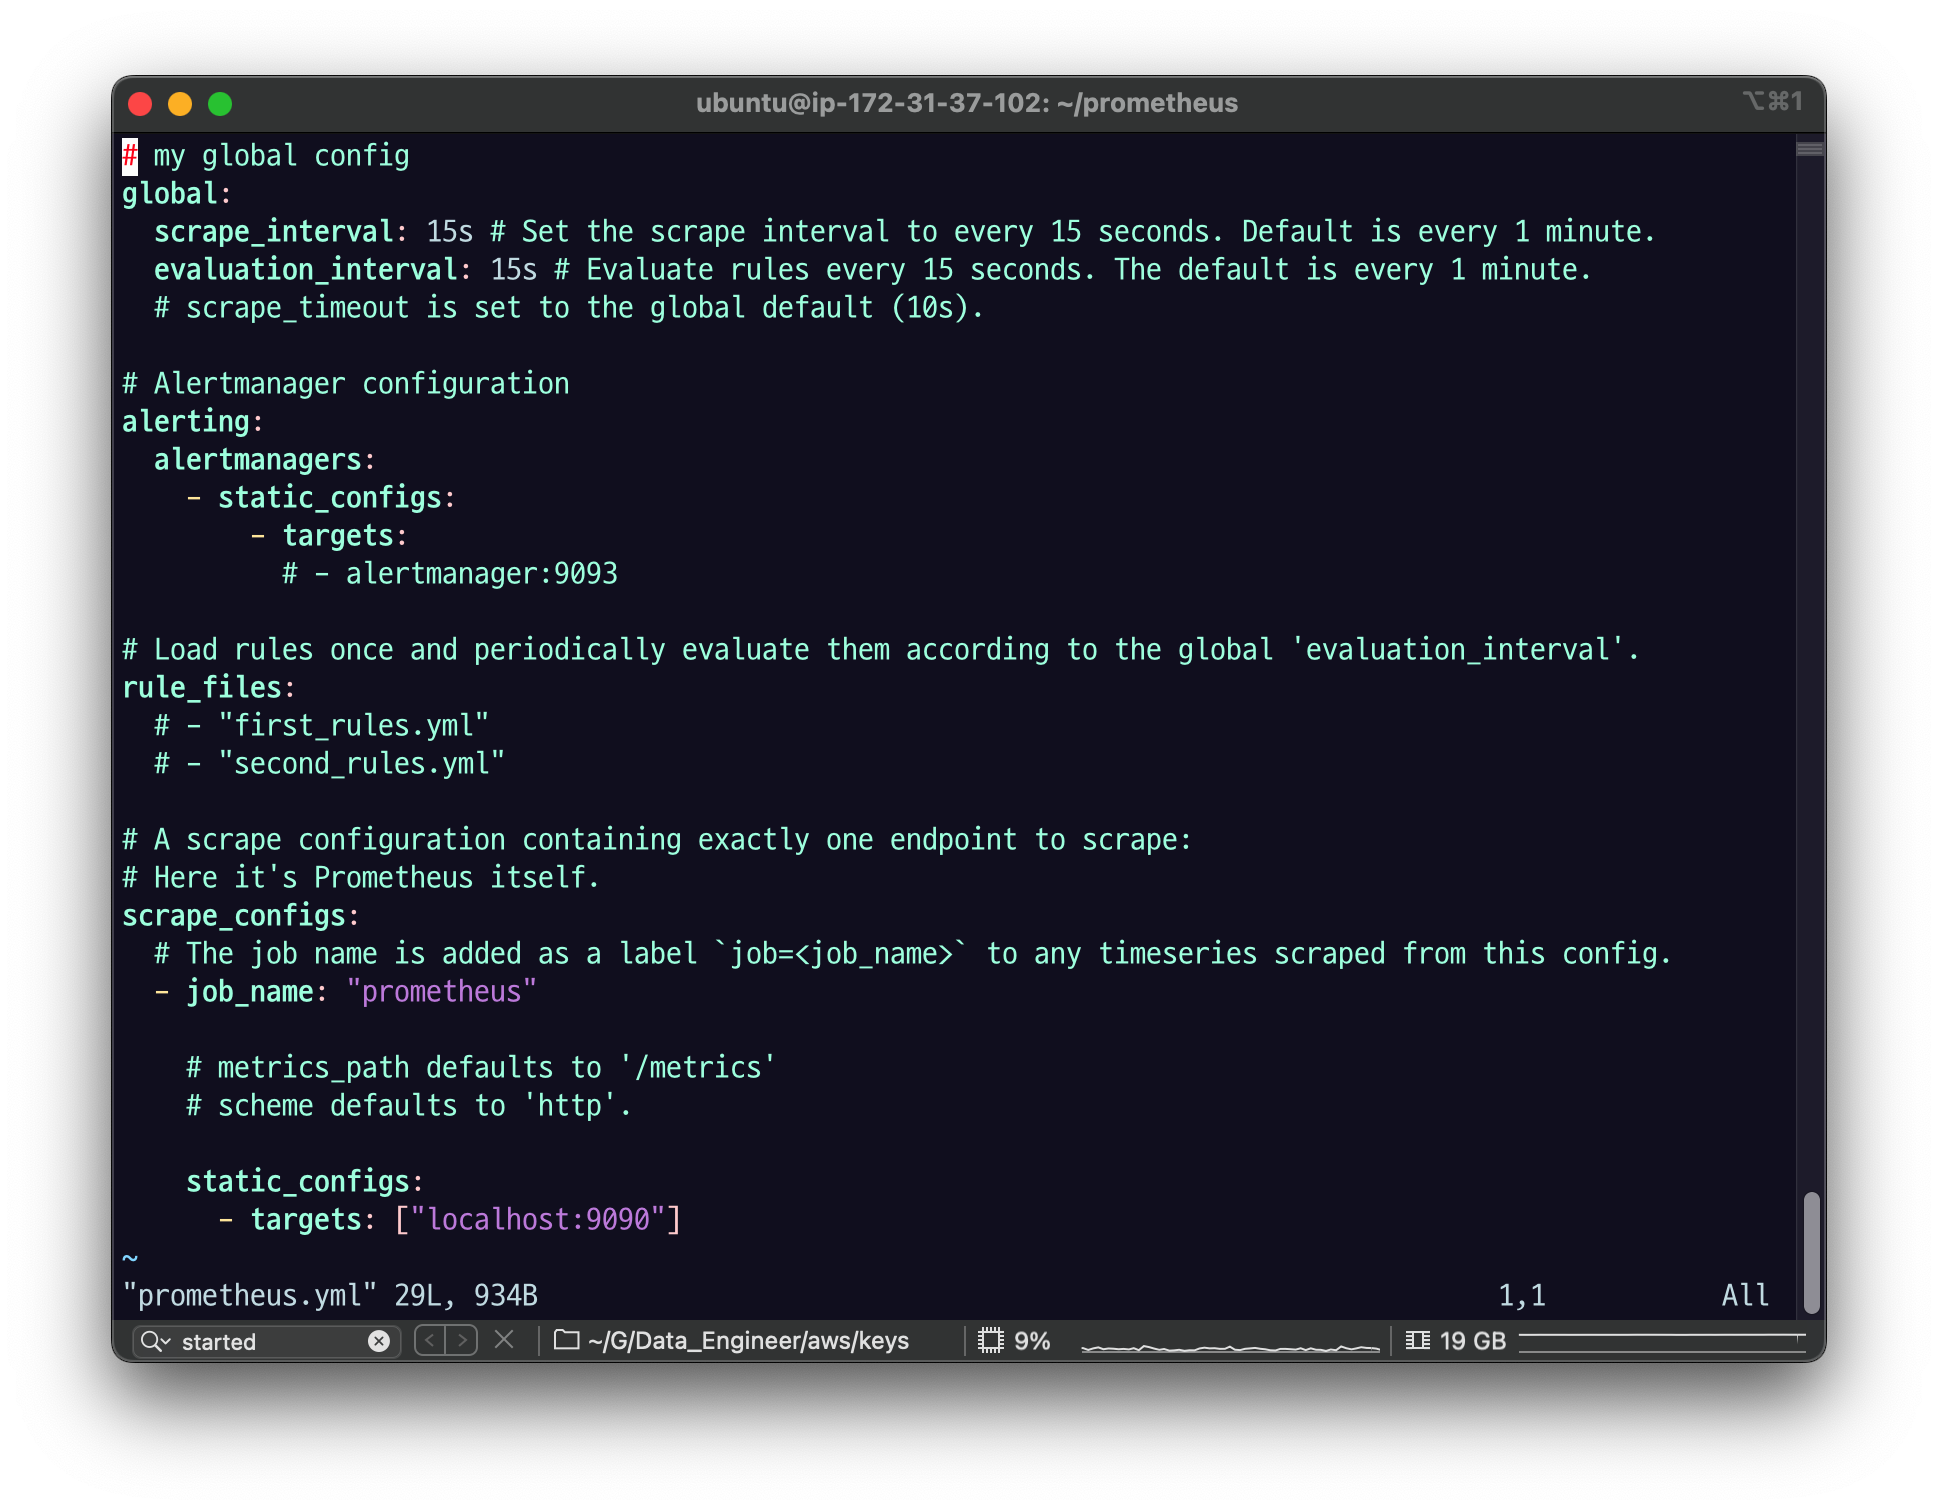
프로메테우는 주기적으로 폴링하고 스크랩 한다고 했는데
global: scrape_interval : 15s
폴링 스크랩을 15초 단위로 하겠다는 것
evaluation_interval : 15s
모든 룰을 15초 마다 확인하겠다, 룰 변경 사항이 있으면 갱신하겠다.
룰은 prometheus.yml 에 설정할 수도 있고
여러 개 파일로도 관리할 수 있다.
rule_files:
  # - "first_rules.yml"
  # - "second_rules.yml"
rule_files 하위에 있는 파일을 수정하면 위에서 설정한 인터벌마다 파일을 긁어서 변경된 룰을 반영해준다.
scrape_configs :
실제 내가 스크랩할 대상을 지정하는 것.
job 이라는 단위로 인식을 하는데 job이 논리적인 대상의 이름이라고 보면 된다.
scrape_configs:
  # The job name is added as a label `job=<job_name>` to any timeseries scraped from this config.
  - job_name: "prometheus"

    # metrics_path defaults to '/metrics'
    # scheme defaults to 'http'.

    static_configs:
      - targets: ["localhost:9090"]
~
static_configs 우리는 PM 머신 기반 IP port 가 있는 걸을 할 거고, 우선은 자기 자신이니까
로컬호스트에 9090으로 스크랩 하면 된다. 고 해놓았다.
기본패스가 매트릭스로 검색을 한다. 그래서 매트릭스 패스를 수정할 거면 그것도 추가 설정을 남겨서 path가 다르다면 path를 수정하면 됨.
스키마는 기본으로 HTTP인데, HTTPS인 경우 추가로 입력을 해주면 된다.
이렇게 yml을 설정하면 자기 자신의
9090의 metrics 포트에 수정해서
그 친구한테 job name을 Prometheus라고 입력을 해주겠다라는 설정이다.
- prometheus 의 데이터를 검색할 수 있는 사이트를
localhost:9090/graph로 노출한다. - 웹 브라우저로 설치한 서버의 public IP 주소로 해당포트와 path 로 접근해본다.
2.1.5 systemctl 로 등록
설정파일
sudo vi /etc/systemd/system/prometheus.service예제 내용
[Unit]
Description=Prometheus Server
Documentation=https://prometheus.io/docs/introduction/overview/
Wants=network-online.target
After=network-online.target

[Service]
User=$YOUR_USER
Group=$YOUR_USER
Restart=on-failure
WorkingDirectory=
ExecStart=$YOUR_PROMETHEUS_HOME/prometheus \
--config.file=$YOUR_PROMETHEUS_HOME/prometheus.yml \
--web.console.templates=$YOUR_PROMETHEUS_HOME/consoles \
--web.console.libraries=$YOUR_PROMETHEUS_HOME/console_libraries \
--web.enable-admin-api

[Install]
WantedBy=multi-user.target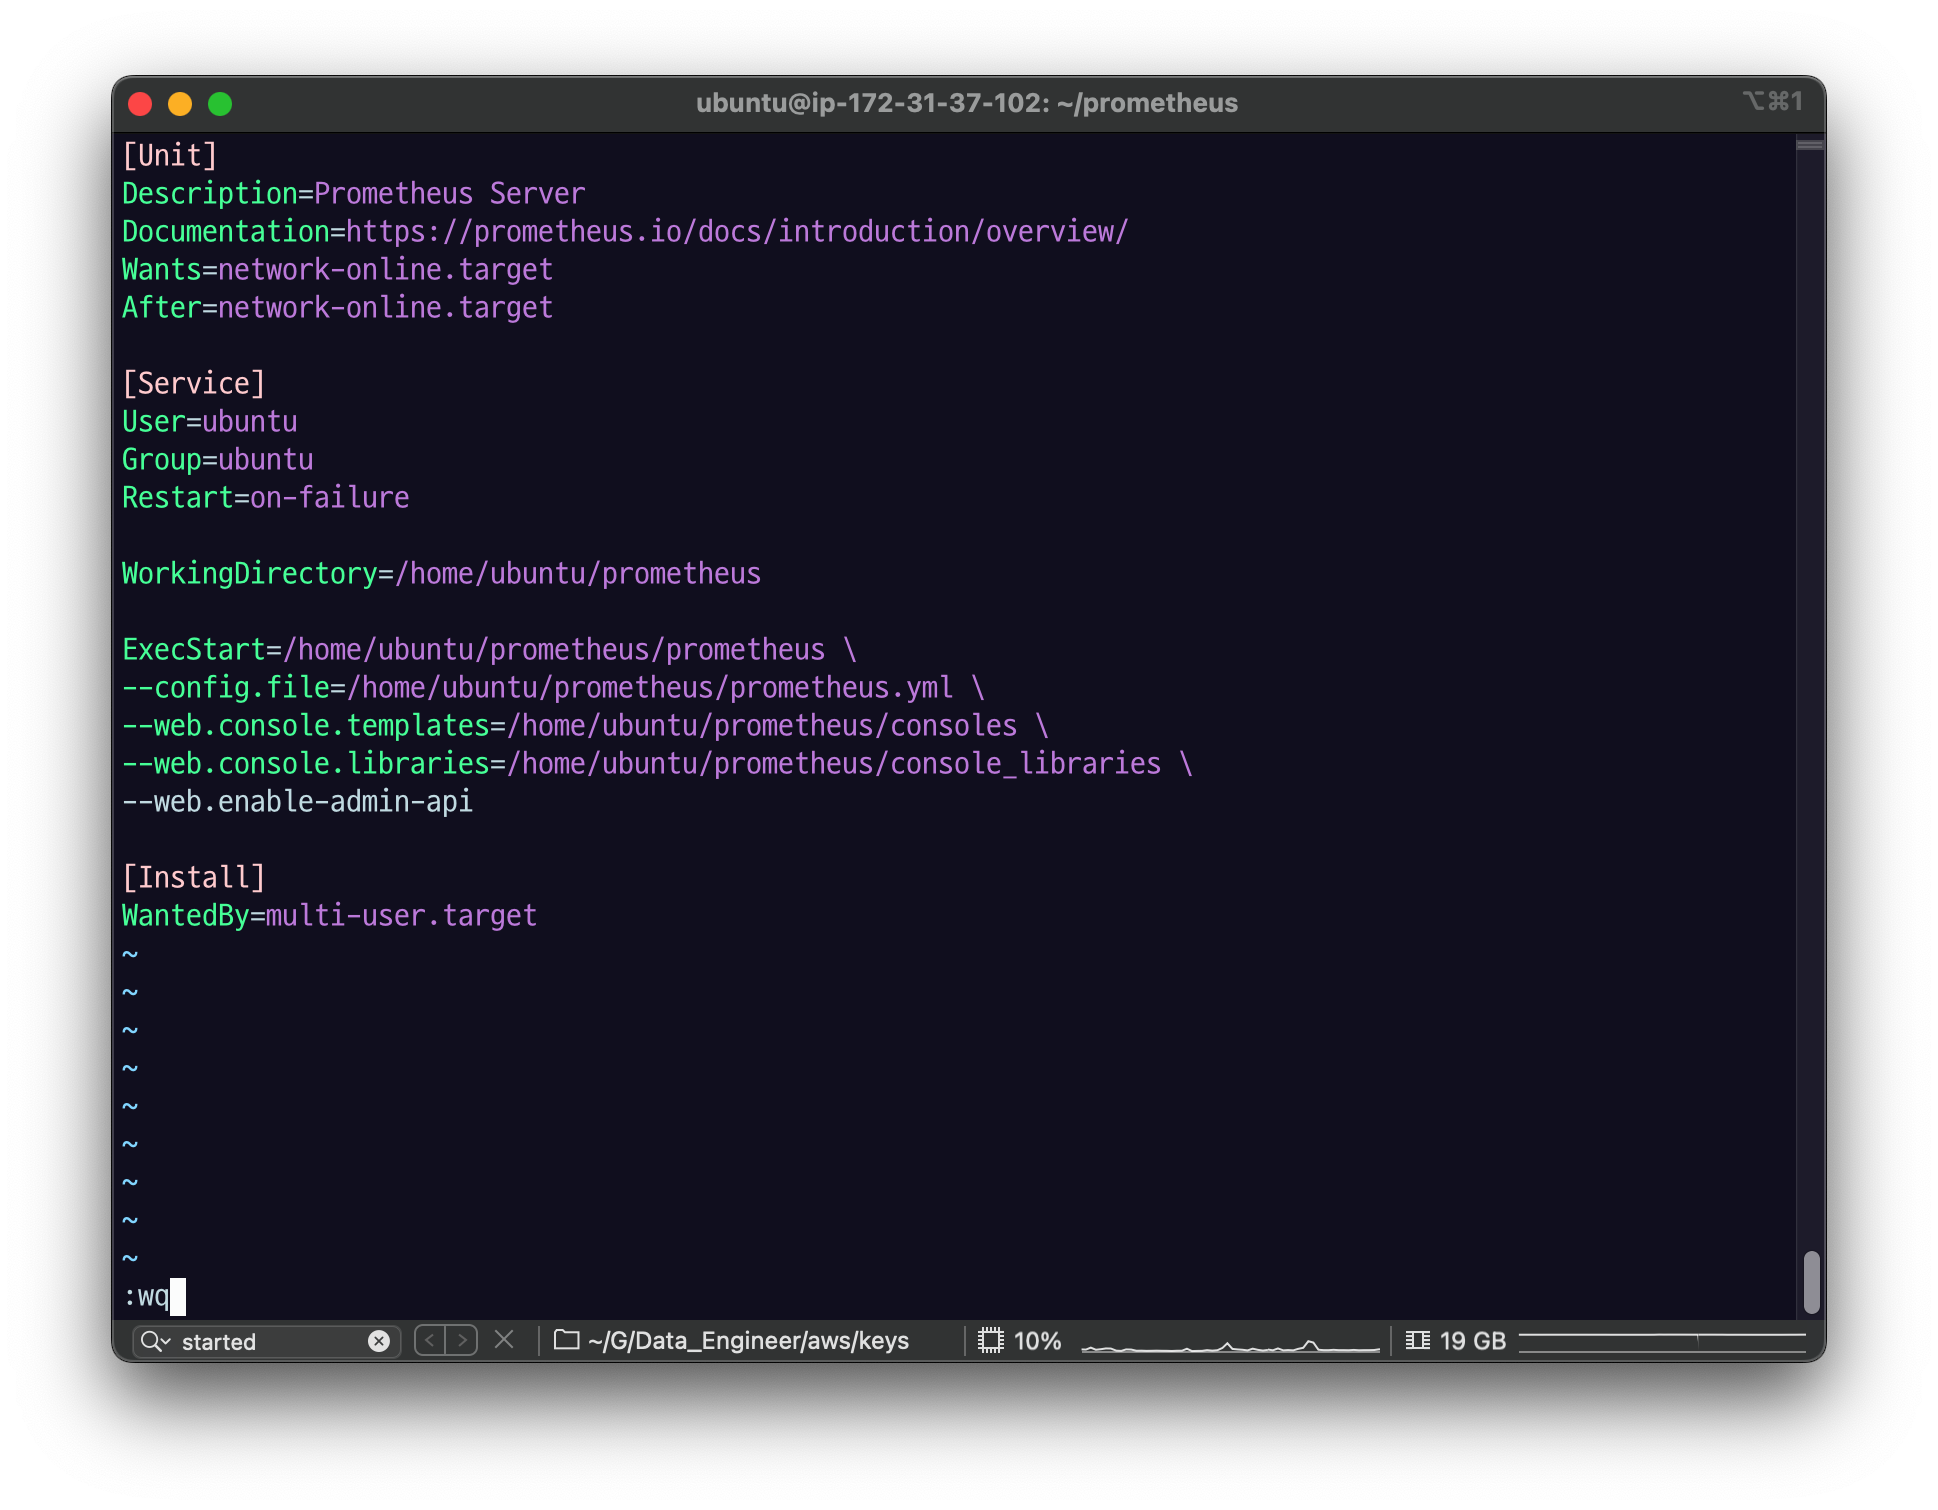
- --web.enable-admin-api
admin-api도 웹에서 가능하게 하겠다.
User=
Group=
유저와 그룹은 실제로 그 경로에 권한이 있는 유저여야 한다.
등록
sudo systemctl daemon-reloadsudo systemctl enable prometheus.service(enable 처음 하면 로그가 뜨는데 두번 째 부터는 안 뜸)
systemctl로 prometheus 시작
sudo systemctl start prometheus.service이렇게 start를 하면 아까 .yml에서 설정한 ExecStart에 설정 해두었던 명령으로 수행이 된다.
ps -ef | grep prometheus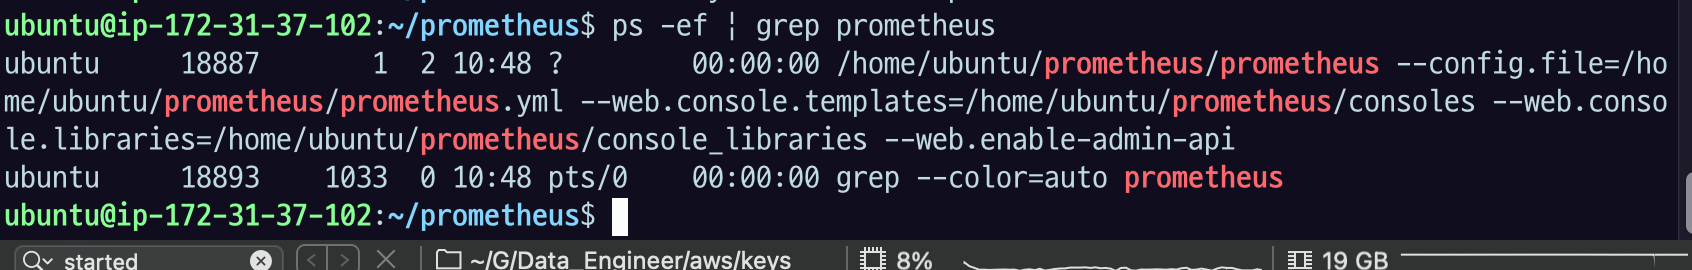
그 다음 다시 웹페이지로 돌아가서 새로고침.
잘 접속이 되었는지 확인해보자!
/metrics 도 값이 바뀔 것이다.
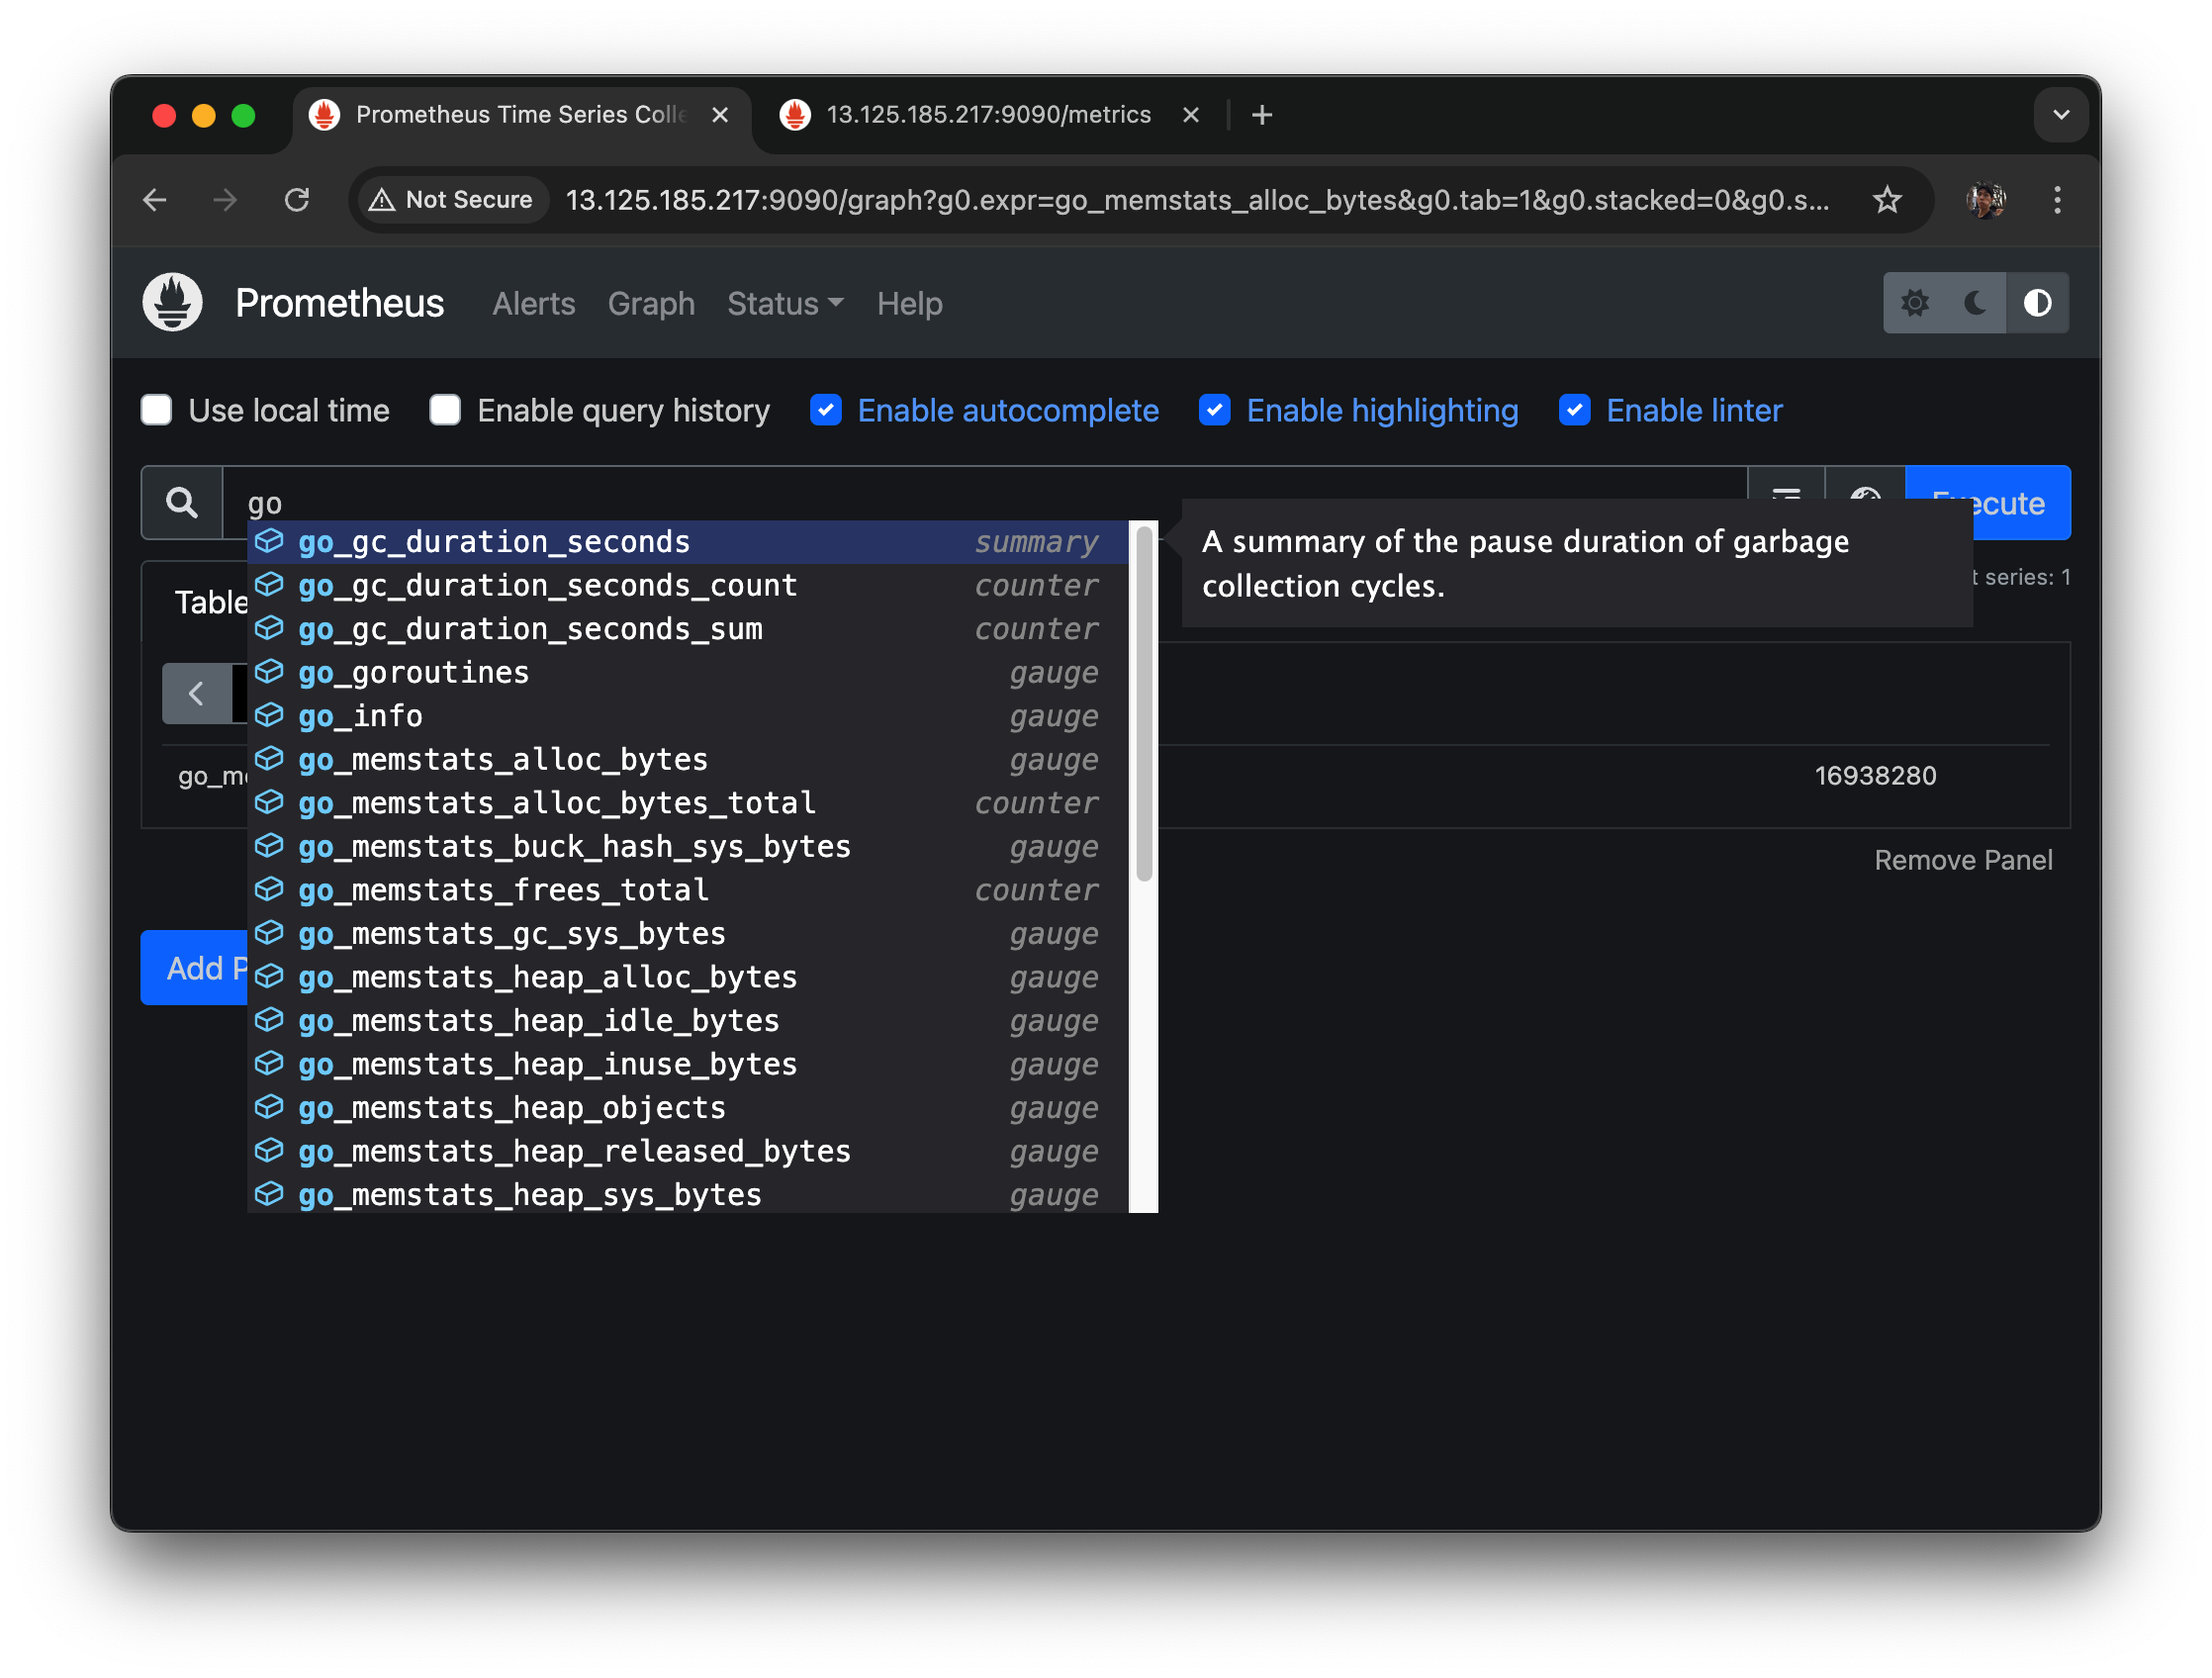
go 만 입력해도 매트릭들이 수집된 것 중에 어떤 애들이 있고, 어떤 타입인지도 나온다.
2.2 Prometheus Push gateway 설치하기
프로메테우스는 스크랩을 하는데 - 푸시게이트웨이는 직접 데이터를 쏠 수 있게 해주는 것.
pushgateway 가 쏜 걸 받고, prometheus 서버는 이 푸시 게이트웨이를 스크랩하도록 되어있다.
pushgateway도 별도의 바이너리가 있으니까 설치를 해보자.
2.2.1 다운로드 및 설치
cd ~/
wget https://github.com/prometheus/pushgateway/releases/download/v1.5.1/pushgateway-1.5.1.linux-amd64.tar.gz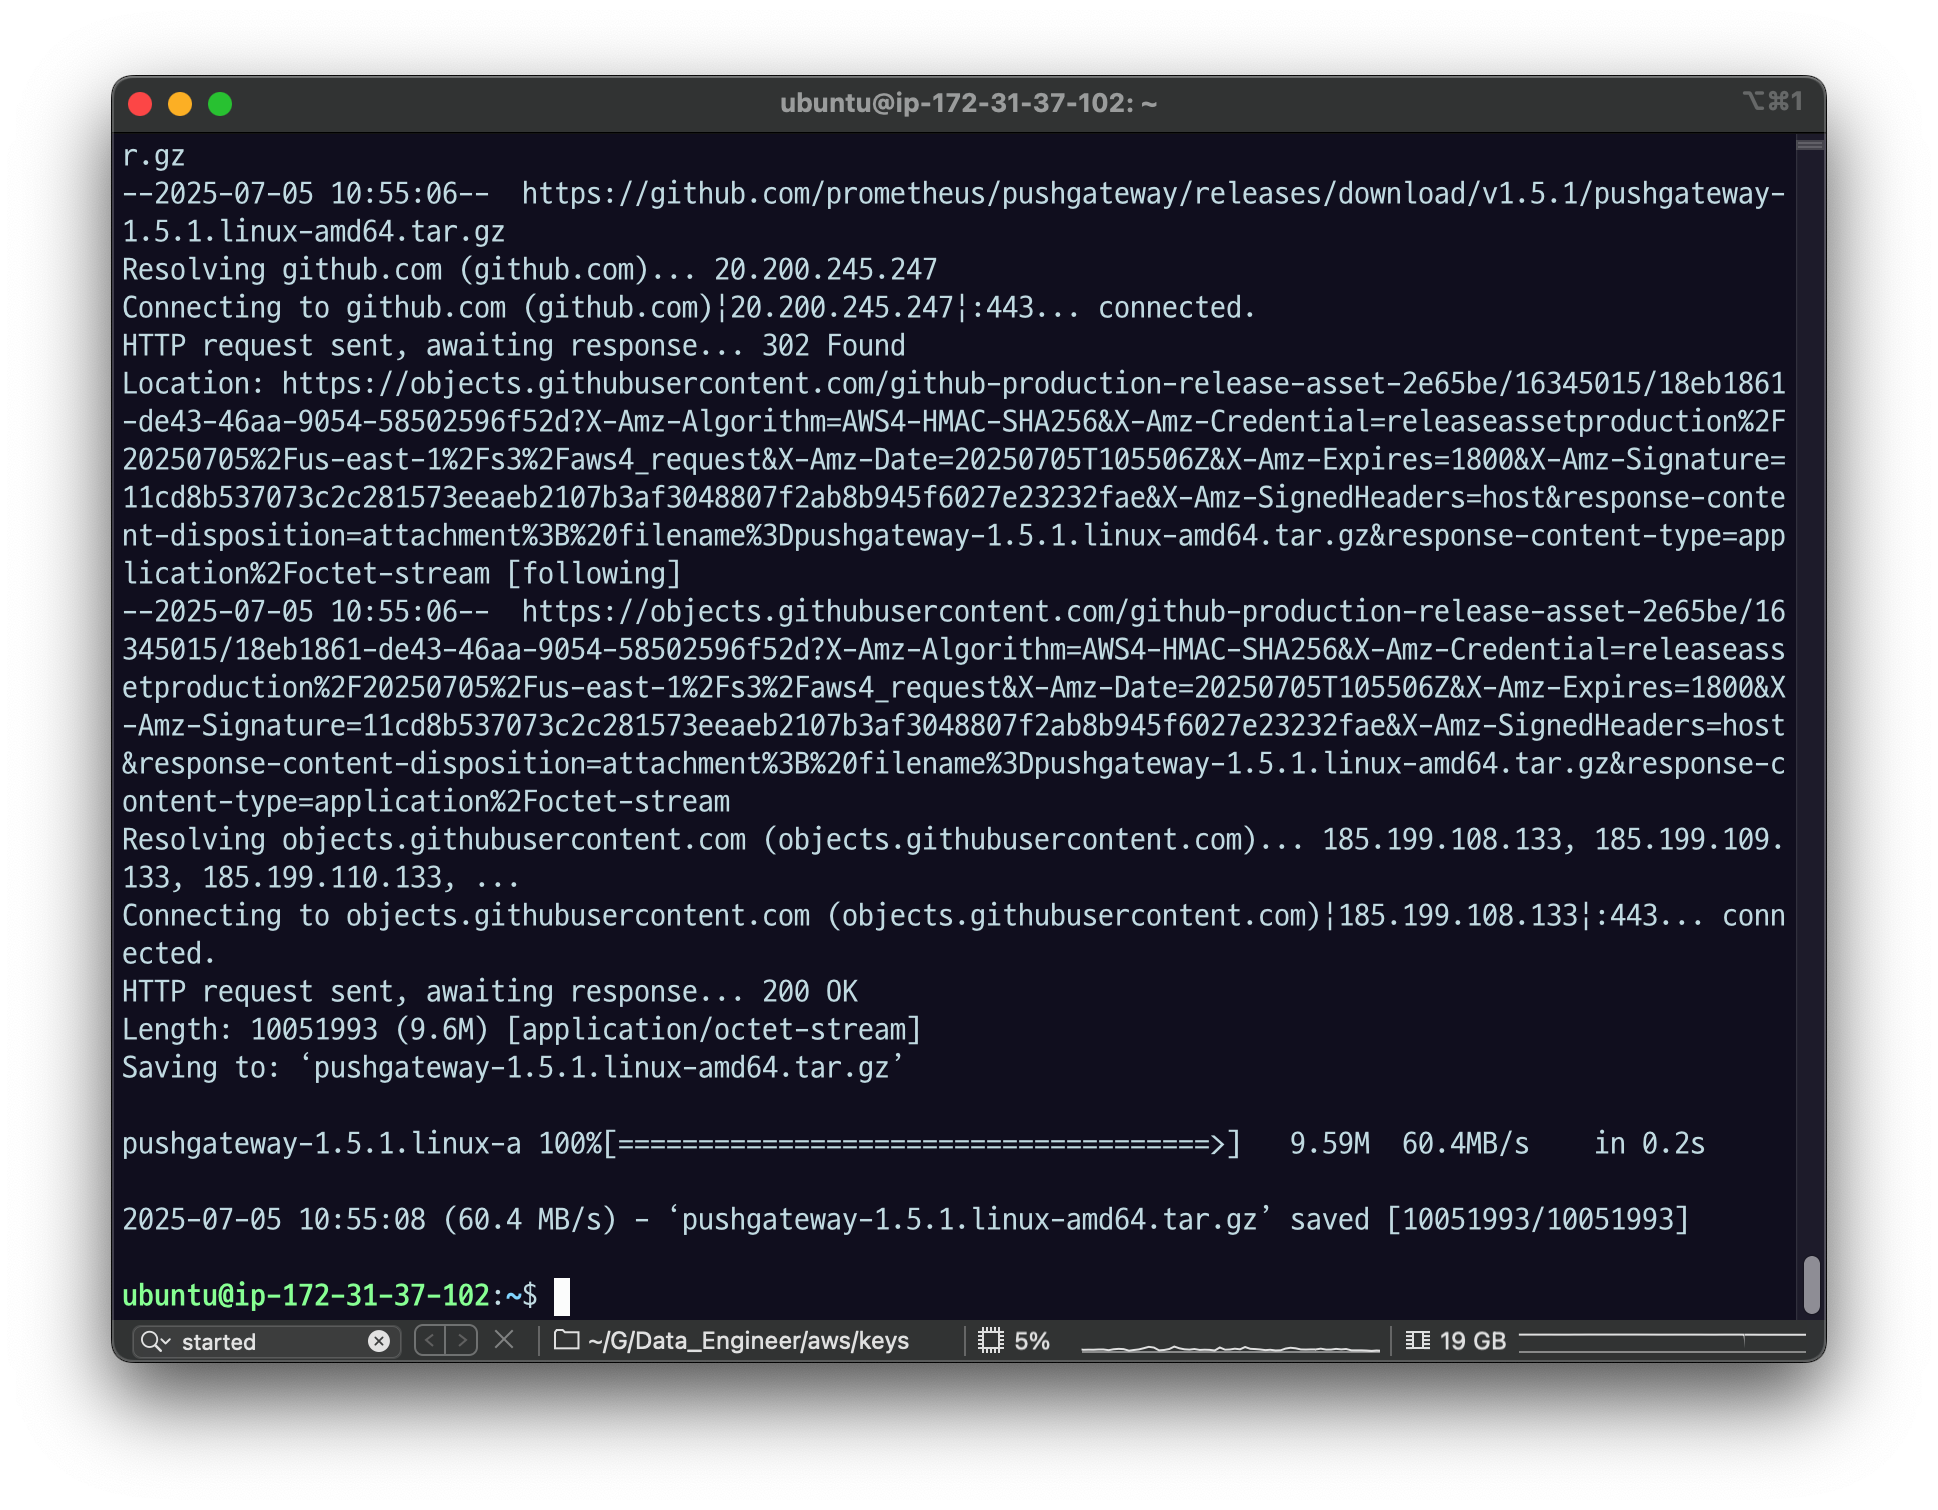
tar xvfz pushgateway-*.tar.gz
mv pushgateway-1.5.1.linux-amd64 pushgateway
cd pushgateway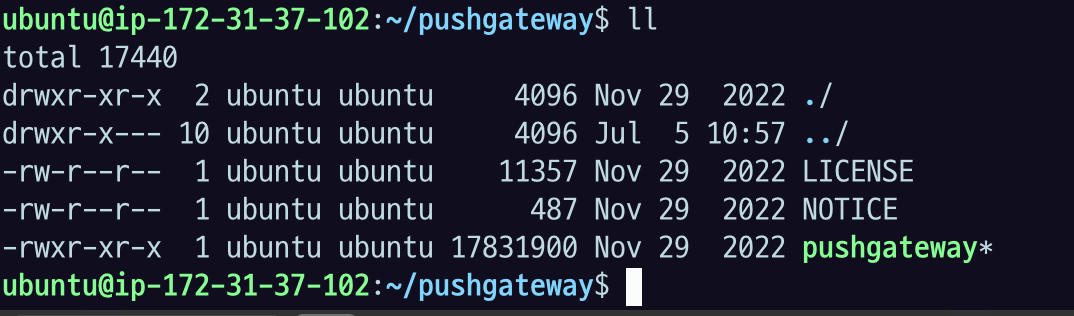
보면 푸시게이트웨이는 바이너리가 딱 하나 있다.
이 친구는 메인터넌스, 오픈소스에서 활발히 개발하지는 않는다
용도가 push를 받아주기만 하는 용도니까.
2.2.2 실행
./pushgateway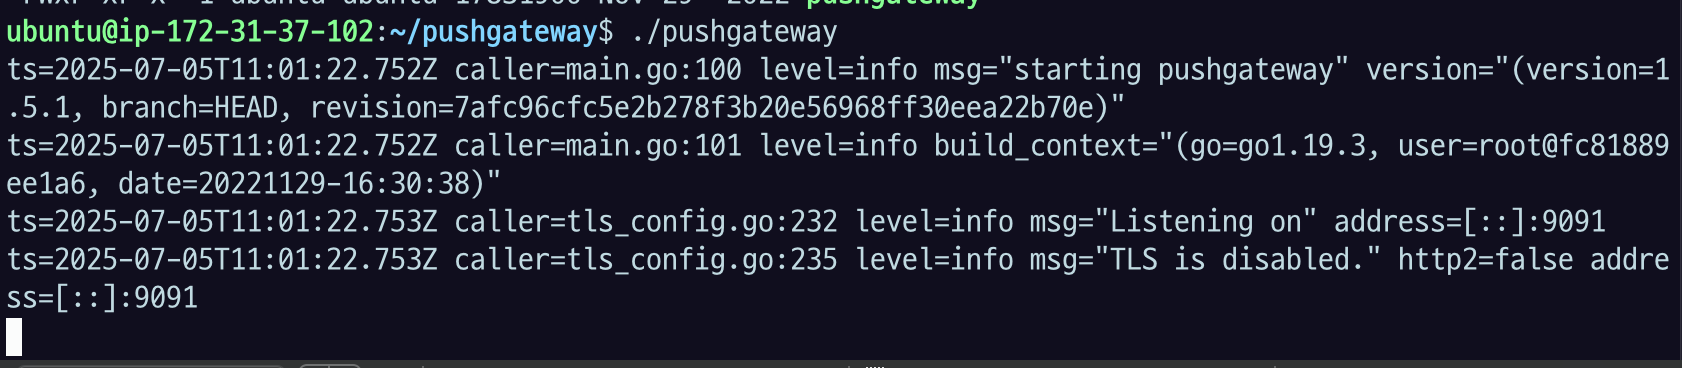
Listening on" address 이렇게 되면 실행이 된 것이고,
기본으로 9091 포트로 리슨. (파라미터 옵션으로 수정 가능)
프로메테우스랑 같은 서버에 설치를 했는데, 다른 서버에 설치를 해도 된다.
꼭 똑같아야 하는 건 아니기 떄문에.
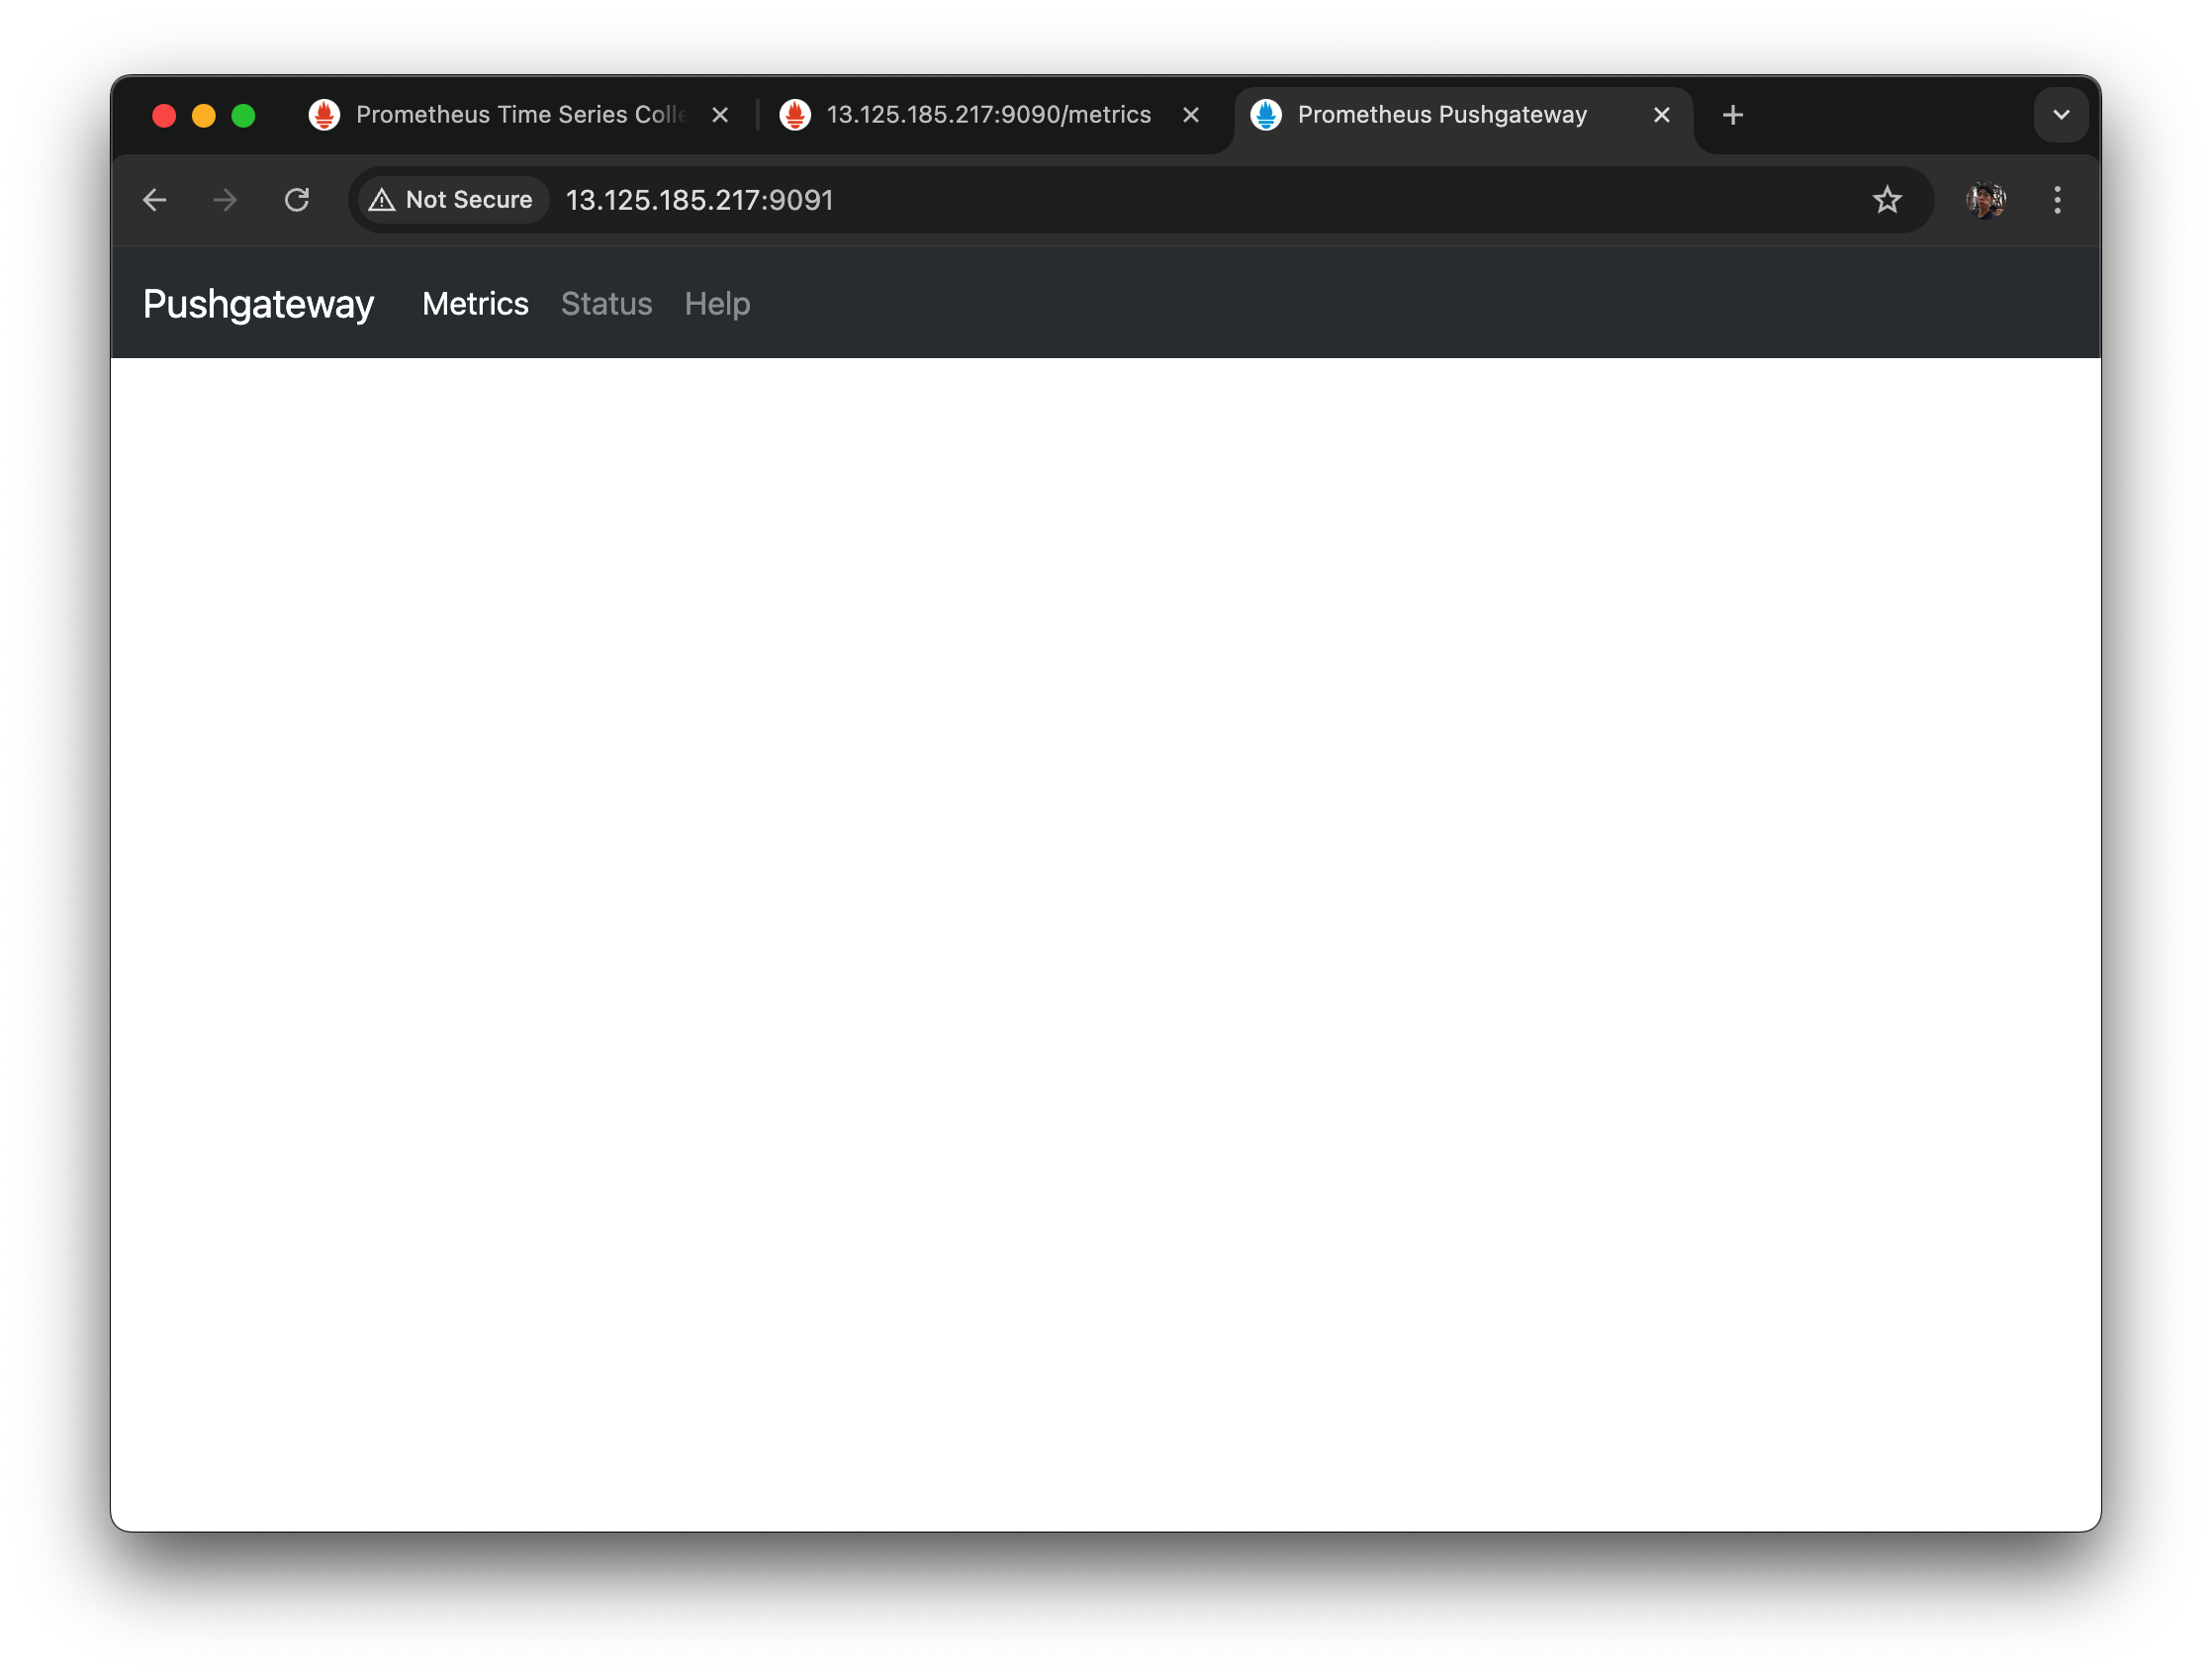
9091로 들어가서 이런 화면이 나온다면 제대로 설치가 된 것이다.
우선 아직 아무런 데이터도 쏘지 않았으니까 이런 화면.
2.2.3 확인
pushgateway 는 localhost:9091 에 뜬다.
- web ui 를 볼 수 있다.
- 현재 저장된 메트릭 정보는
/metricspath 를 활용한다.
다음 명령어로 some_metric{job="some_job"} 을 pushgateway 에 전송하자.
echo "some_metric 3.14" | curl -XPOST --data-binary @- http://$YOUR_IP:9091/metrics/job/some_job데이터를 넣을 수 있는 CURl.
some_metric 이라는 이름의 매트릭이고, 3.14 라는 값을 가진다.
중간에 라벨로 job="some_job" 을 넣어두었다.
curl post 로 강제로 넣어주도록 했다.
내 mac 터미널로 가서 위에 curl을 입력해보자.
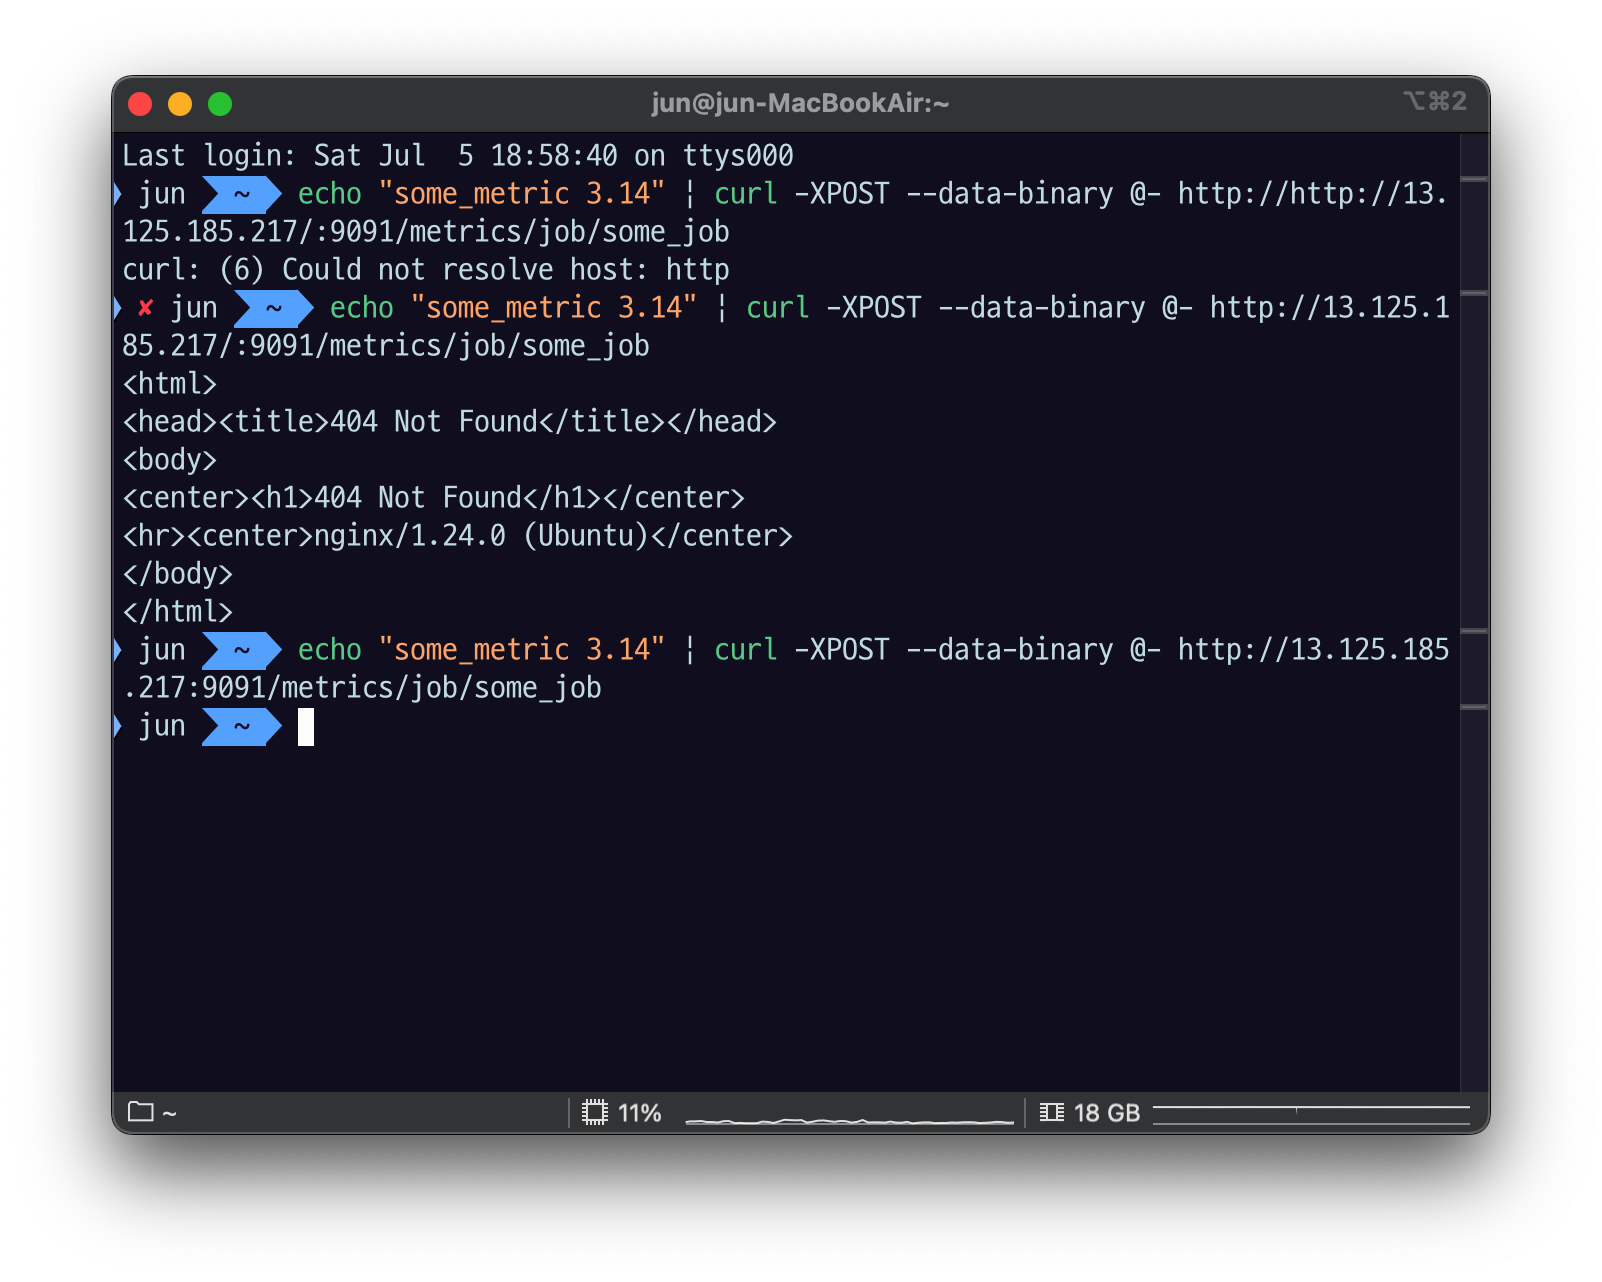
원래는 응답이 없는 게 맞다. 오타 있는지 잘 확인을 해보자.
다시 pushgateway 서버에 와서 reload 를 하면
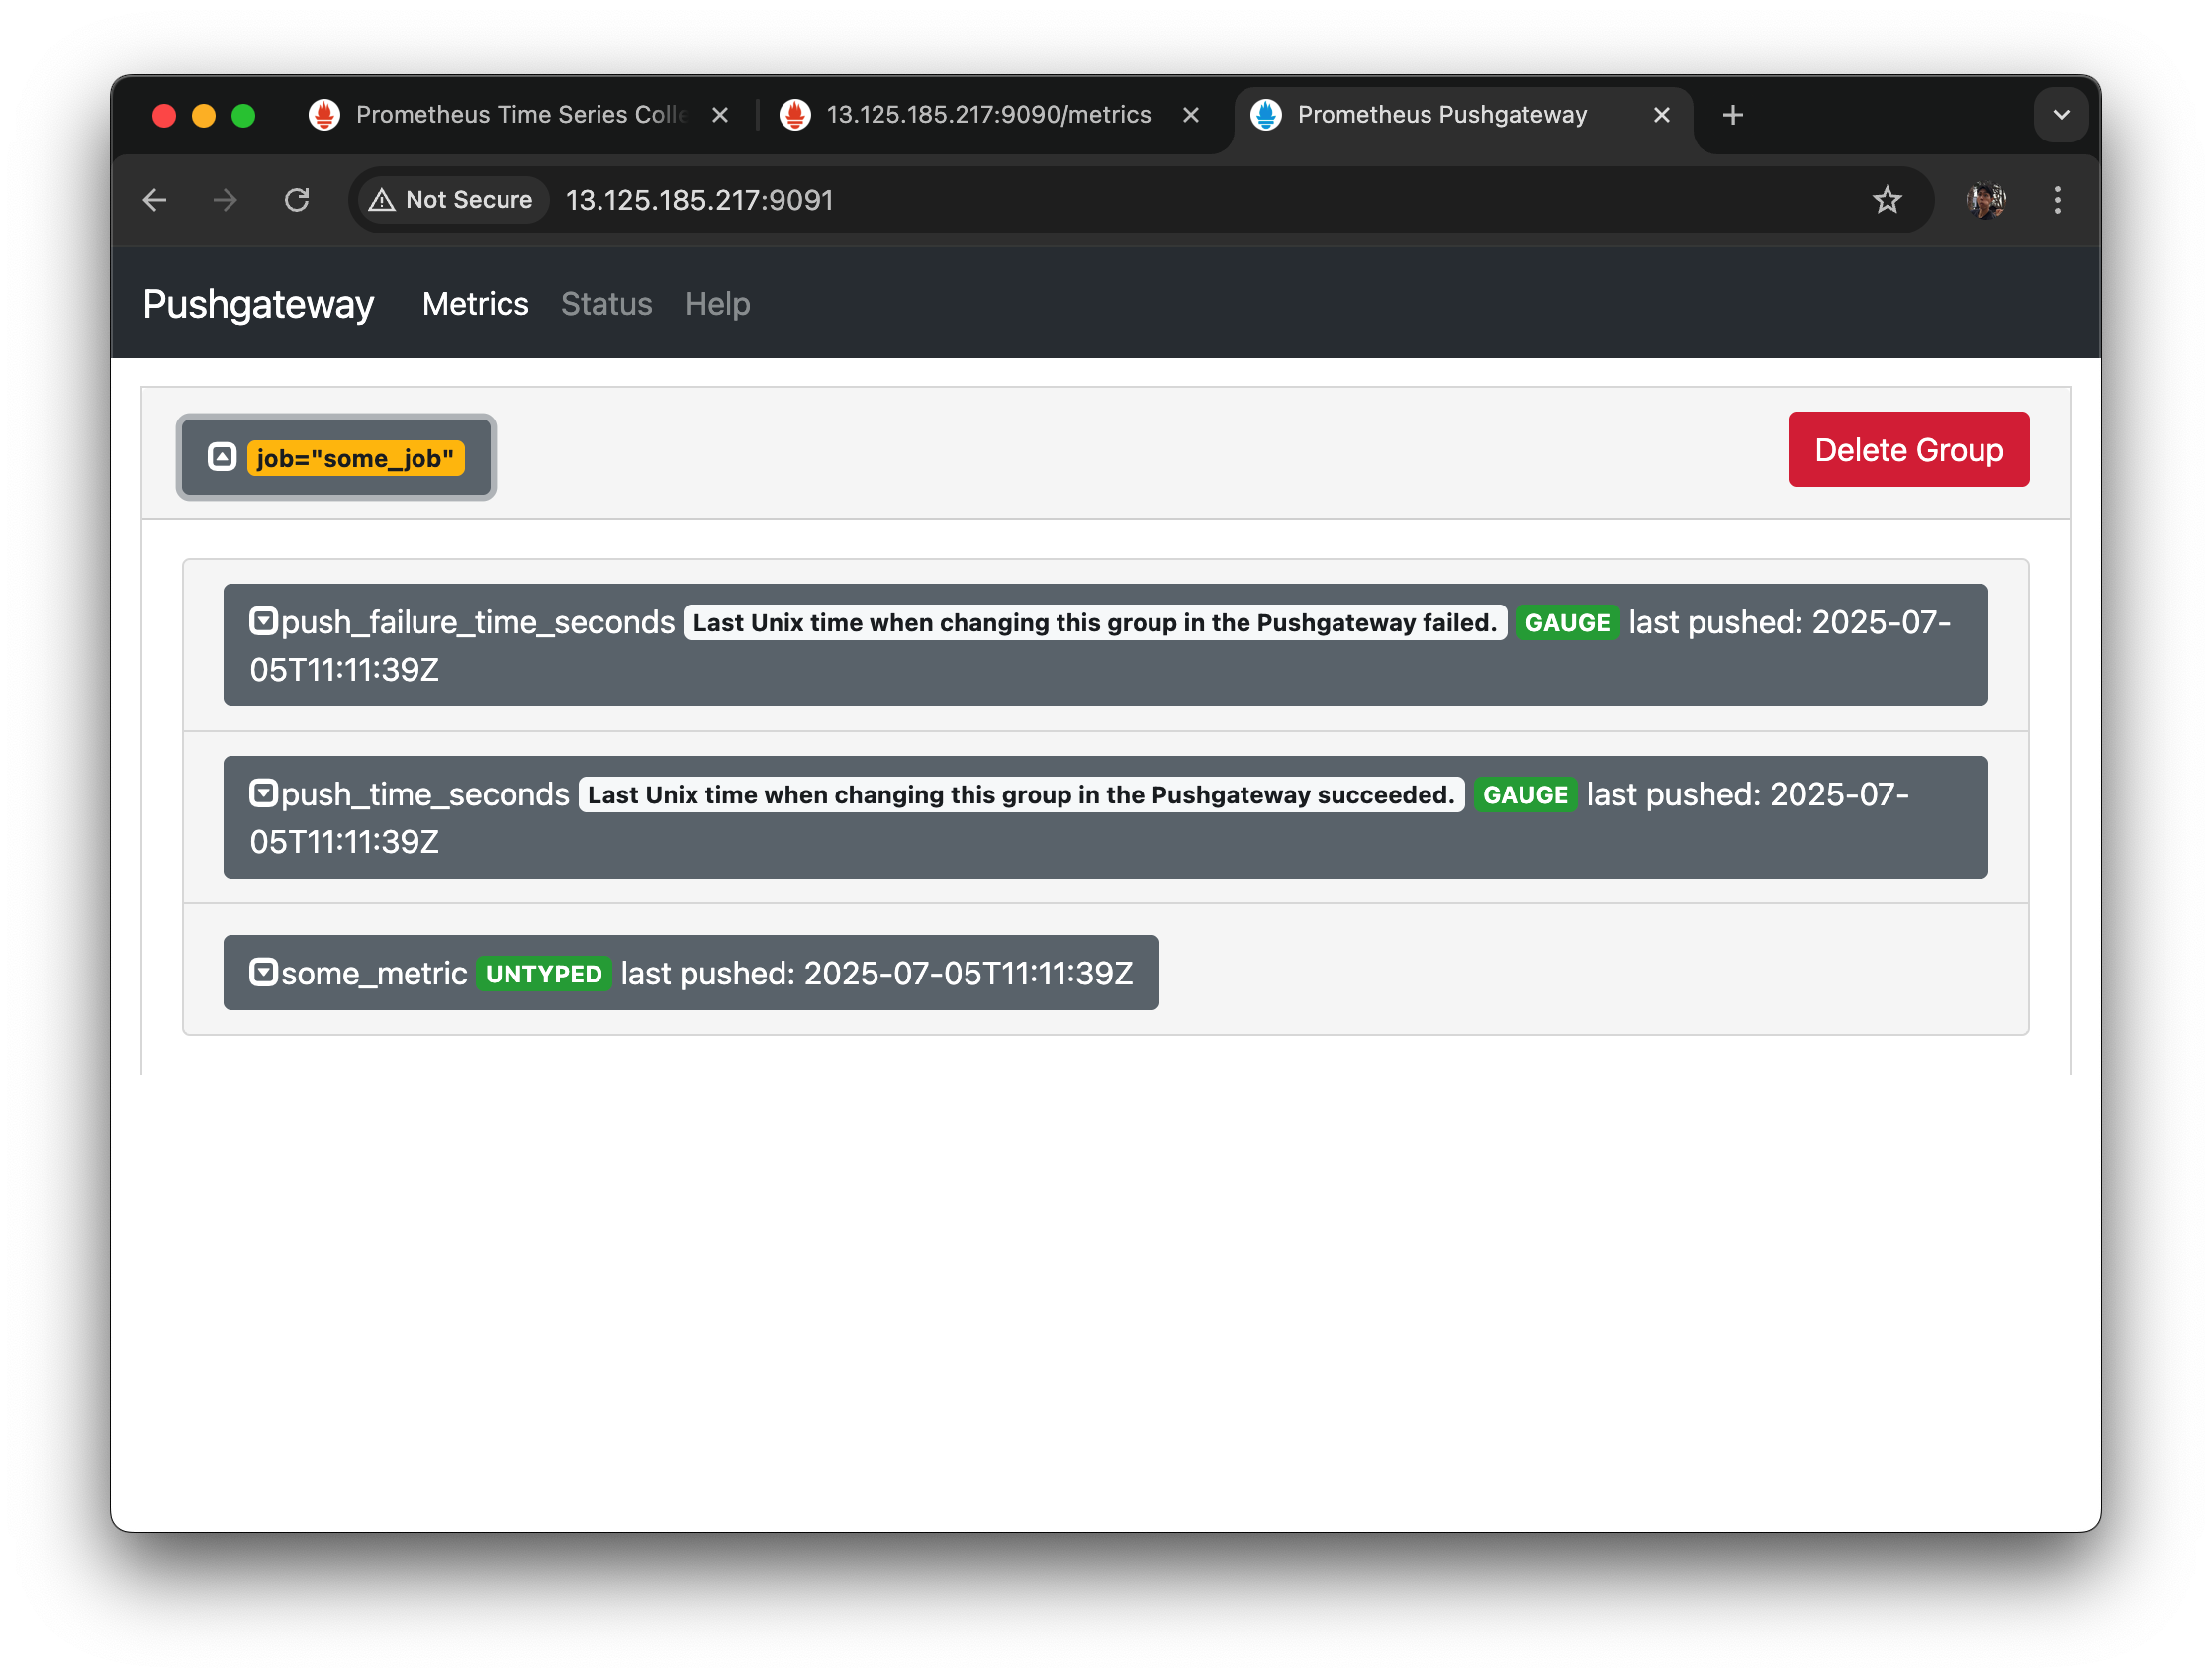
이렇게 job = "some_job" 이 생겼다.
여기는 라벨 단위로 이렇게 분기가 된다.
라벨이 잡인데 some_metric 이라는 게 왔고 언제 푸시됐는지 시간도 나온다.
타입도 나오는데 내가 아까 타입을 입력하지 않았기 때문에 UNTYPED 라고 나온다.
이렇게 Pushgateway 가 잘 설정된 것을 알 수 있다.
이제 Pushgatewayeh systemctl로 등록을 해보자.
2.2.4 systemctl로 등록
ctrl+c 로 잠시 stop 시켜놓고
sudo vi /etc/systemd/system/pushgateway.service아래 예제를 넣어주자.
[Unit]
Description=Pushgateway
Wants=network-online.target
After=network-online.target

[Service]
User=$YOUR_USER
Group=$YOUR_USER
Type=simple
ExecStart=$YOUR_PUSHGATEWAY_HOME/pushgateway \
	--web.listen-address=":9091" \
	--web.telemetry-path="/metrics" \
	--persistence.file="$YOUR_PUSHGATEWAY_HOME/metric.store" \
	--persistence.interval=5m \
	--log.level="info" \

[Install]
WantedBy=multi-user.target$YOUR_PUSHGATEWAY_HOME을 자신의 경로에 맞게 수정한다.$YOUR_USER도 자신이 사용할 유저에 맞게 수정한다.$YOUR_PUSHGATEWAY_HOME에 대한 소유권한 (chown)이
$YOUR_USER에게 있어야 한다.- persistence.interval 이 지나면 메모리에서 file로 기록한다.
- persistence.file 을 설정하면, 한 번 저장된 메트릭 이름이 남아있다.
- 많이, 오래 저장할 경우 local disk 가 부족할 수 있다. pushgateway 는 외부로 확장할 방법이 없다.
- 파일로 내리지 않고 메모리에서만 사용하는 것도 좋다.
--web.telemetry-path="/metrics" \ : 자기자신의 매트릭을 보려면 metrics 로 들어가게 되어있다.
persistence.file="~" : 이건 있어도, 없어도 되는 옵션인데 이 설정이 있으면 요 파일에 내가 받은 Metric 정보를 persistent 하게 저장 하는 용도다. 한 번 들어왔던 데이터가 같은 매트릭 이름이면 덮어 써지고, (스냅샷만 남기는 것이니까) 저장이 되는데, 그 인터벌이 5분이다.
인터벌은 5분 동안 저장한다는 게 아니라 이 pushgateway 서버가 메모리에 들고 있다가 파일을 내리는데 5분 뒤에 파일을 내린다는 것.
그러니까 만약에 5분 동안 이 pushgateway 서버가 죽으면 그 사이에 마지막 저장한 시점부터 그 사이까지 데이터는 유실이 될텐데
그래서 이거는 이게 잘 죽을 것 같고 그리고 데이터가 죽었을 때 재기동했을 때 데이터가 보관됐으면 좋겠다 할 때 이렇게 하는 것.
대신에 이게 pushgateway 같은 경우는 외부 디스크 DB를 쓸 수는 없고 확장이 불가능 하기 때문에 디스크를 쓴다.
등록
sudo systemctl daemon-reloadsudo systemctl enable pushgateway.service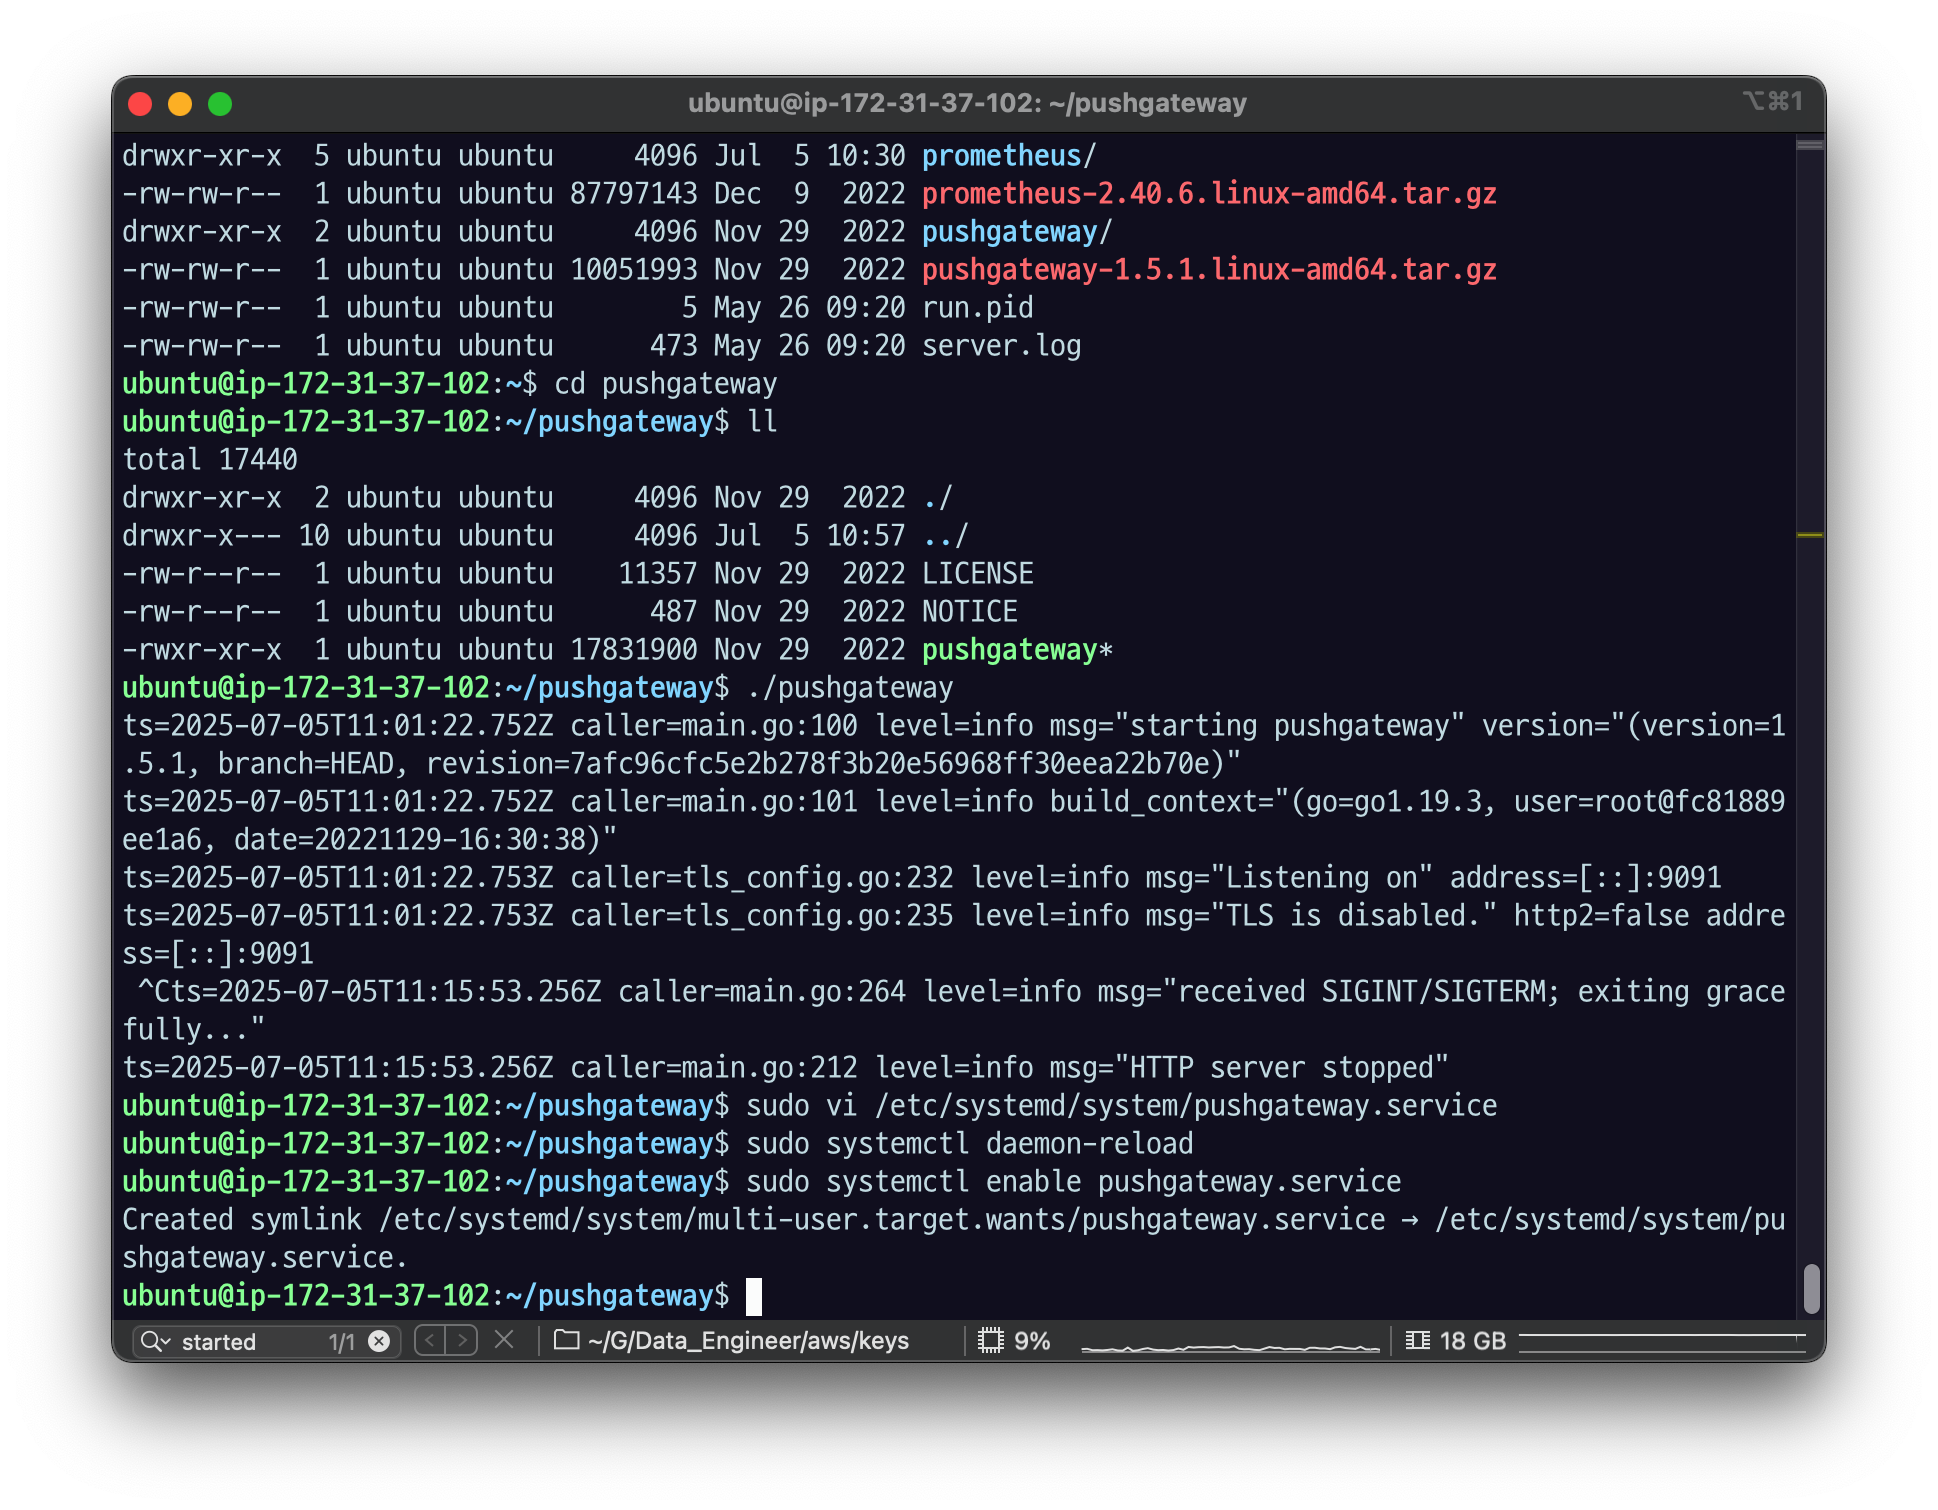
systemctl로 pushgateway 시작
sudo systemctl start pushgateway.serviceps -ef | grep pushgateway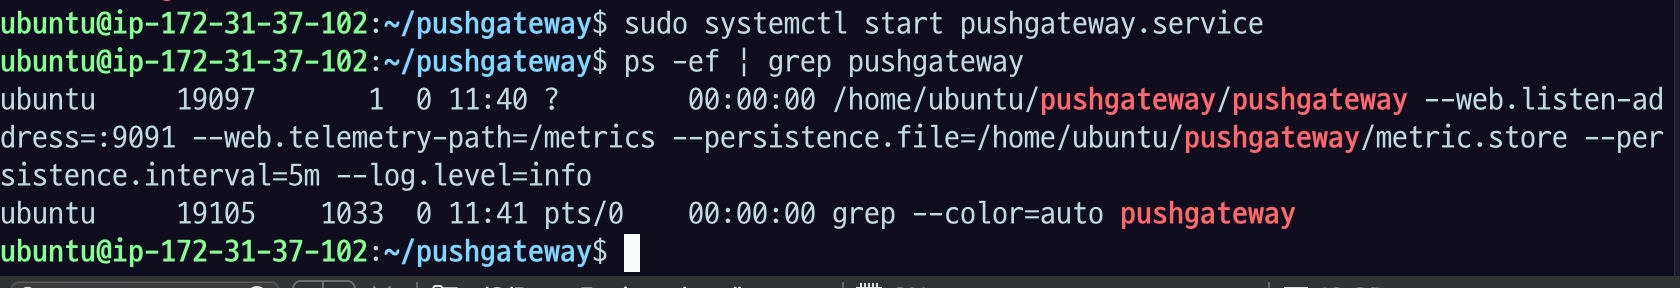
다시 9091로 접속해서 페이지 열리는지 확인해보고,
/metrics 접속해보자.
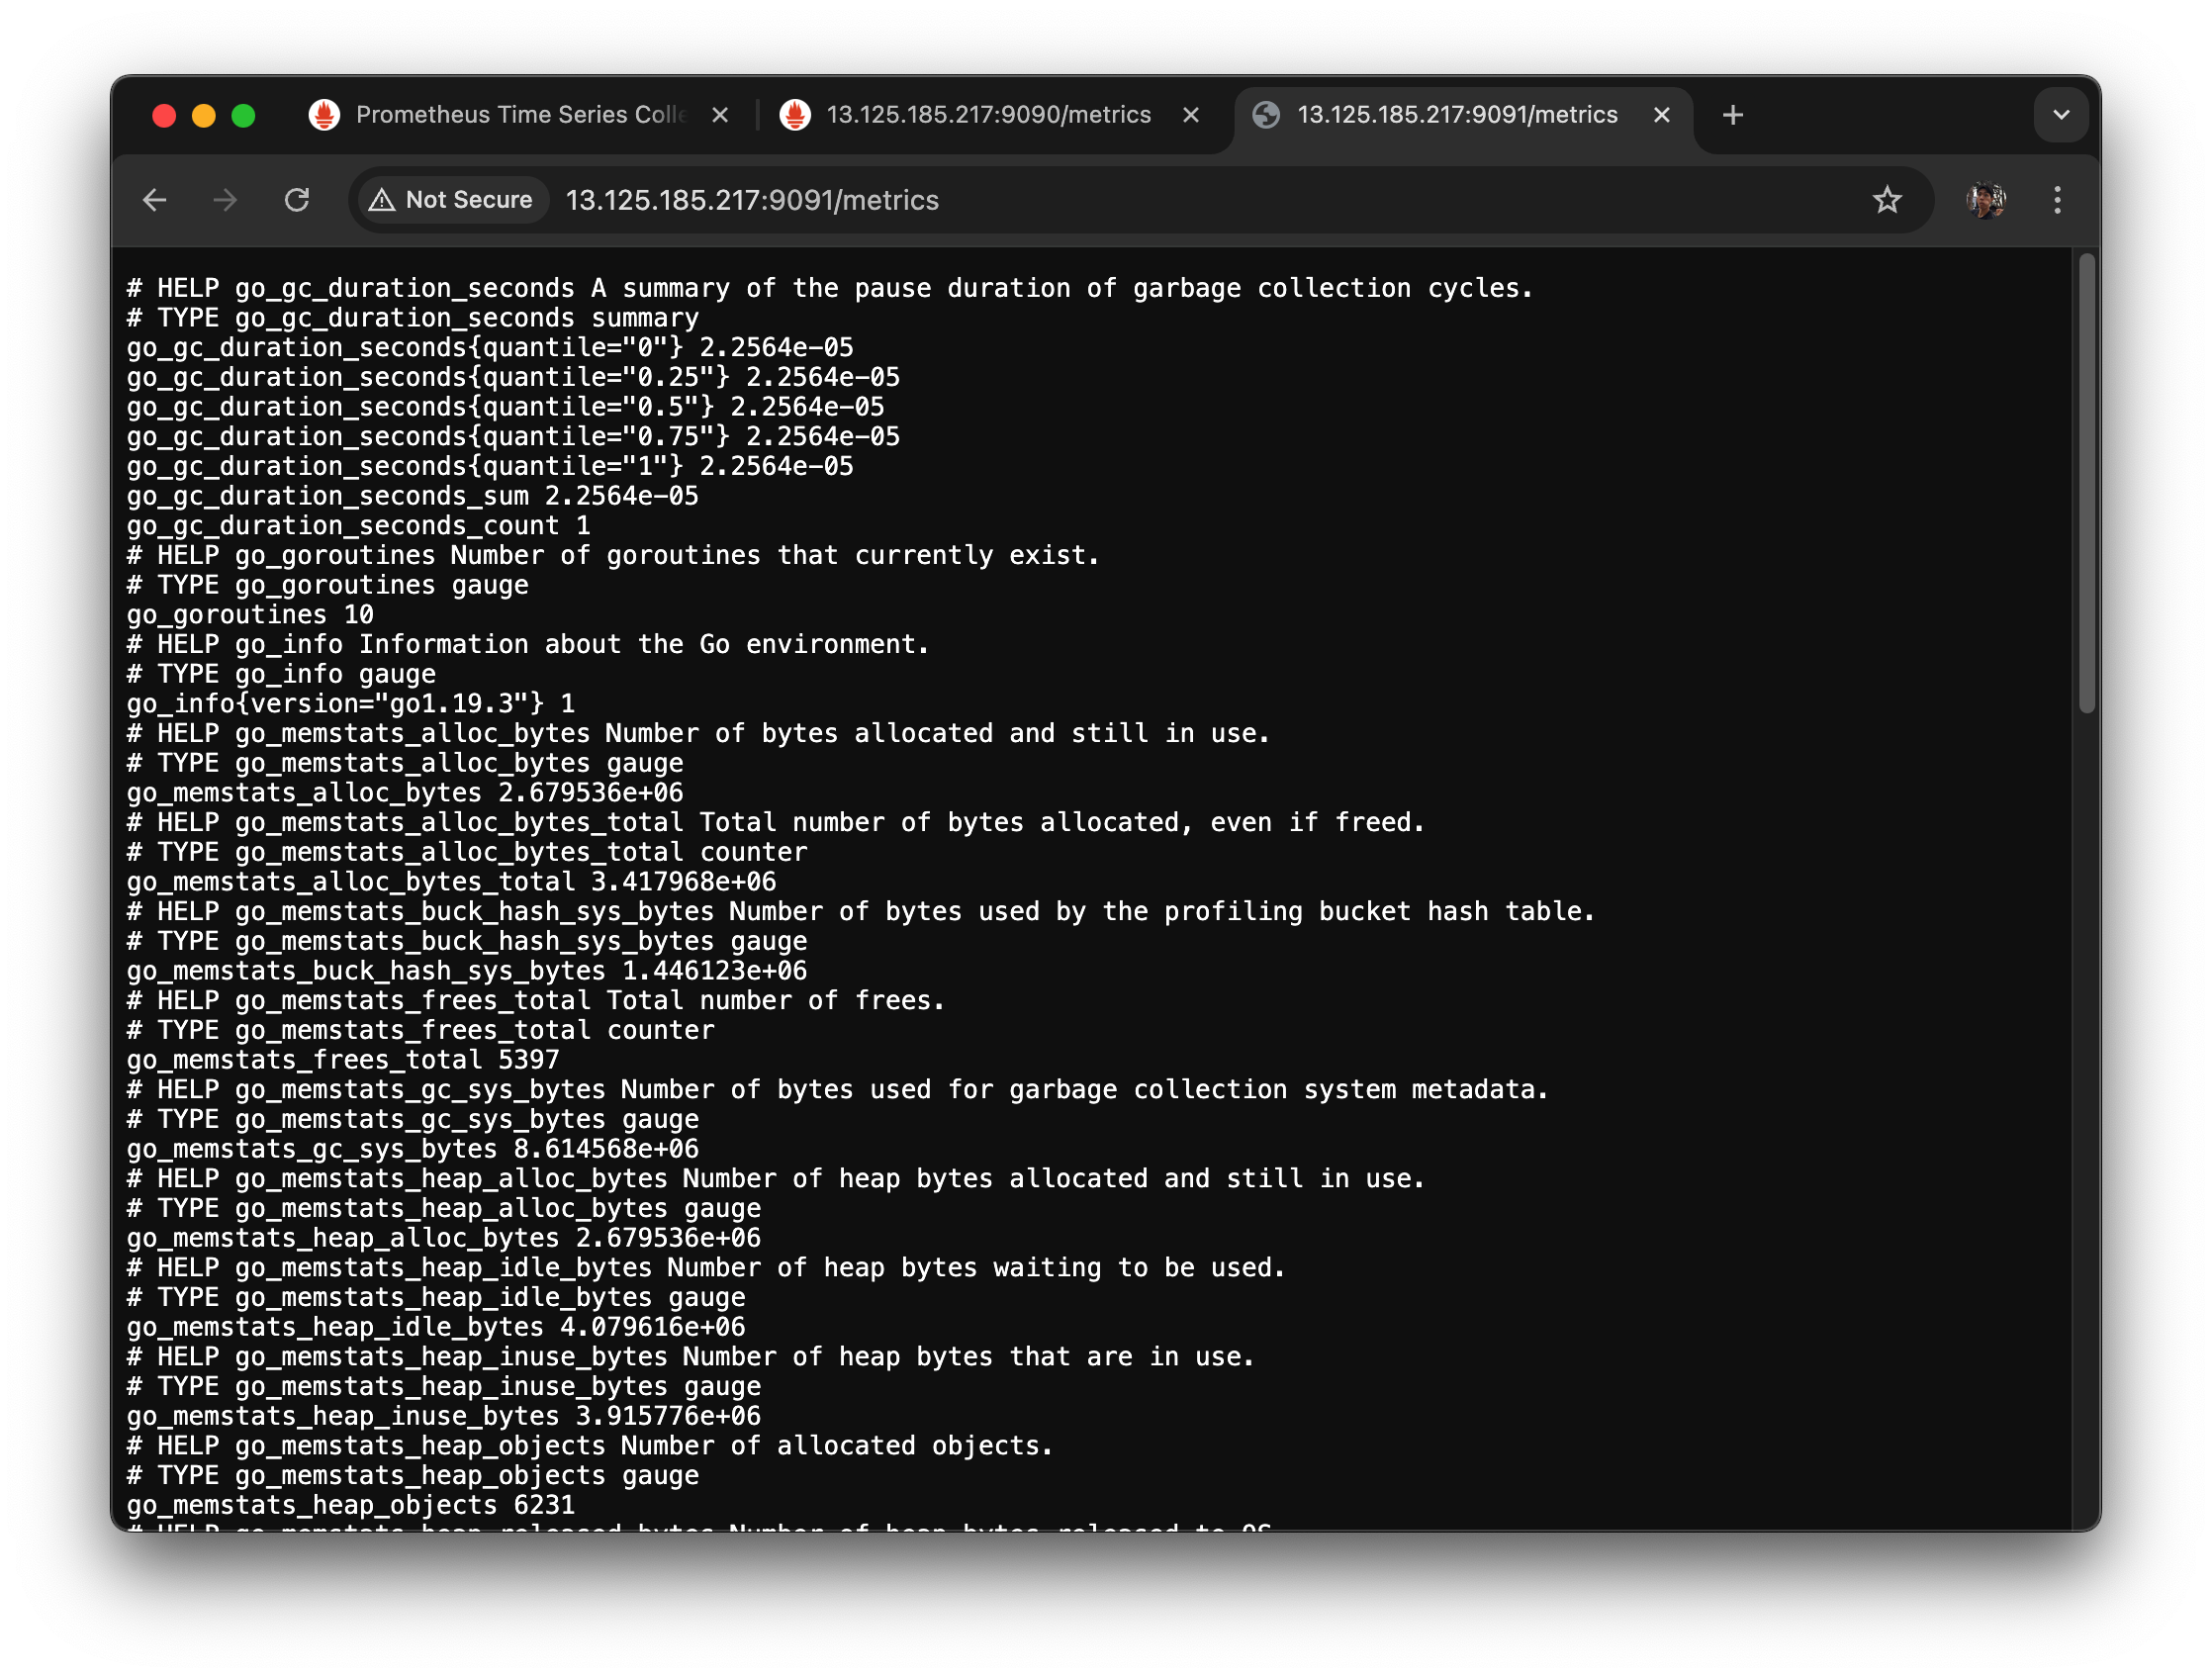
/metrics 접속하면 자기 자신의 metric 이 나온다.
이친구도 go lang으로 만들어져 있다.
2.2.5 Prometheus 에서 Pushgateway 를 scrap 하도록 세팅
pushgateway는 자기자신이 들고 있으니까 누군가 push 한 거를
prometheus가 pushgateway를 스크랩하는 거다.
결국 push한 내용을 프로메테우스가 알 수 있는 건
pushgateway가 받아서 proxy로 쏴주는 게 아니라
자기가 들고 있고 프로메테우스는 원래 역할대로 스크랩을 해라.
왜냐면 프로메테우스가 용량 관리나 이런 것들을 자기가 스크랩하면서 조절할 수 있다.
그래서 프로메테우스는 죽으면 안 되는 친구여서
prometheus.yml을 수정해서
원래 있던 스크랩 컨피그스의 하위에 아래 내용을 추가해 주자.
$PROMETHEUS_HOME/prometheus.yml 을 수정해서 pushgateway 의 데이터도 scrap 할 수 있도록 하자.
cd ../prometheus/
vi prometheus.yml- scrap_configs: 하위에 다음 내용을 추가.
- job_name: 'pushgateway'
	honor_labels: true
	static_configs:
		- targets: ['$YOUR_PUSHGATEWAY_IP_OR_DNS:9091']
$YOUR_PUSHGATEWAY_IP_OR_DNS에 pushgateway 를 설치한 IP 나 DNS이름을 넣는다.
이렇게 하면 스크랩 대상이 늘어났다.
원래는 자기 자신의 9090만 스크랩했는데
localhost 9091에 스크랩을 하도록 추가했다.
기본은 매트릭스 패스를 조회한다고 했는데
아까 9091에 metrics패스에 매트릭들이 잘 나오는 것을 확인했었다.
- systemctl 을 통해 prometheus 를 재기동한다.
sudo systemctl daemon-reload
sudo systemctl stop prometheus.service
sudo systemctl start prometheus.service
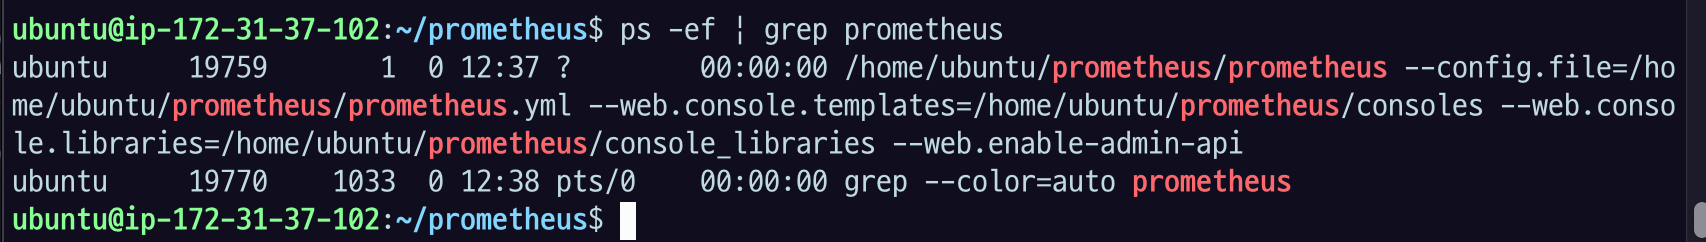
ps -ef | grep prometheus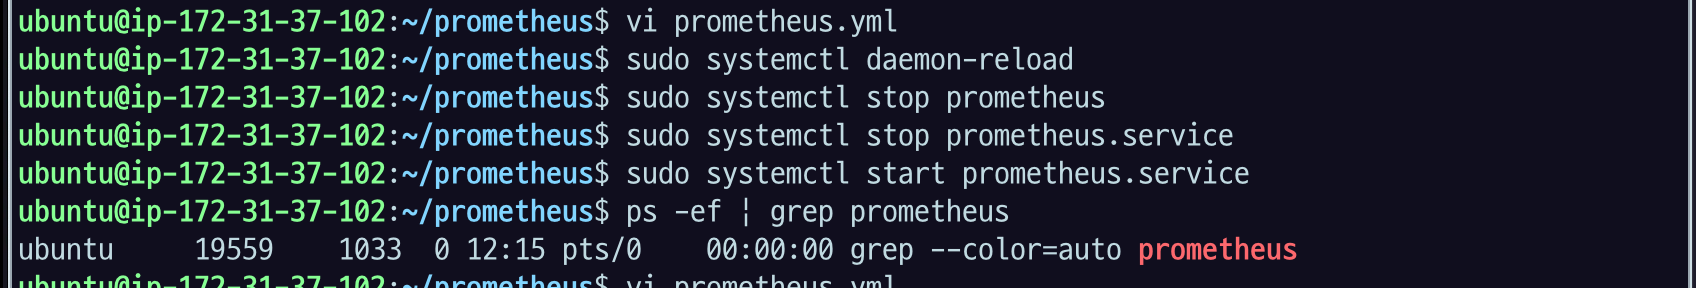
원래는 실행하면
--Web.console
--config.file
--web.enable
등 여러 개의 ps가 확인되어야 하는데
하나 밖에 나오지 않아서 당황했다...
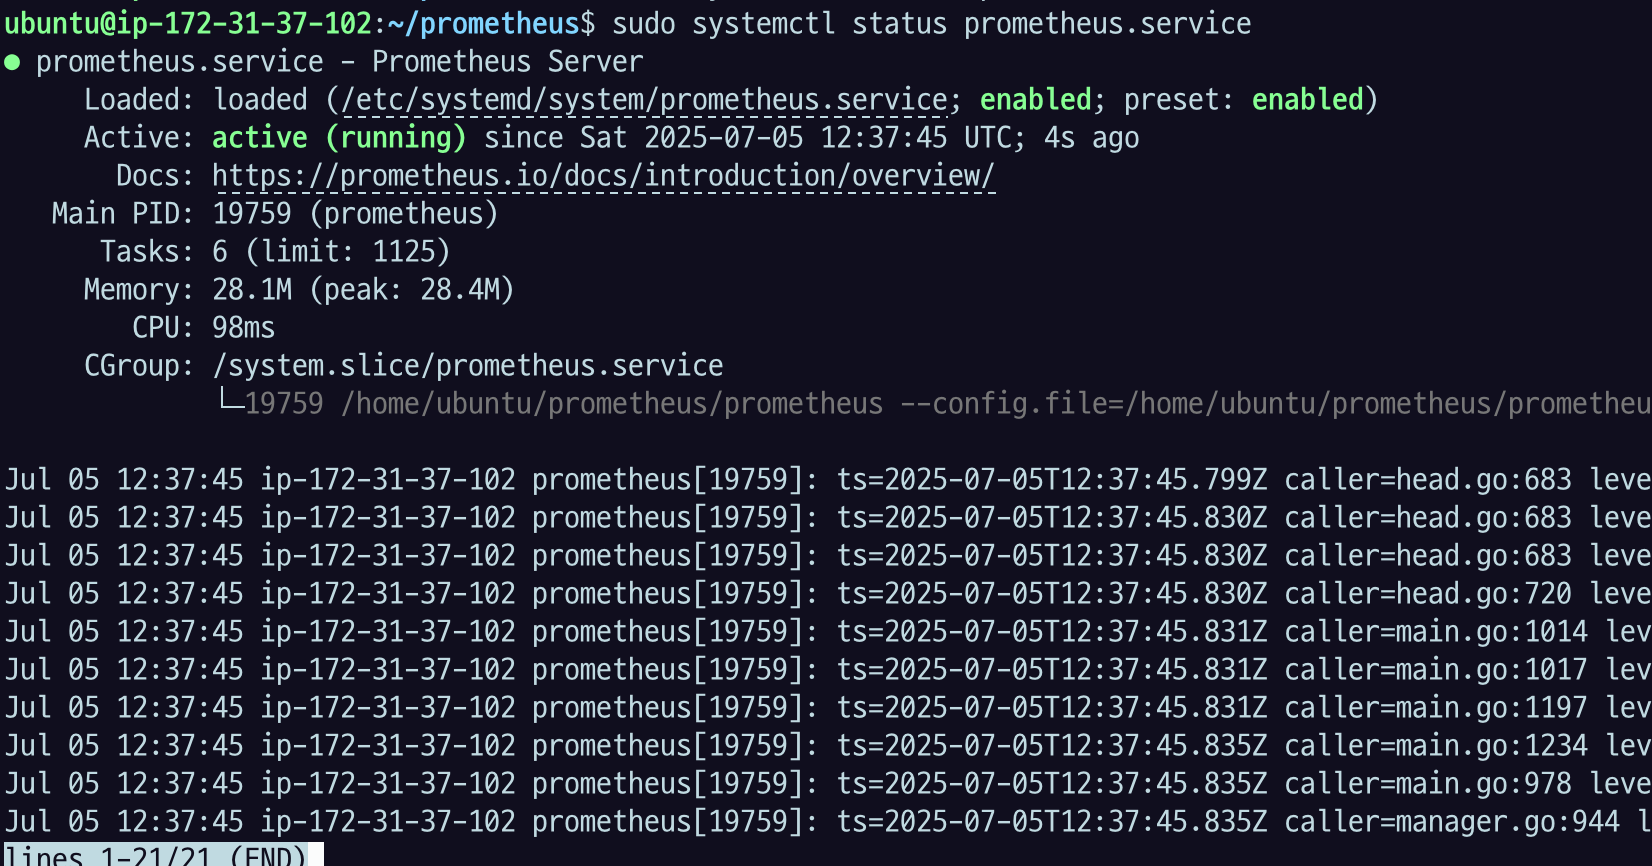
systemctl cat prometheus.servicesystemctl cat prometheus.service
# /etc/systemd/system/prometheus.service
[Unit]
Description=Prometheus Server
Documentation=https://prometheus.io/docs/introduction/overview/
Wants=network-online.target
After=network-online.target
[Service]
User=ubuntu
Group=ubuntu
Restart=on-failure
WorkingDirectory=/home/ubuntu/prometheus
ExecStart=/home/ubuntu/prometheus/prometheus \
--config.file=/home/ubuntu/prometheus/prometheus.yml \
--web.console.templates=/home/ubuntu/prometheus/consoles \
--web.console.libraries=/home/ubuntu/prometheus/console_libraries \
--web.enable-admin-api
[Install]
WantedBy=multi-user.targetservice 에는 문제 없이 적용되고 있는 것 같다.
로그로 자세하게 확인해보자
sudo journalctl -u prometheus.service --no-pager -n 50Jul 05 12:15:25 ip-172-31-37-102 prometheus[19534]: ts=2025-07-05T12:15:25.721Z caller=main.go:468 level=error msg="Error loading config (--config.file=/home/ubuntu/prometheus/prometheus.yml)" file=/home/ubuntu/prometheus/prometheus.yml err="parsing YAML file /home/ubuntu/prometheus/prometheus.yml: yaml: line 31: found character that cannot start any token"
Jul 05 12:15:25 ip-172-31-37-102 systemd[1]: prometheus.service: Main process exited, code=exited, status=2/INVALIDARGUMENT
Jul 05 12:15:25 ip-172-31-37-102 systemd[1]: prometheus.service: Failed with result 'exit-code'.
Jul 05 12:15:25 ip-172-31-37-102 systemd[1]: prometheus.service: Scheduled restart job, restart counter is at 2.
Jul 05 12:15:25 ip-172-31-37-102 systemd[1]: Started prometheus.service - Prometheus Server.
Jul 05 12:15:25 ip-172-31-37-102 prometheus[19540]: ts=2025-07-05T12:15:25.970Z caller=main.go:468 level=error msg="Error loading config (--config.file=/home/ubuntu/prometheus/prometheus.yml)" file=/home/ubuntu/prometheus/prometheus.yml err="parsing YAML file /home/ubuntu/prometheus/prometheus.yml: yaml: line 31: found character that cannot start any token"
Jul 05 12:15:25 ip-172-31-37-102 systemd[1]: prometheus.service: Main process exited, code=exited, status=2/INVALIDARGUMENT
Jul 05 12:15:25 ip-172-31-37-102 systemd[1]: prometheus.service: Failed with result 'exit-code'.
Jul 05 12:15:26 ip-172-31-37-102 systemd[1]: prometheus.service: Scheduled restart job, restart counter is at 3.
Jul 05 12:15:26 ip-172-31-37-102 systemd[1]: Started prometheus.service - Prometheus Server.
Jul 05 12:15:26 ip-172-31-37-102 prometheus[19546]: ts=2025-07-05T12:15:26.218Z caller=main.go:468 level=error msg="Error loading config (--config.file=/home/ubuntu/prometheus/prometheus.yml)" file=/home/ubuntu/prometheus/prometheus.yml err="parsing YAML file /home/ubuntu/prometheus/prometheus.yml: yaml: line 31: found character that cannot start any token"
Jul 05 12:15:26 ip-172-31-37-102 systemd[1]: prometheus.service: Main process exited, code=exited, status=2/INVALIDARGUMENT
Jul 05 12:15:26 ip-172-31-37-102 systemd[1]: prometheus.service: Failed with result 'exit-code'.
Jul 05 12:15:26 ip-172-31-37-102 systemd[1]: prometheus.service: Scheduled restart job, restart counter is at 4.
Jul 05 12:15:26 ip-172-31-37-102 systemd[1]: Started prometheus.service - Prometheus Server.
Jul 05 12:15:26 ip-172-31-37-102 prometheus[19552]: ts=2025-07-05T12:15:26.470Z caller=main.go:468 level=error msg="Error loading config (--config.file=/home/ubuntu/prometheus/prometheus.yml)" file=/home/ubuntu/prometheus/prometheus.yml err="parsing YAML file /home/ubuntu/prometheus/prometheus.yml: yaml: line 31: found character that cannot start any token"
Jul 05 12:15:26 ip-172-31-37-102 systemd[1]: prometheus.service: Main process exited, code=exited, status=2/INVALIDARGUMENT
Jul 05 12:15:26 ip-172-31-37-102 systemd[1]: prometheus.service: Failed with result 'exit-code'.
Jul 05 12:15:26 ip-172-31-37-102 systemd[1]: prometheus.service: Scheduled restart job, restart counter is at 5.
Jul 05 12:15:26 ip-172-31-37-102 systemd[1]: prometheus.service: Start request repeated too quickly.
Jul 05 12:15:26 ip-172-31-37-102 systemd[1]: prometheus.service: Failed with result 'exit-code'.
Jul 05 12:15:26 ip-172-31-37-102 systemd[1]: Failed to start prometheus.service - Prometheus Server.
Jul 05 12:23:15 ip-172-31-37-102 systemd[1]: Started prometheus.service - Prometheus Server.
Jul 05 12:23:15 ip-172-31-37-102 prometheus[19628]: ts=2025-07-05T12:23:15.201Z caller=main.go:468 level=error msg="Error loading config (--config.file=/home/ubuntu/prometheus/prometheus.yml)" file=/home/ubuntu/prometheus/prometheus.yml err="parsing YAML file /home/ubuntu/prometheus/prometheus.yml: yaml: line 31: found character that cannot start any token"
Jul 05 12:23:15 ip-172-31-37-102 systemd[1]: prometheus.service: Main process exited, code=exited, status=2/INVALIDARGUMENT
Jul 05 12:23:15 ip-172-31-37-102 systemd[1]: prometheus.service: Failed with result 'exit-code'.
Jul 05 12:23:15 ip-172-31-37-102 systemd[1]: prometheus.service: Scheduled restart job, restart counter is at 1.
Jul 05 12:23:15 ip-172-31-37-102 systemd[1]: Started prometheus.service - Prometheus Server.
Jul 05 12:23:15 ip-172-31-37-102 prometheus[19634]: ts=2025-07-05T12:23:15.474Z caller=main.go:468 level=error msg="Error loading config (--config.file=/home/ubuntu/prometheus/prometheus.yml)" file=/home/ubuntu/prometheus/prometheus.yml err="parsing YAML file /home/ubuntu/prometheus/prometheus.yml: yaml: line 31: found character that cannot start any token"
Jul 05 12:23:15 ip-172-31-37-102 systemd[1]: prometheus.service: Main process exited, code=exited, status=2/INVALIDARGUMENT
Jul 05 12:23:15 ip-172-31-37-102 systemd[1]: prometheus.service: Failed with result 'exit-code'.
Jul 05 12:23:15 ip-172-31-37-102 systemd[1]: prometheus.service: Scheduled restart job, restart counter is at 2.
Jul 05 12:23:15 ip-172-31-37-102 systemd[1]: Started prometheus.service - Prometheus Server.
Jul 05 12:23:15 ip-172-31-37-102 prometheus[19640]: ts=2025-07-05T12:23:15.724Z caller=main.go:468 level=error msg="Error loading config (--config.file=/home/ubuntu/prometheus/prometheus.yml)" file=/home/ubuntu/prometheus/prometheus.yml err="parsing YAML file /home/ubuntu/prometheus/prometheus.yml: yaml: line 31: found character that cannot start any token"
Jul 05 12:23:15 ip-172-31-37-102 systemd[1]: prometheus.service: Main process exited, code=exited, status=2/INVALIDARGUMENT
Jul 05 12:23:15 ip-172-31-37-102 systemd[1]: prometheus.service: Failed with result 'exit-code'.
Jul 05 12:23:15 ip-172-31-37-102 systemd[1]: prometheus.service: Scheduled restart job, restart counter is at 3.
Jul 05 12:23:15 ip-172-31-37-102 systemd[1]: Started prometheus.service - Prometheus Server.
Jul 05 12:23:15 ip-172-31-37-102 prometheus[19646]: ts=2025-07-05T12:23:15.972Z caller=main.go:468 level=error msg="Error loading config (--config.file=/home/ubuntu/prometheus/prometheus.yml)" file=/home/ubuntu/prometheus/prometheus.yml err="parsing YAML file /home/ubuntu/prometheus/prometheus.yml: yaml: line 31: found character that cannot start any token"
Jul 05 12:23:15 ip-172-31-37-102 systemd[1]: prometheus.service: Main process exited, code=exited, status=2/INVALIDARGUMENT
Jul 05 12:23:15 ip-172-31-37-102 systemd[1]: prometheus.service: Failed with result 'exit-code'.
Jul 05 12:23:16 ip-172-31-37-102 systemd[1]: prometheus.service: Scheduled restart job, restart counter is at 4.
Jul 05 12:23:16 ip-172-31-37-102 systemd[1]: Started prometheus.service - Prometheus Server.
Jul 05 12:23:16 ip-172-31-37-102 prometheus[19652]: ts=2025-07-05T12:23:16.222Z caller=main.go:468 level=error msg="Error loading config (--config.file=/home/ubuntu/prometheus/prometheus.yml)" file=/home/ubuntu/prometheus/prometheus.yml err="parsing YAML file /home/ubuntu/prometheus/prometheus.yml: yaml: line 31: found character that cannot start any token"
Jul 05 12:23:16 ip-172-31-37-102 systemd[1]: prometheus.service: Main process exited, code=exited, status=2/INVALIDARGUMENT
Jul 05 12:23:16 ip-172-31-37-102 systemd[1]: prometheus.service: Failed with result 'exit-code'.
Jul 05 12:23:16 ip-172-31-37-102 systemd[1]: prometheus.service: Scheduled restart job, restart counter is at 5.
Jul 05 12:23:16 ip-172-31-37-102 systemd[1]: prometheus.service: Start request repeated too quickly.
Jul 05 12:23:16 ip-172-31-37-102 systemd[1]: prometheus.service: Failed with result 'exit-code'.
Jul 05 12:23:16 ip-172-31-37-102 systemd[1]: Failed to start prometheus.service - Prometheus Server.문제 요약
YAML 문법 오류 → Prometheus 설정 파일 읽기 실패 → 서비스 시작 실패 → 재시작 무한 반복
YAML은 들여쓰기(스페이스)와 콜론(:) 뒤에 공백 등 문법에 매우 민감하다..;;
prometheus.yml 에서 들여쓰기가 잘못된 모양이다.
  - job_name: 'pushgateway'
        honor_labels: true
        static_configs:
                - targets: ['localhost:9091']
job_name 다음 줄 들여쓰기가 2칸이어야 하는데 8칸 이상 되어있고,
honor_labels와 static_configs 들여쓰기가 맞지 않아 YAML 파서가 오류를 일으킴.
하.. 팍씨 드디어 됐네
- prometheus 서버의 graph 에서 some_metric. 이 조회되는지 확인.
이제 아까 있던 prometheus 서버에 들어가서 새로고침을 해주고
mac 에서 다시 curl을 날려주자.
echo "some_metric 3.14" | curl -XPOST --data-binary @- http://$YOUR_IP:9091/metrics/job/some_job아까 push 한 metric의 이름인

pushgateway에서 some_job 에 some_metric 이 들어온 걸 확인할 수 있다.
그 다음 15초 있다가 프로메테우스가 스크랩을 했을 것.
프로메테우스에 들어가서 확인해보면 some_metric이 추가된 걸 볼 수 있다.
execute 로 실행하면
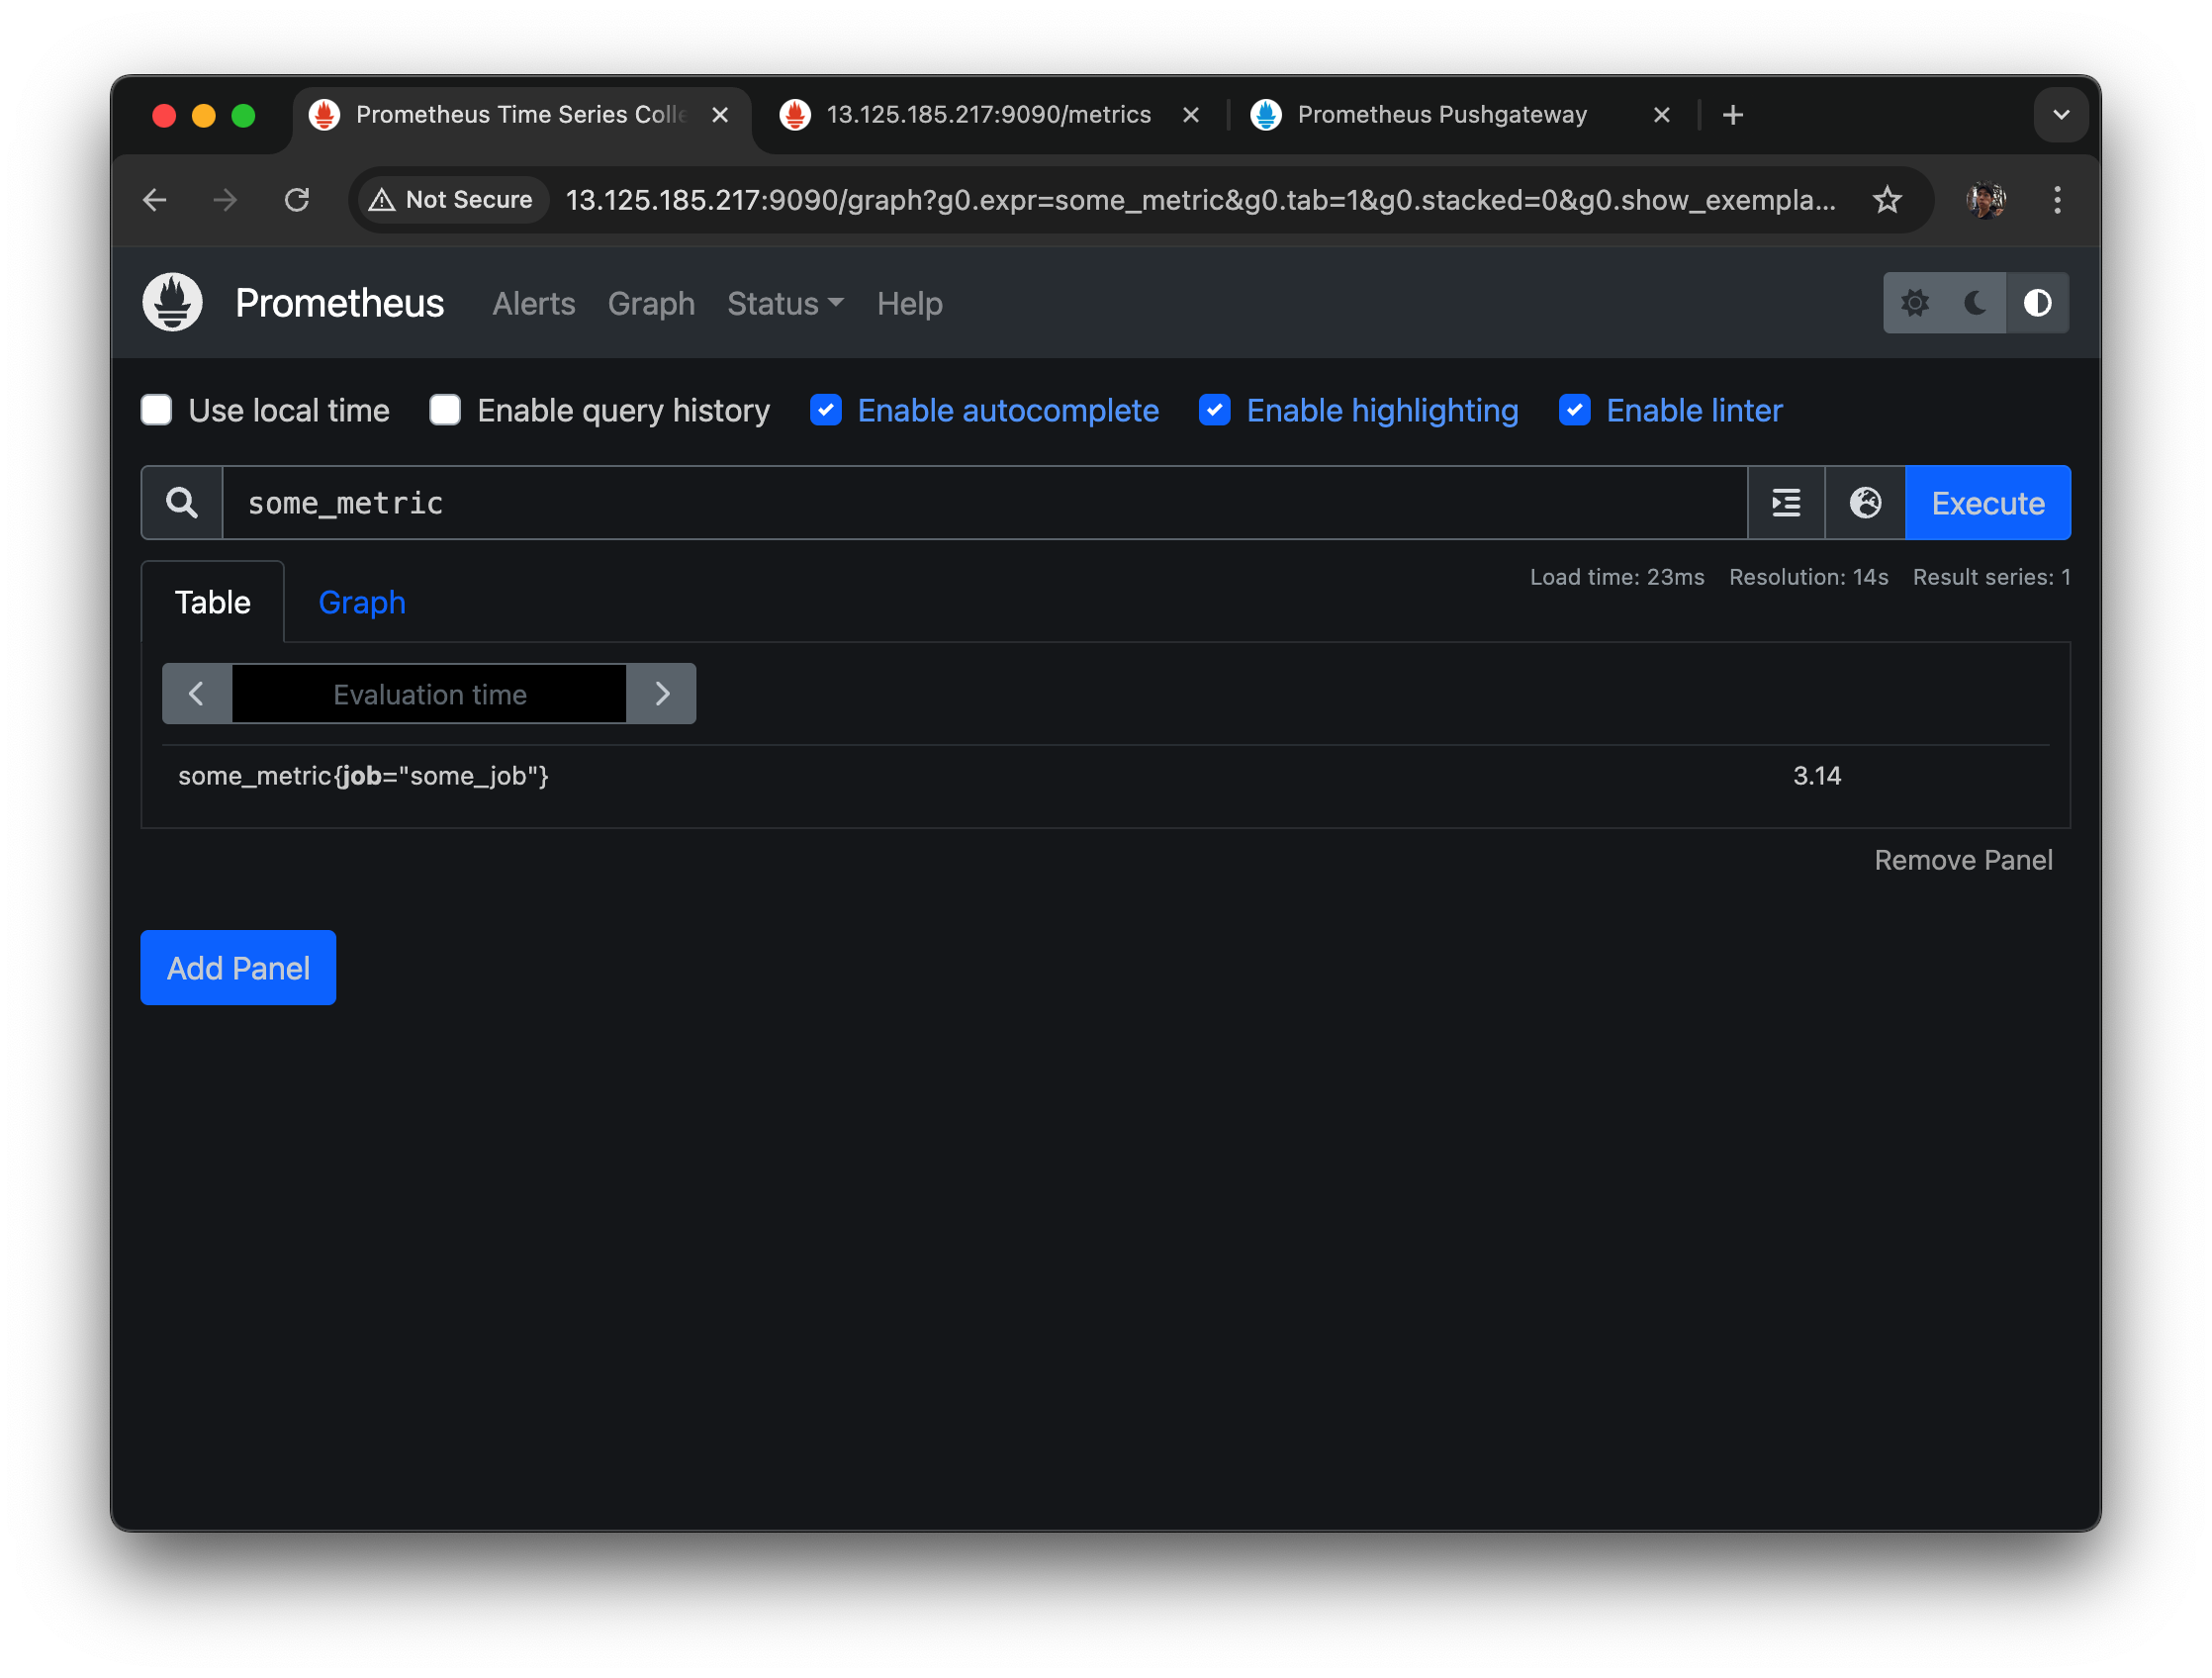
some_metric의 job 에는 some_job 이 들어왔고
value 3.14 까지 잘 나온 것을 확인할 수 있다.
지금까지
1. 프로메테우스를 세팅하고
2. 프로메테우스를 systemctl로 등록하고
3. 직접 푸시해줄 수 있는 pushgateway 설치하고
4. systemctl로 등록하고
5. 프로메테우스가 푸시 게이트웨이가 가지고 있는 정보를 스크랩할 수 있도록 설정을 했다.