2 Grafana 설치하기
2.1 다운로드 및 설치
다운로드 링크
wget https://dl.grafana.com/oss/release/grafana-9.3.1.linux-amd64.tar.gz
tar -zxvf grafana-9.3.1.linux-amd64.tar.gz
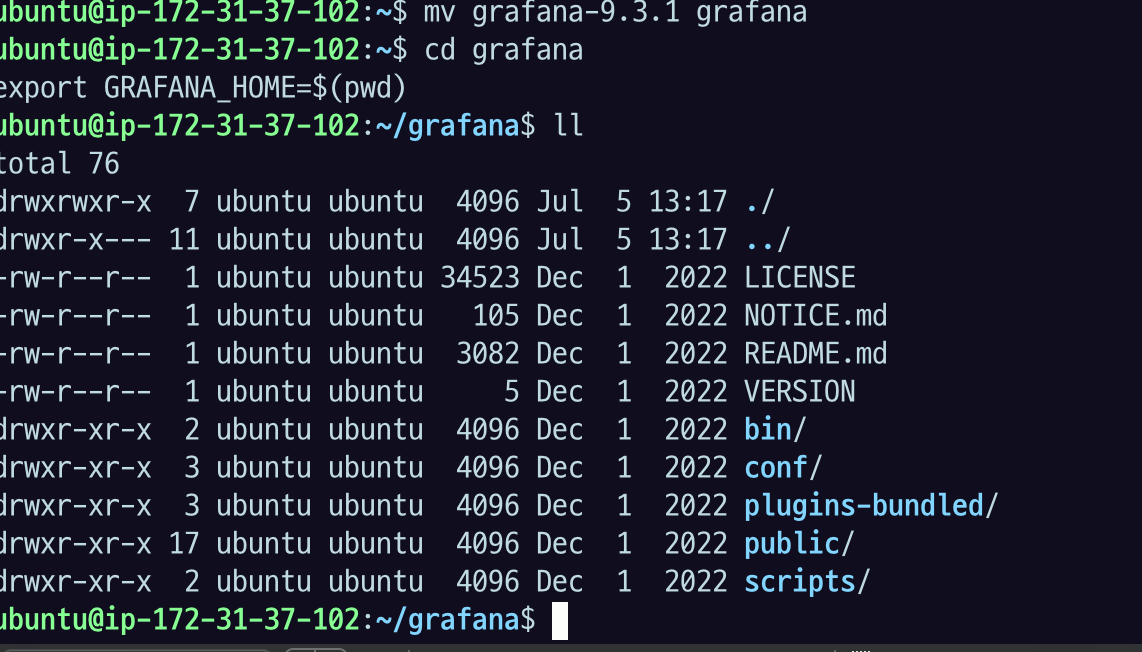
mv grafana-9.3.1 grafana
cd grafana
export GRAFANA_HOME=$(pwd)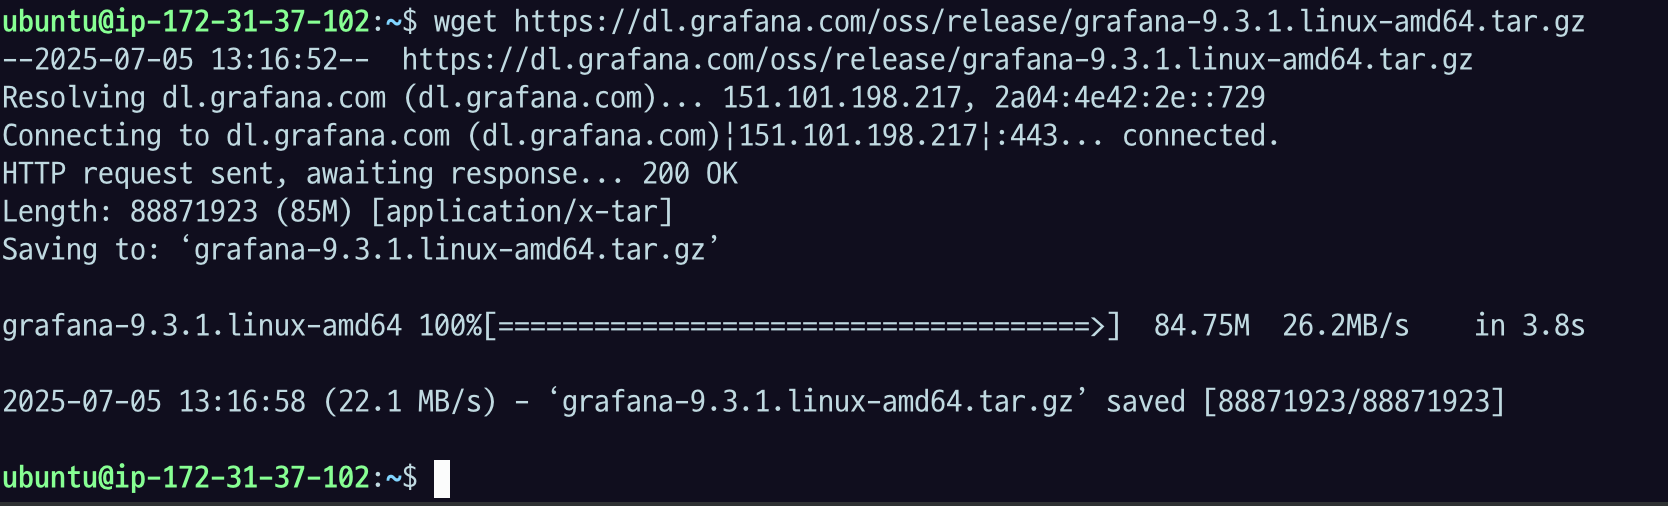
Grafana는 metadata 저장소로 다음 데이터베이스를 필요로한다.
다운로드 받은 패키지에 기본적으로 SQLite 를 쓰도록 되어있다.
만약 회사용으로 쓰겠다? mysql이나 postgreSQL 를 검토하면 됨.
2.2 SMTP 설치 및 앱 비밀번호 세팅
2.2.1 SMTP 설치 및 세팅
email noti 를 위해 ssmtp 설치
sudo apt install ssmtp -ysudo vi /etc/ssmtp/ssmtp.confuser=noreply
root=$your_account@gmail.com
mailhub=smtp.gmail.com:587
hostname=$your_host
FromLineOverride=YES
AuthUser=$your_account@gmail.com
AuthPass=$your_apppassword
UseTLS=YES
UseSTARTTLS=YES- google 서버를 통한 email 전송 설정이다.
- $your_account 에 자신의 email 계정을 넣는다.
- google 에서 자신의 계정에서 app password 를 발급받아서 AuthPass =
$your_apppassword에 세팅한다.- app password 발급방법
- 보안때문에 실습에서 다루지 않는다.
echo 'test' | ssmtp $your_receiver_account@gmail.com- your_receiver_account 계정으로 test 라는 제목의 이메일이 와있으면 성공이다.
여러 명에게 제목 포함으로 보내기
(
echo "To: user1@example.com, user2@example.com"
echo "From: noreply@gmail.com"
echo "Subject: [알림] 백업 완료"
echo
echo "오늘 백업이 정상적으로 완료되었습니다."
) | ssmtp user1@example.com user2@example.com
2.2.2 Grafana에 smtp 설정
default.ini 를 수정한다.
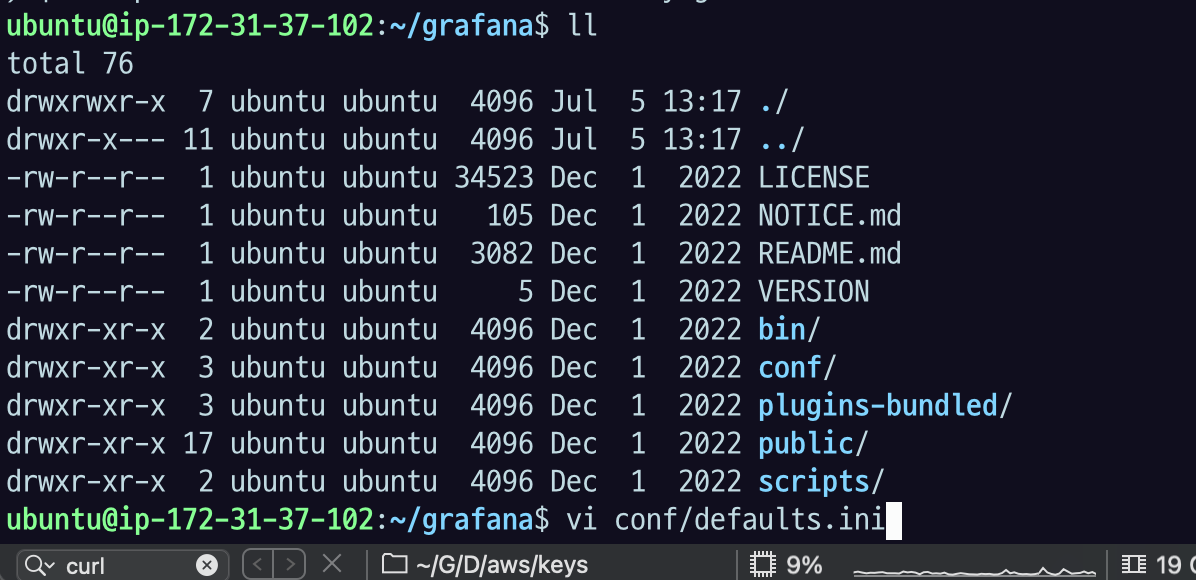
여기서 SMTP 라고 검색하면 이렇게 나온다.
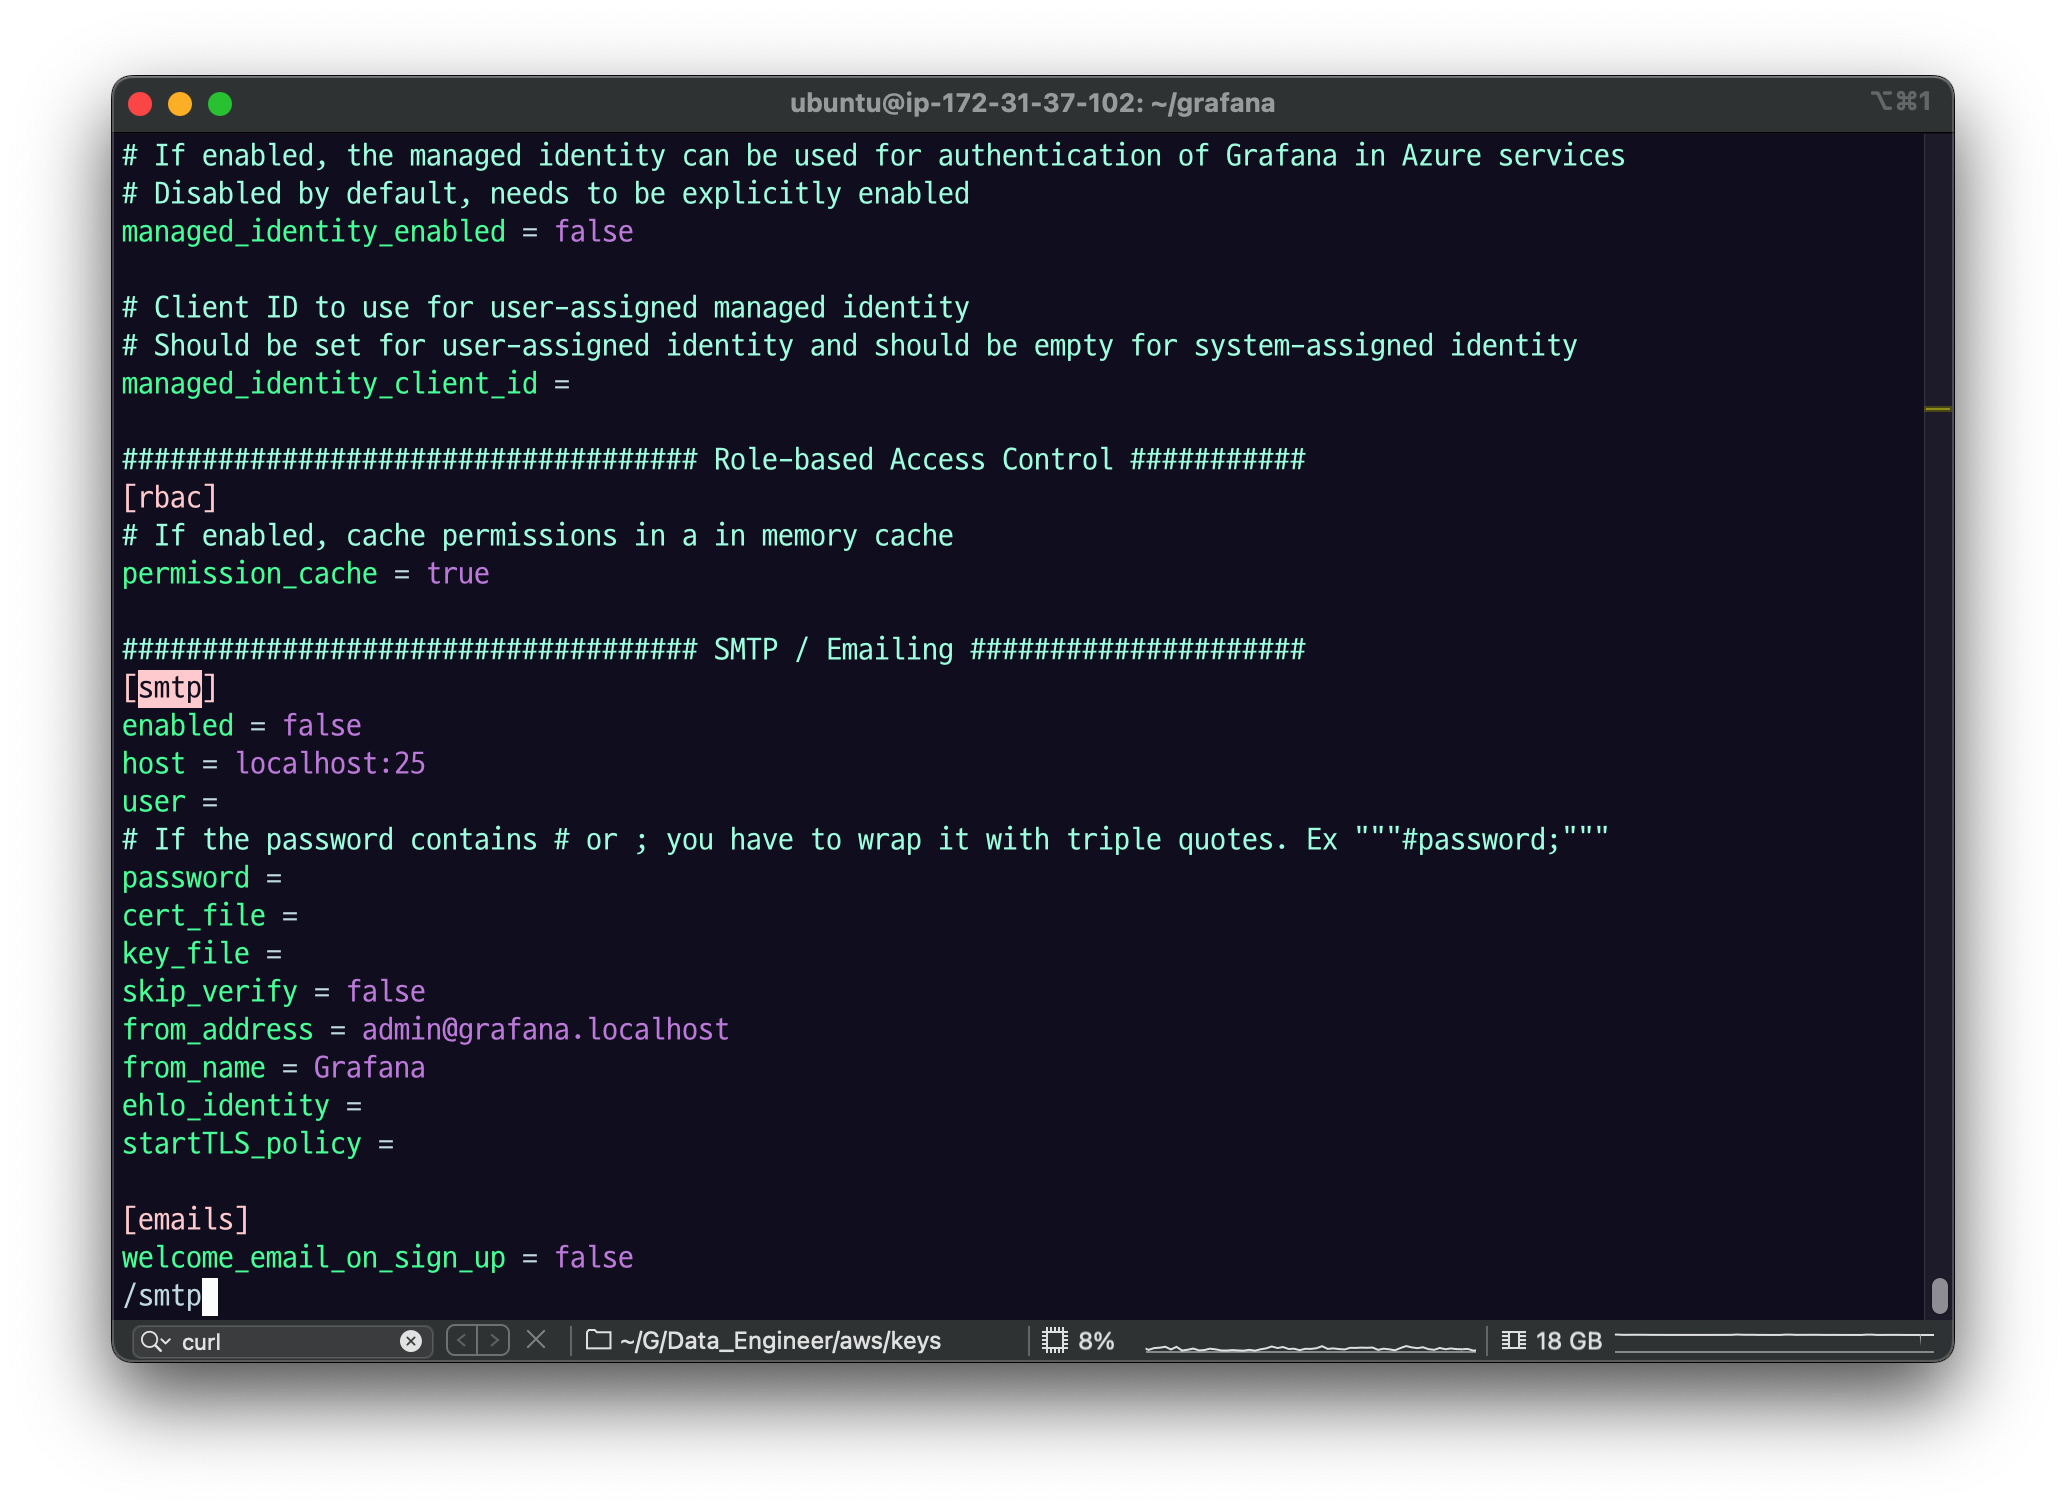
여기다가 아까 만들었던 user, password를 Grafana에 넣어 설정해주면 된다.
[smtp] 섹션에 2.2 에서 세팅한 smtp 정보를 넣는다.
enabled = true
host = smtp.gmail.com:587
user = $your_account@gmail.com
# If the password contains # or ; you have to wrap it with triple quotes. Ex """#password;"""
password = $your_app_password
;cert_file =
;key_file =
skip_verify = true
from_address = $your_account@gmail.com
from_name = Grafana # what you want
;ehlo_identity =
;startTLS_policy =;: 세미콜론은 사용하지 않는 설정이다.
-$your_account, $your_app_password 는 2.2 에서 세팅한 주소를 넣는다.
skip_verify = true 를 하지 않으면 어떻게 될까?
verify 하느라 귀찮아질 듯?
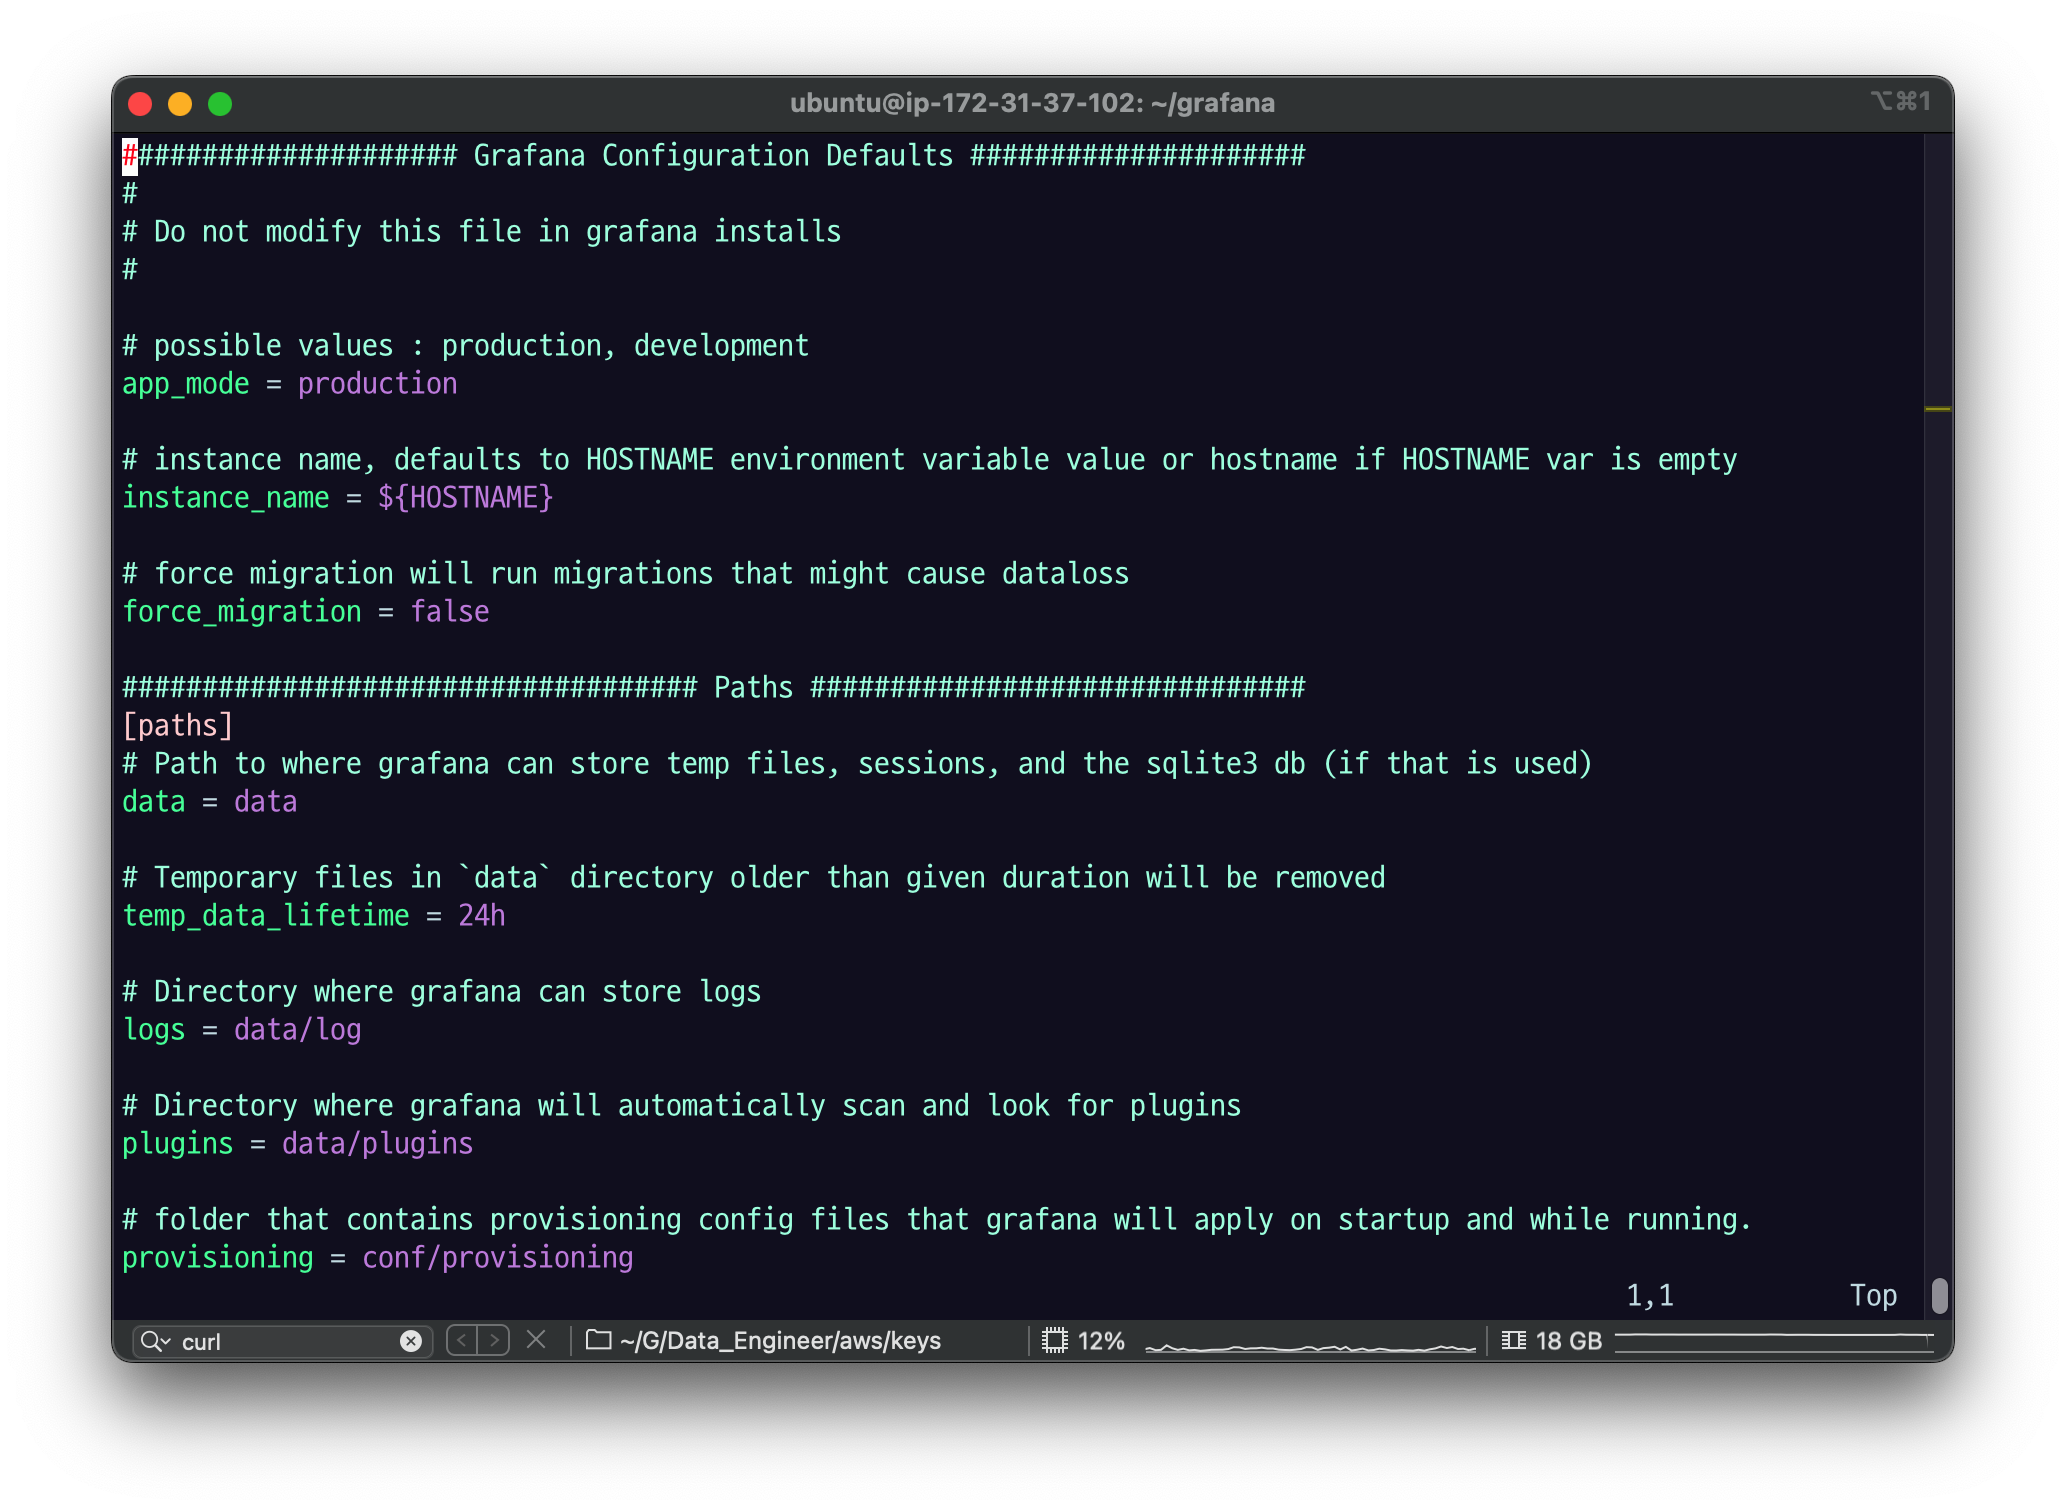
2.3 설정파일
conf/default.ini 파일에 기본 설정이 있다.
-
번들된 SQLite 3 를 쓰도록 되어있다. (admin)
- port
-
port 3000
2.4 실행
./bin/grafana-server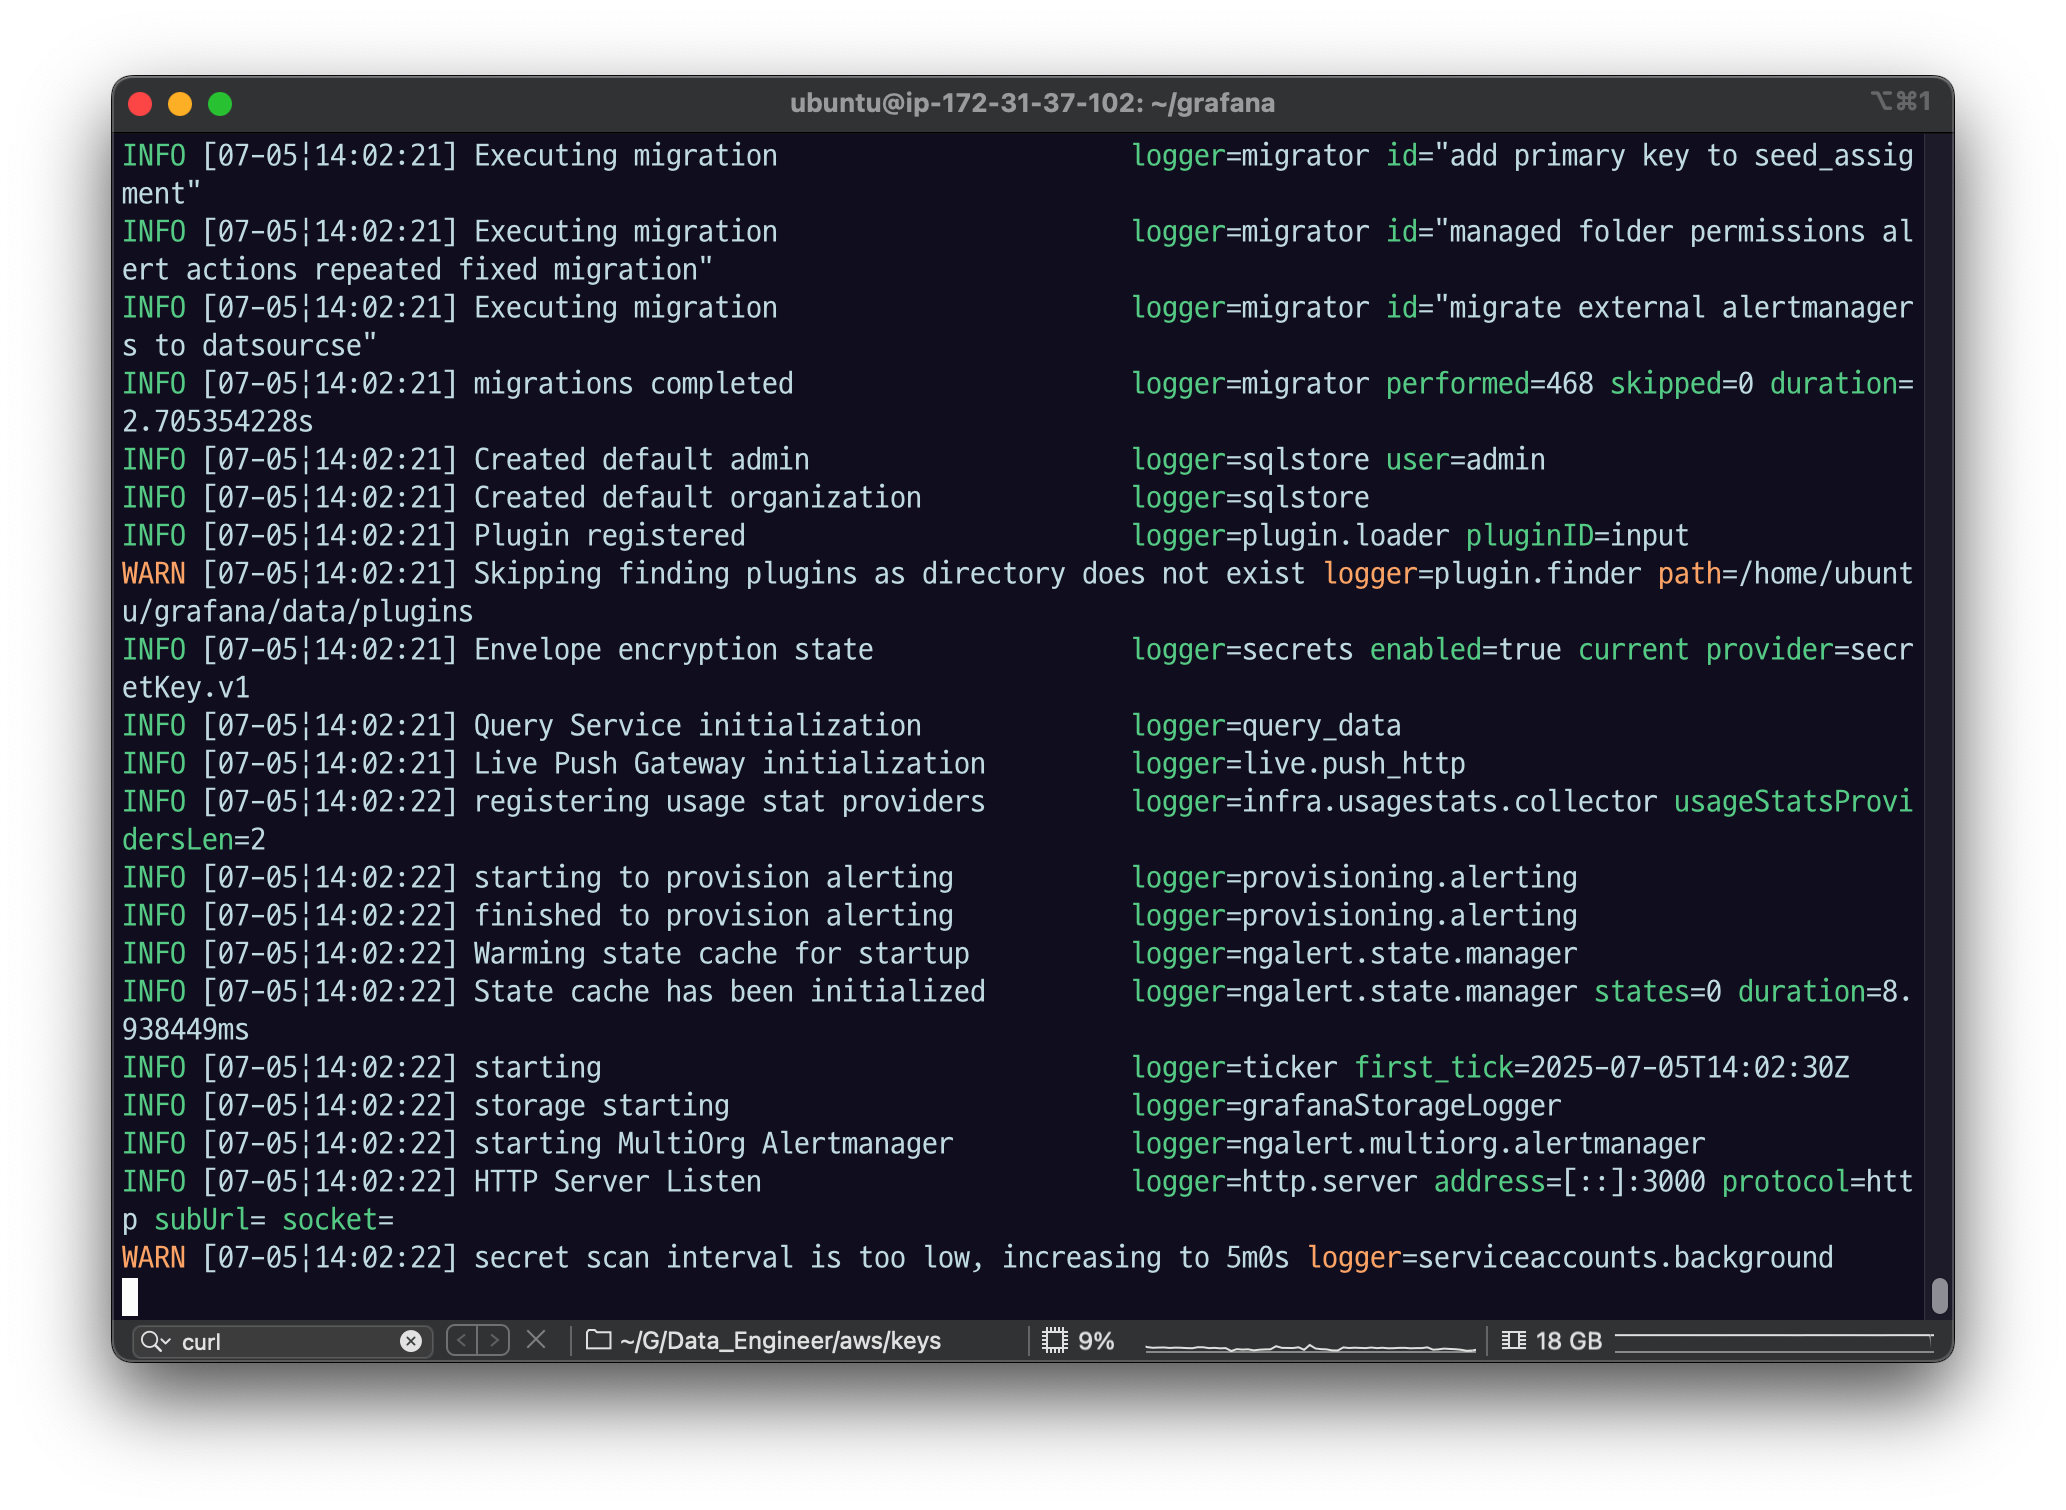
이렇게 되는데
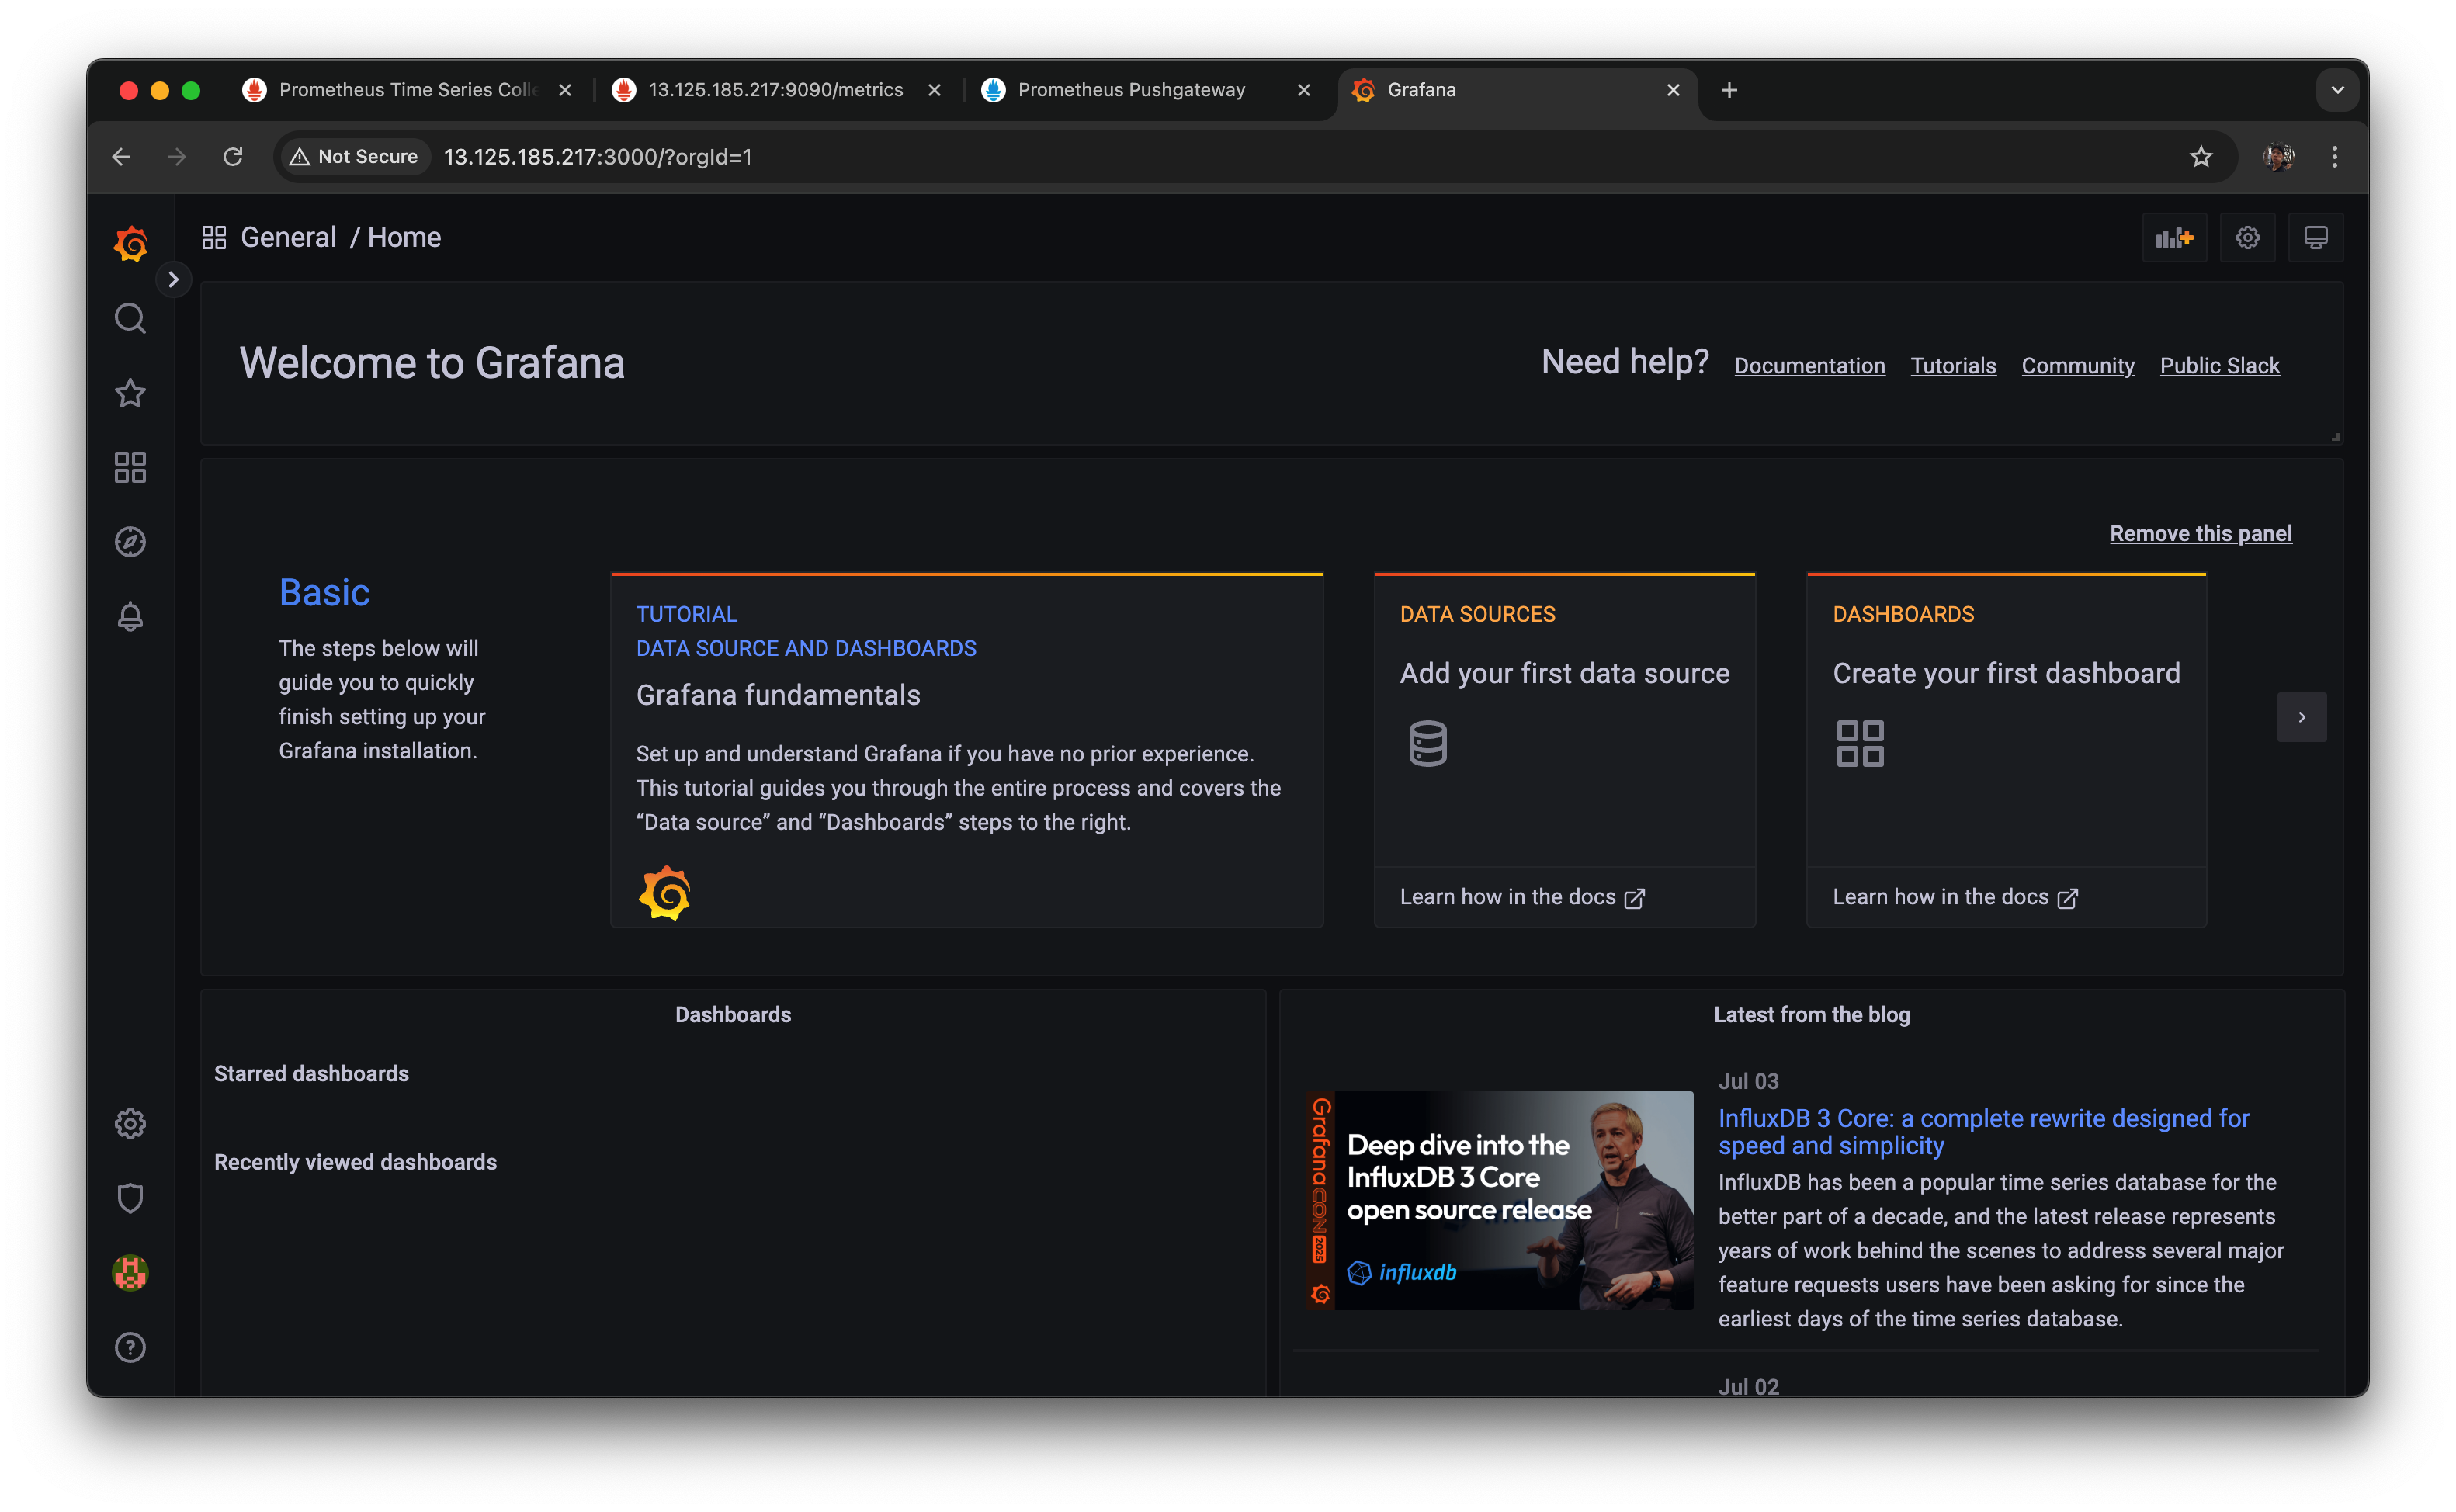
- $IP:3000 으로 접속할 수 있다.
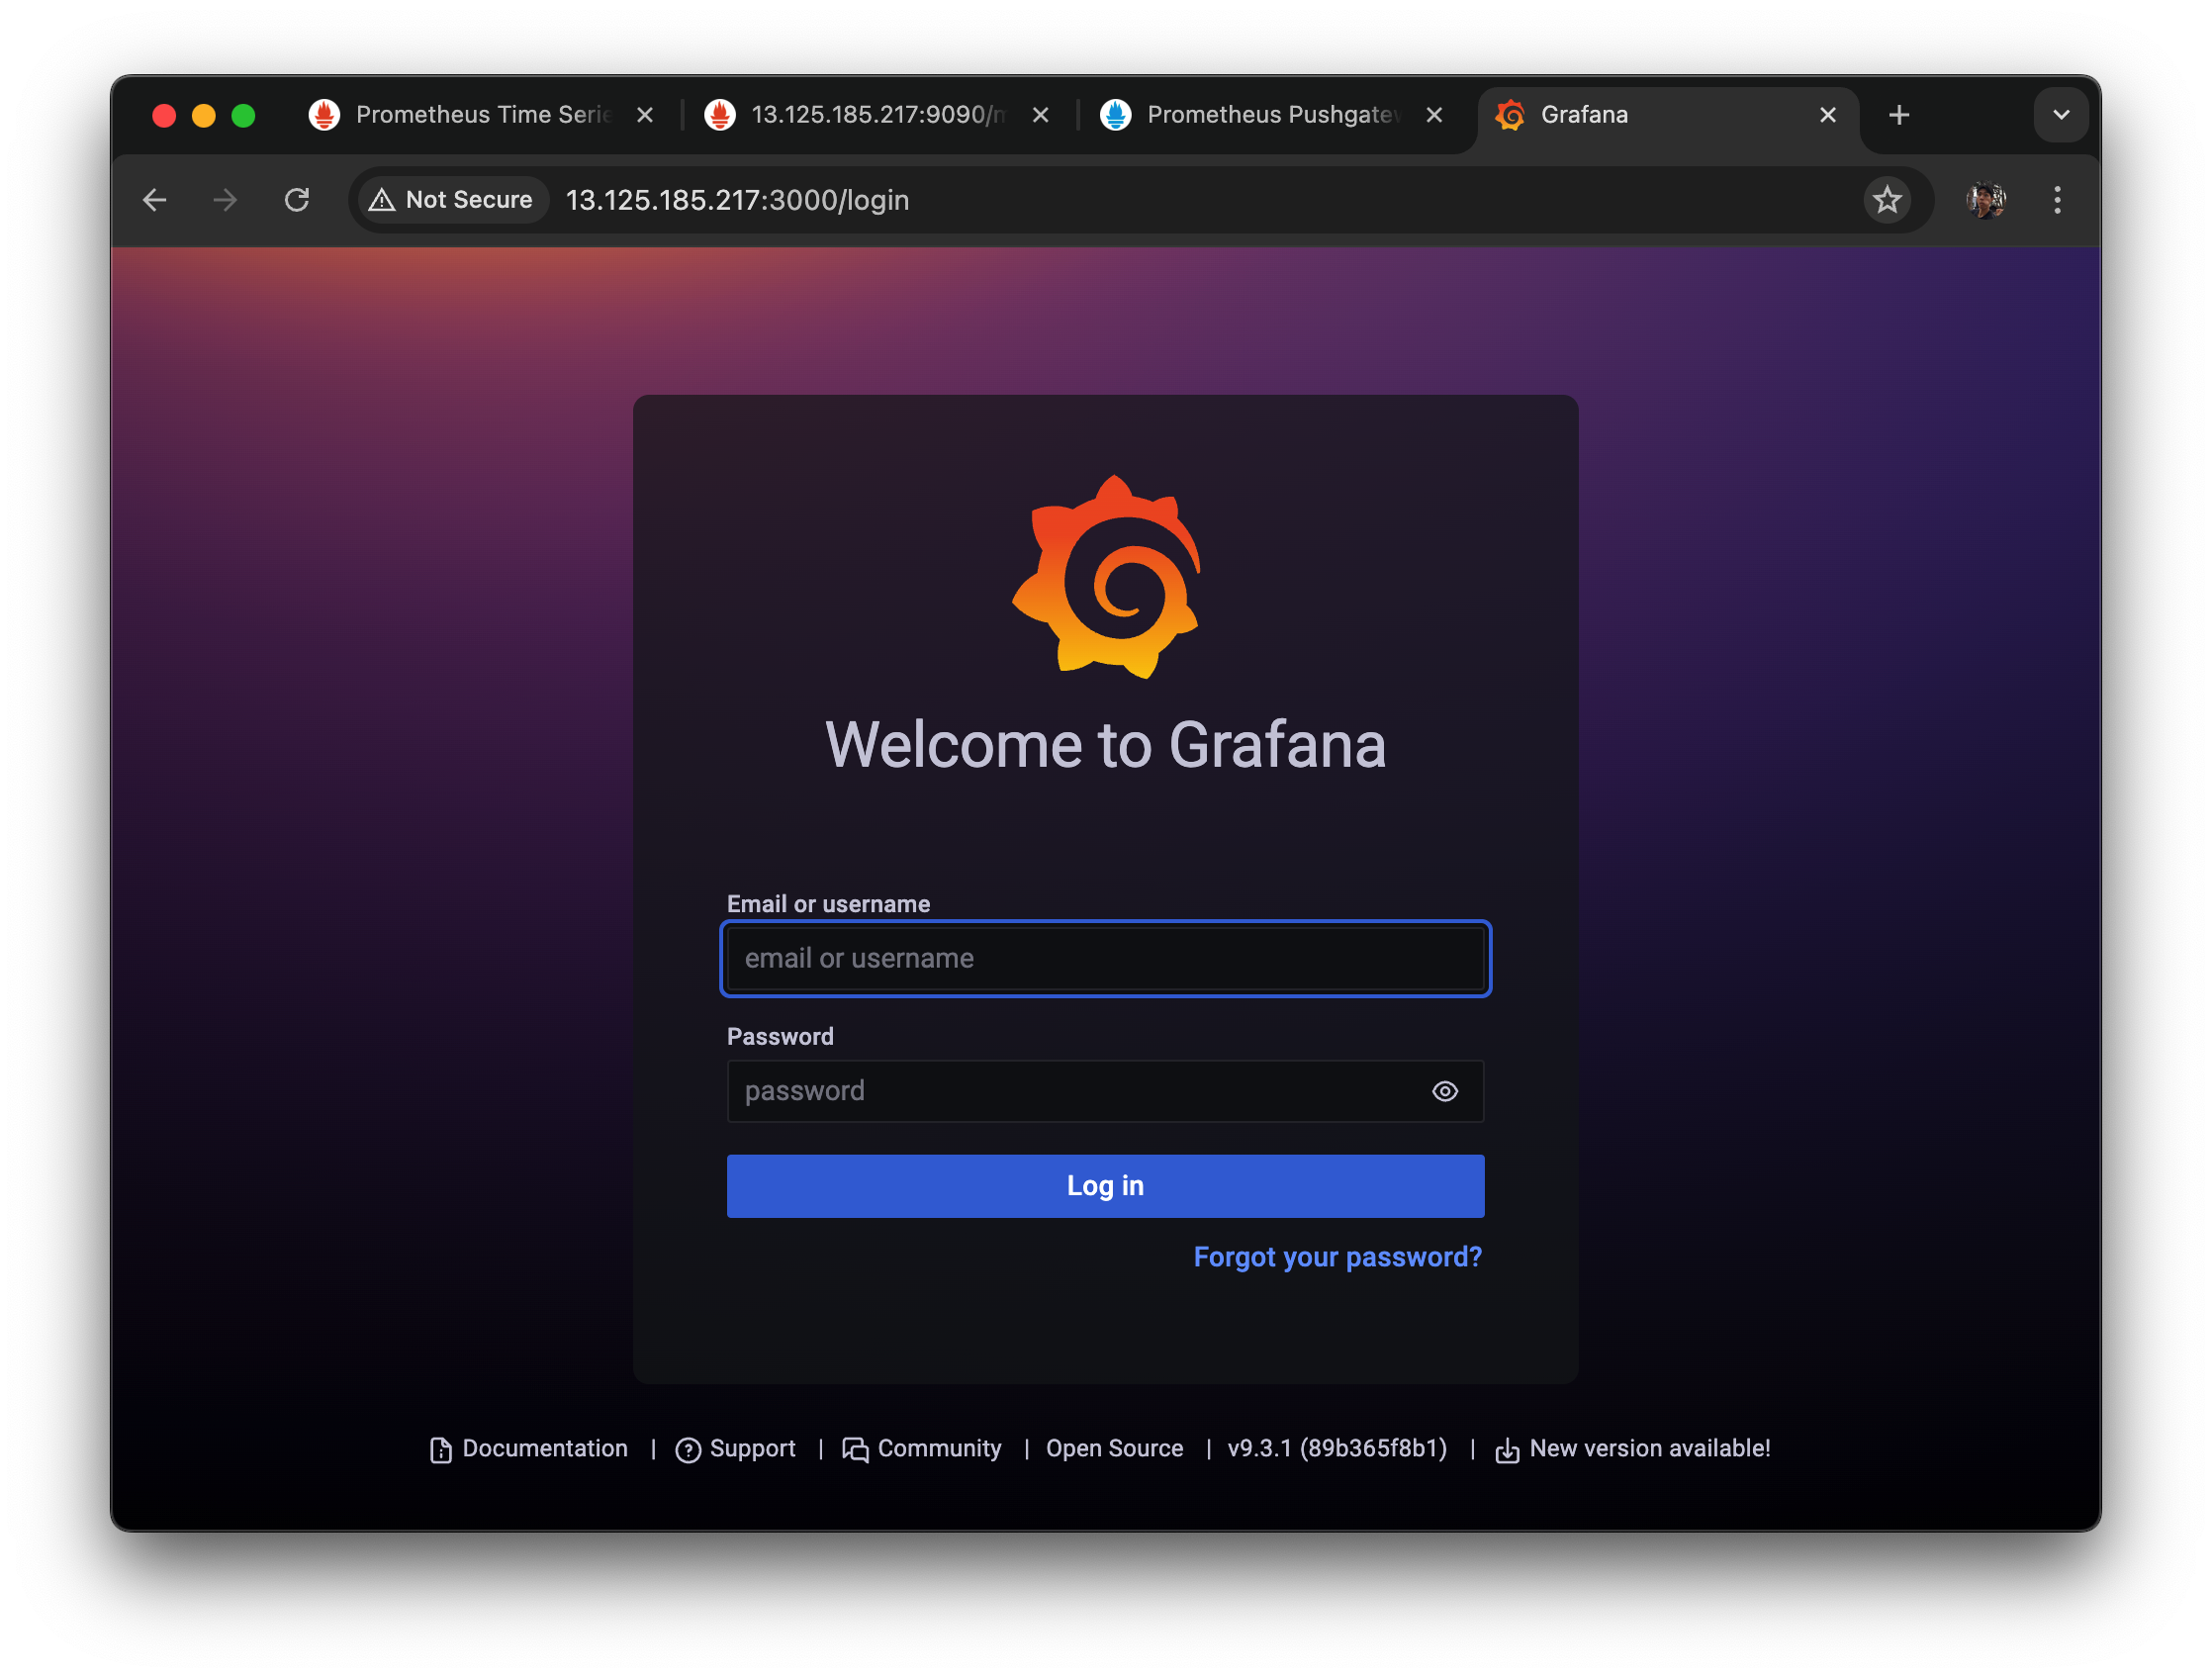
이런 화면 뜨면 설치가 잘 된 것.
email or username,Password 기본이
admin,admin 으로 되어 있다. 실습에서는 스킵하지만
사용할 때는 설정 바꿔서 사용하면 됨.
로그인 해서 들어가면 이런 화면이 나올 것.

2.5 systemctl 로 등록
systemctl로 등록해서 자동으로 띄워져 있게 해보자.
우선 ctrl+ c 로 종료하고
sudo vi /etc/systemd/system/grafana.service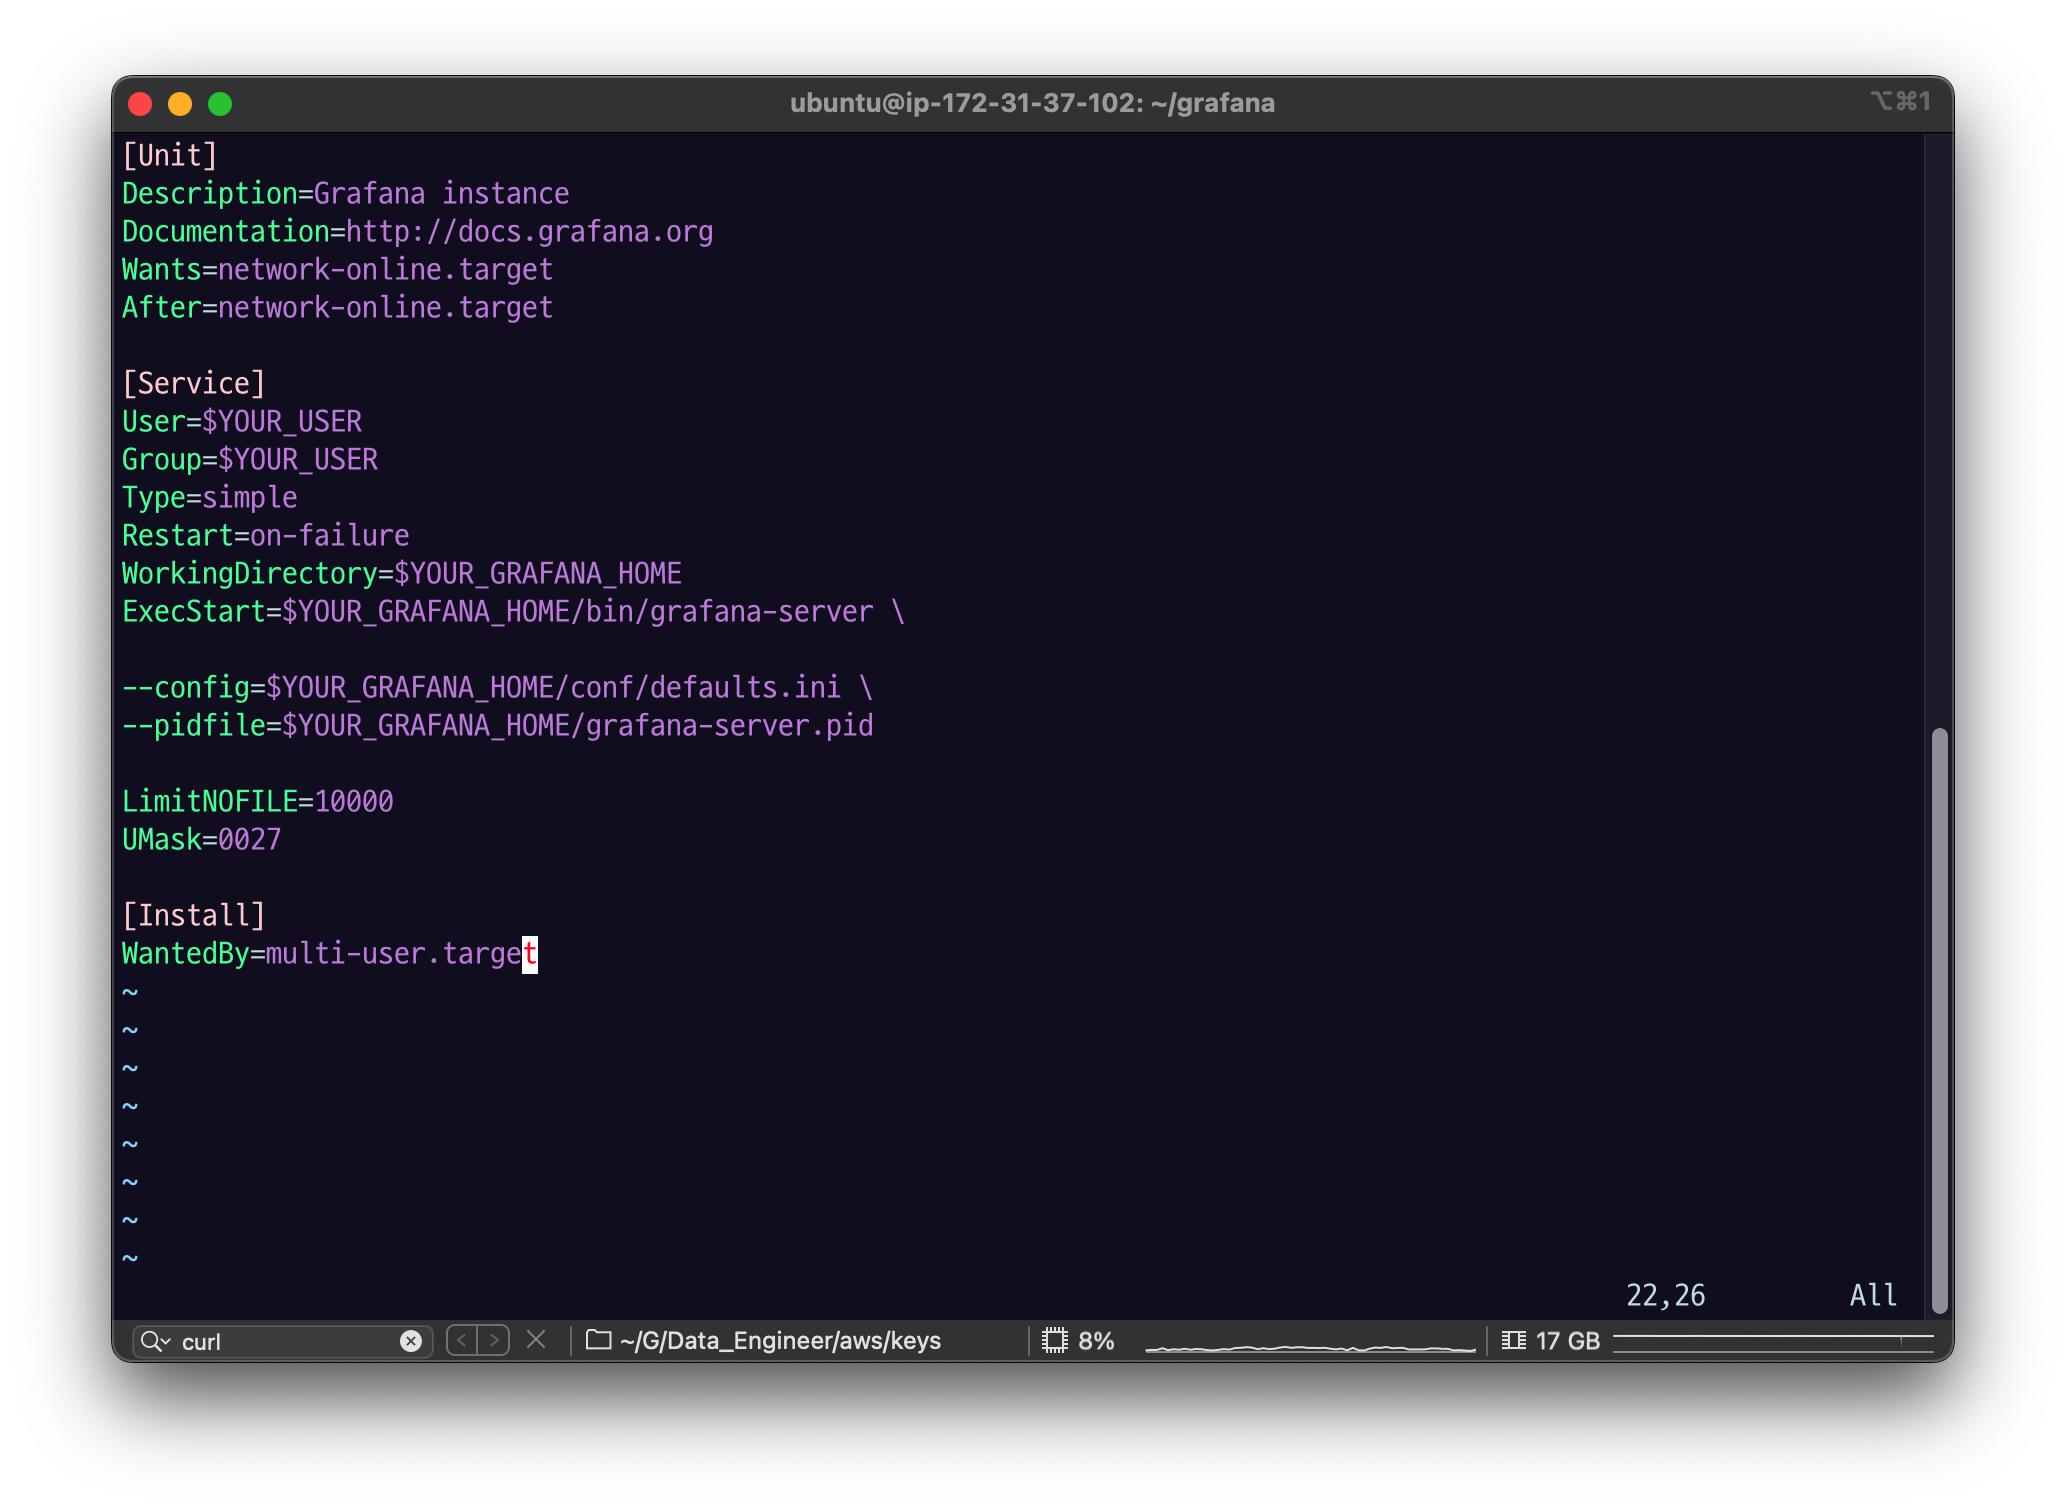
[Unit]
Description=Grafana instance
Documentation=http://docs.grafana.org
Wants=network-online.target
After=network-online.target

[Service]
User=$YOUR_USER
Group=$YOUR_USER
Type=simple
Restart=on-failure
WorkingDirectory=$YOUR_GRAFANA_HOME
ExecStart=$YOUR_GRAFANA_HOME/bin/grafana-server \

--config=$YOUR_GRAFANA_HOME/conf/defaults.ini \
--pidfile=$YOUR_GRAFANA_HOME/grafana-server.pid

LimitNOFILE=10000
UMask=0027

[Install]
WantedBy=multi-user.target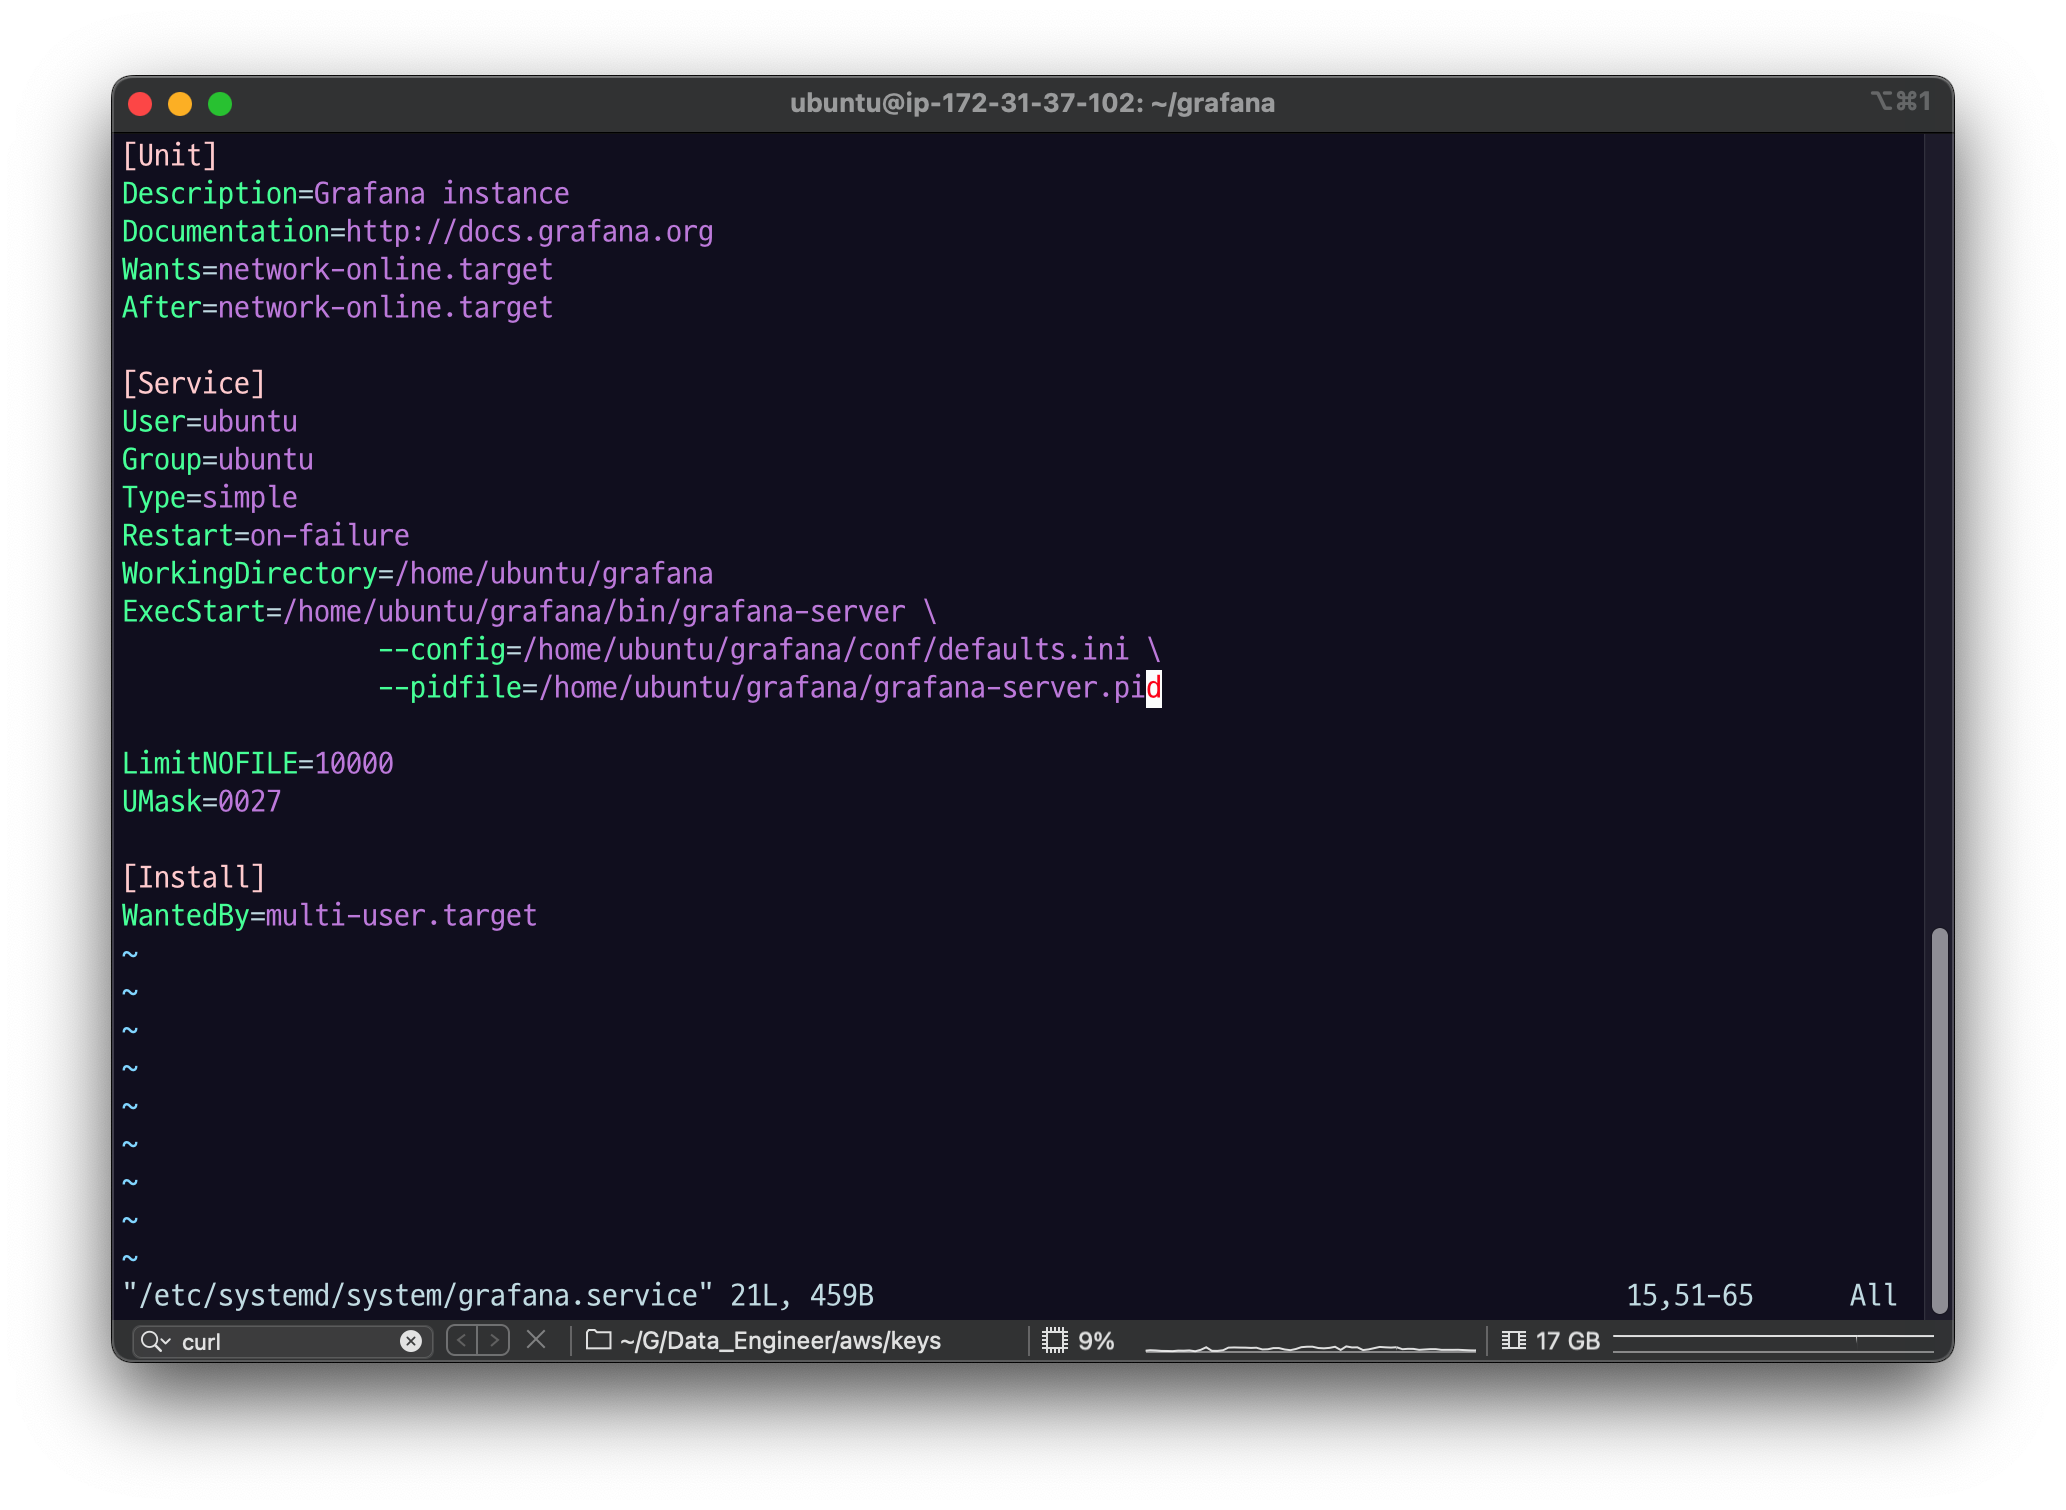
- $YOUR_GRAFANA_HOME 을 자신의 경로에 맞게 수정한다.
- $YOUR_USER 도 자신이 사용할 유저에 맞게 수정한다. $YOUR_GRAFANA_HOME 에 대한 소유권한 ( chown )이 $YOUR_USER에게 있어야 한다.
등록
sudo systemctl daemon-reloadsudo systemctl enable grafana.service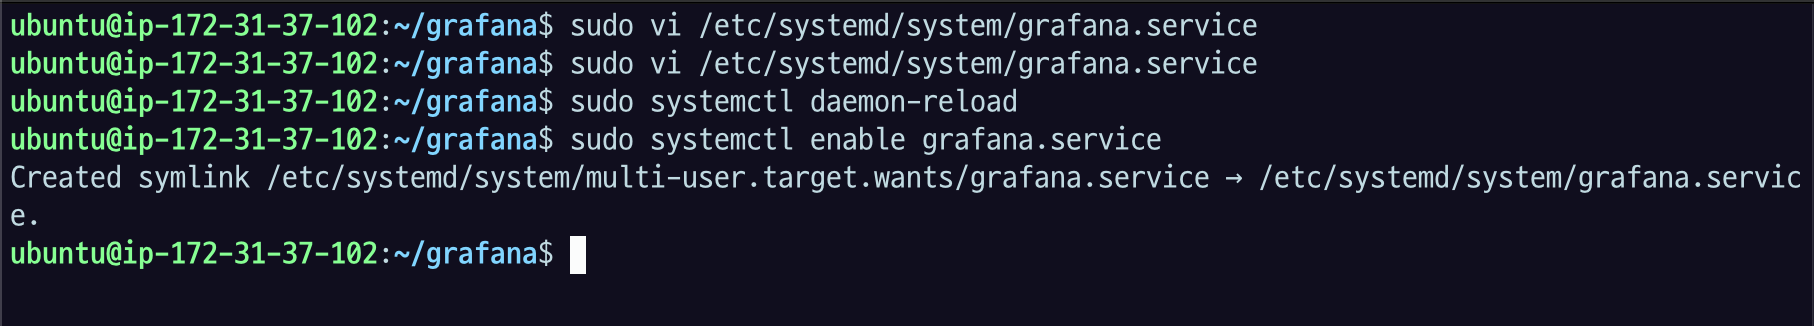
systemctl로 pushgateway 시작
sudo systemctl start grafana.serviceps -ef | grep grafana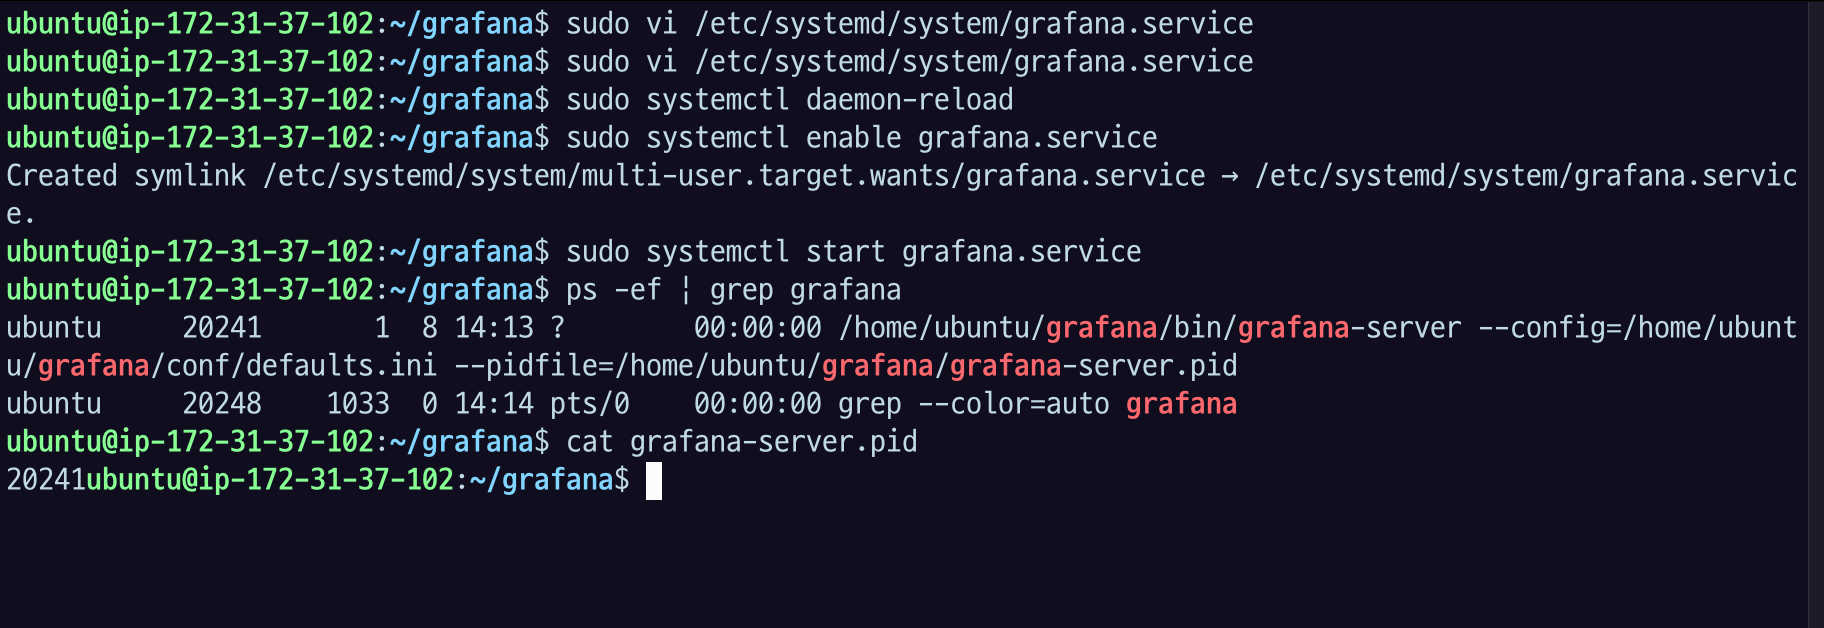
새로고침해서 다시 접속을 해도 접속이 잘 되는 것을 볼 수 있다.

Data Analytics Engineer 가 되