K-means clustering 이란?
K 개의 데이터 중심을 기반으로 K 개의 군집(묶어진 데이터) 을 만들어주는것
답이 없는 비지도 학습에 속한다
방법
- K 를 결정한다
(엘보우 방법 등 이용해서 직접 결정) - 평균을 기반으로 중심(Centroid) 을 결정한다 (!!중요!!)
( 초기 무작위 결정, 다시 할당되기에 ) - Cluster 거리를 측정하고 할당한다 (유클리디안 거리 등)
- 데이터에 맞춰 중심을 이동한다
- 3-4 를 데이터가 없을때까지 반복한다
장점
단순하다, 빠르다
단점
이상치에 민감하다(이상치때문에 중심점이 이동할 수 있다)
초기값이 적절하지 않다면 cluster가 제대로 이루어지지 않을 수 있다
구형의 분포가 아닌경우 clustering 이 제대로 이루어지지 않을 수 있다
k를 직접 정해야한다
(예시코드)
# 1. 필요한 라이브러리 불러오기
import numpy as np
import matplotlib.pyplot as plt
from sklearn.cluster import KMeans
# 2. 데이터 생성 (초기 데이터)
n_samples = 300
n_features = 2
n_clusters = 3
random_state = 42
# 초기 데이터 생성
X_initial, _ = make_blobs(n_samples=n_samples, n_features=n_features, centers=n_clusters, random_state=random_state)
# 3. K-means 클러스터링 (초기 데이터)
kmeans_initial = KMeans(n_clusters=n_clusters, random_state=random_state, n_init=10)
kmeans_initial.fit(X_initial)
labels_initial = kmeans_initial.labels_
centroids_initial = kmeans_initial.cluster_centers_
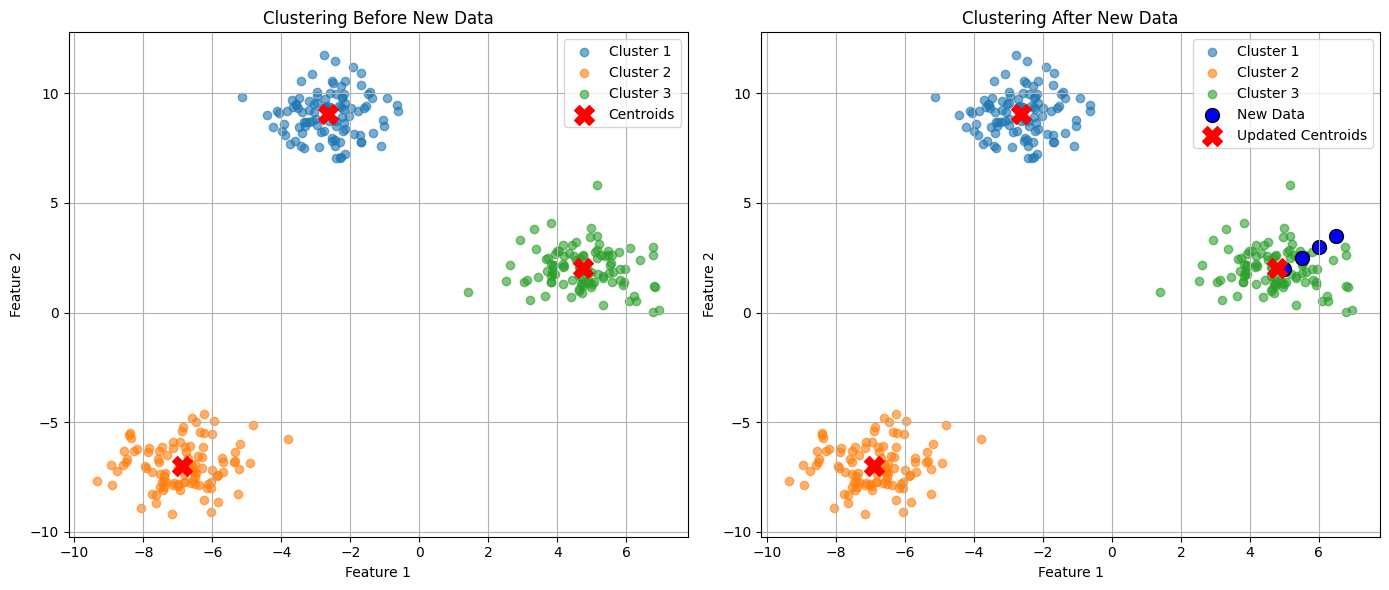
# 4. 새로운 데이터 추가
new_data = np.array([[5, 2], [5.5, 2.5], [6, 3], [6.5, 3.5]]) # 중심을 이동시킬 새로운 데이터
X_updated = np.vstack([X_initial, new_data]) # 기존 데이터에 새로운 데이터 추가
# 5. K-means 클러스터링 (새로운 데이터 포함)
kmeans_updated = KMeans(n_clusters=n_clusters, random_state=random_state, n_init=10)
kmeans_updated.fit(X_updated)
labels_updated = kmeans_updated.labels_
centroids_updated = kmeans_updated.cluster_centers_
# 6. 시각화
plt.figure(figsize=(14, 6))
# 6-1. 초기 데이터 클러스터링 결과
plt.subplot(1, 2, 1)
for i in range(n_clusters):
cluster_points = X_initial[labels_initial == i]
plt.scatter(cluster_points[:, 0], cluster_points[:, 1], label=f'Cluster {i+1}', alpha=0.6)
plt.scatter(centroids_initial[:, 0], centroids_initial[:, 1], c='red', marker='X', s=200, label='Centroids')
plt.title("Clustering Before New Data")
plt.xlabel("Feature 1")
plt.ylabel("Feature 2")
plt.legend()
plt.grid()
# 6-2. 새로운 데이터 포함 후 클러스터링 결과
plt.subplot(1, 2, 2)
for i in range(n_clusters):
cluster_points = X_updated[labels_updated == i]
plt.scatter(cluster_points[:, 0], cluster_points[:, 1], label=f'Cluster {i+1}', alpha=0.6)
plt.scatter(new_data[:, 0], new_data[:, 1], c='blue', marker='o', s=100, edgecolor='black', label='New Data')
plt.scatter(centroids_updated[:, 0], centroids_updated[:, 1], c='red', marker='X', s=200, label='Updated Centroids')
plt.title("Clustering After New Data")
plt.xlabel("Feature 1")
plt.ylabel("Feature 2")
plt.legend()
plt.grid()
# 시각화 출력
plt.tight_layout()
plt.show()

hi!