AWS SysOps Administrator Associate
AWS SysOps Administrator Associate 2020
CloudWatch
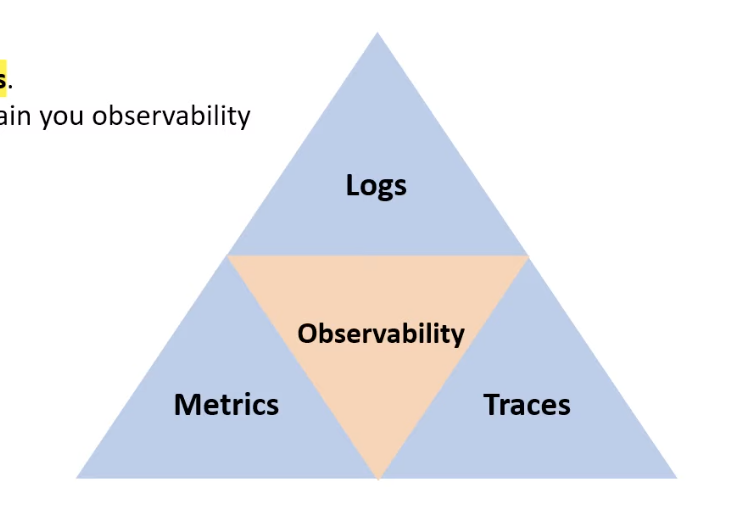
Pillars of Observability
What is Observability?
- Ability to measuer and understand how internal systems work in order to answer questions regarding performance, tolerance, security and faults with a system/application
- Metric : A number that is measure over period of time
- Logs : A text file where each line contains event data about what happened at a certain time
- Traces : A history of request that is travels through multiple Apps/Services so we can pinpoint performance or failure
Triforce of Observability
Introduction to CloudWatch
CloudWatch is an umbrella service meaning
that is really a collection of monitoring tools
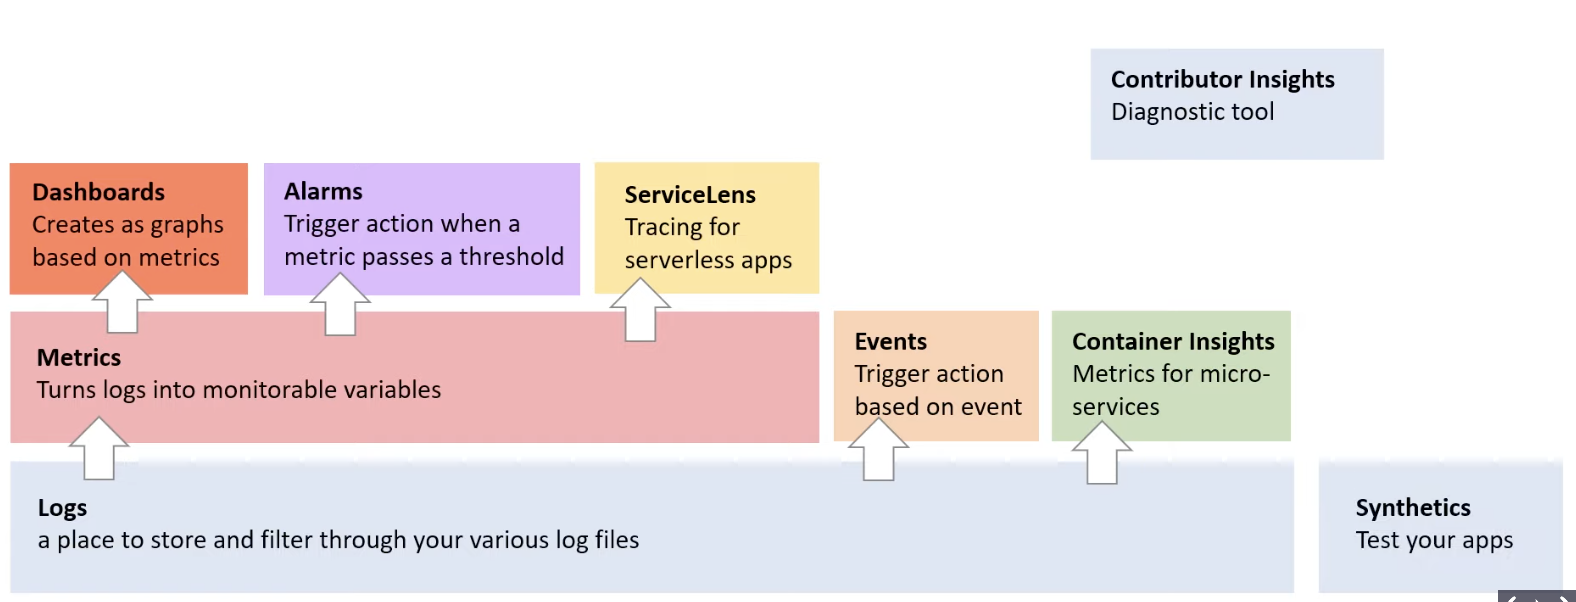
- Logs : Any custom log data, Application Logs, Nginx Logs etc
- Metrics : Represents a time-ordered set of data points, A variable to monitor
- Events : Trigger an event based on a condition
- Alarms : Triggers notification based on metrics which breach a defined threshold
- Dashborads : Create visualizations based on metrics
- ServiceLens : Visualize and analyze the health, performance, availability of your app in a single place
- Container Insights : Collects, aggregates and summarizes matrics and logs from your containerized apps and microservices
- Synthetics : Test your web-apps to see if they're broken
- Contributor Insights : View the top contributors impacting the performance of your systems and applications in real-time
All CloudWatch Services Build Off of CloudWatch Logs
CloudWatch Logs
Cloudwatch logs is used to monitor, store and access your log file
CloudWatch is a centralized log management service
- Export Logs to S3 : Can export Logs to S3 to do thins like perform custom analysis
- Stream to Elasticsearch Service : Can stream logs to an ES cluster in near real-time to have more robust full text search or use with the ELK stack
- Stream CloudTrail Events to CloudWatch Logs : You can turn on CloudTrail to stream event data to a CloudWatch Log Group
- Log Security : By default, log groups are encrypted at rest using SSE. You can use your own Custom Master Key (CMKs) with AWS KMS
- Log Filtering : Logs can be filtered using a Filtering Syntax and CloudWatch Logs has as sub-service called CloudWatch Insights
- Log Retention : By default, logs are kept indefinitely and never expire You can adjust the retention policy for each log group
- keeping the indefined retention
- choosing a retention period between 1 Day to 10 Years
Most AWS Services are integrated with CloudWatch Logs
Logging of services sometimes need to be turned on or requires the IAM Permissions to write to CloudWatch Logs
CloudWatch Logs - Log Groups
A collection of logs stream, its common to name logs groupw wih the forware slash syntax
ex) /example/prod/app
CloudWatch Logs - Log Stream
A log stream represents a sequence of events from a application or instance being monitored
- You can create Log Streams manually but generally this is automaticaly done by the service you are using
- You can see the Log streams are named after the running instance
- Log Streams are named after the running instance's instance ID
- If you use AWS Glue, You can see the Log Streams are named after Glue Jobs
CloudWatch Logs - Log Events
Represents a single event in a log file
Log events can be seen within a Log Stream
- You can use filter events to filter Out logs based on simple or Pattern Matching syntax
CloudWatch Logs Insights
CloudWatch Logs Insights enables you to interactively search and analyze your CloudWatch log data and has the following advantages
- more robust filtering then using the simple Filter events in a Log Stream
- Less burdensome then having to export logs to S3 and analyze them via Athena
CloudWatch Logs Insights support all types of logs
- CloudWatch Logs Insights is commonly used via the console to do ad-hoc queries against logs groups
CloudWatch Insights has its own language called:
- CloudWatch Logs Insights Query Syntax
- A single request can query up to 20 log groups
- Queries time out after 15 minutes, if they have not completed
- Query results are available for 7 days
filter action="REJECT"
| stats count(*) as numRejections by srcAddr
| sort numRejections desc
| limit 20
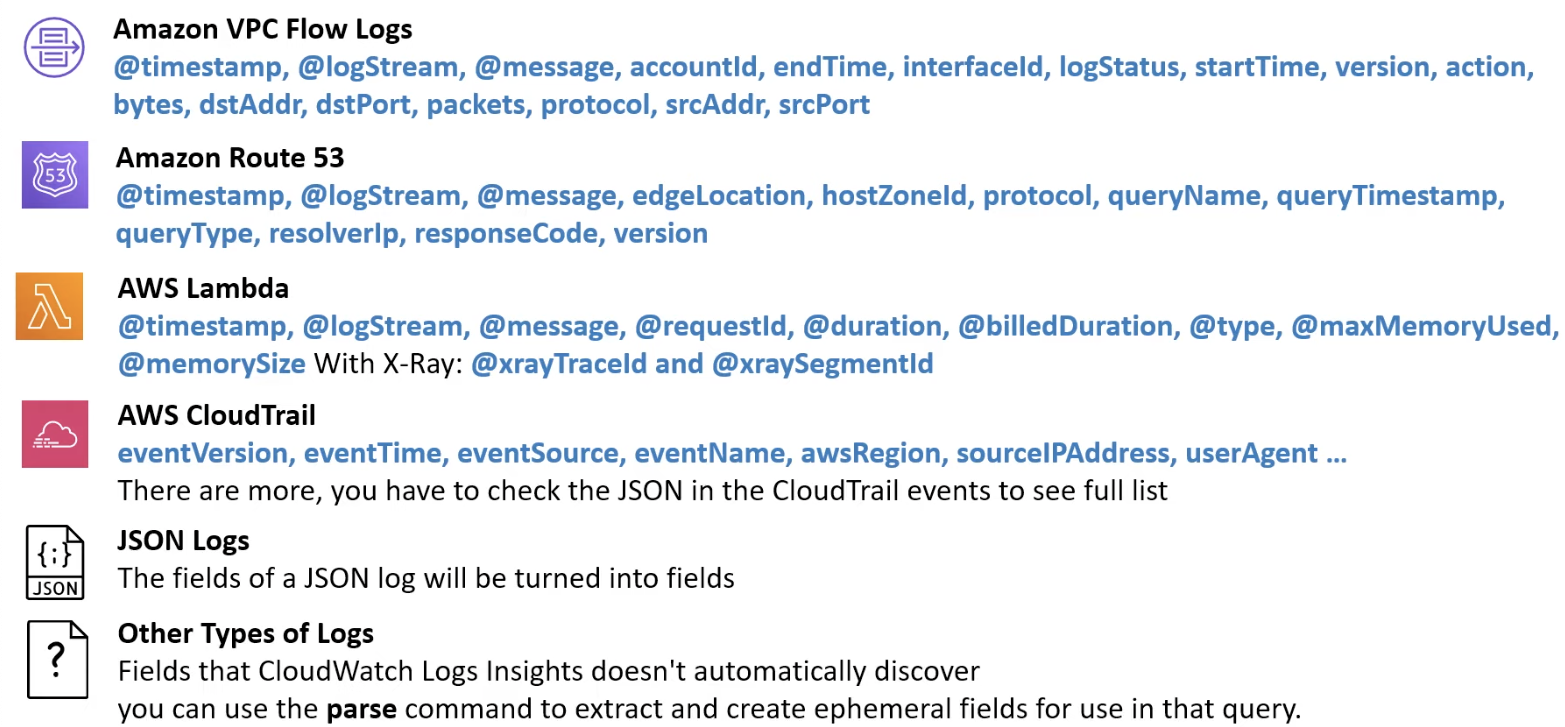
CloudWatch Logs Insights - Discovered Fields
When CloudWatch Insights read a logs, it will first analyzing the log events and try to structure the content by generating fields that you can then use in your query
CloudWatch Log Insights inserts the @ symbol at the start of fields that it generates
[5 system field will be automatically generated]
@message : the raw unparsed log event
@timestamp : the event timestamp contained in the log event's timestamp field
@ingestionTime : the time when the log event was received by CloudWatch Logs
@logStream : the name of the log stream that the log event was added to
@log : is a log group identifier in the form of account-id:log-group-name
CloudWatch Logs Insights automatically disovers fields in logs from AWS services such as:
CloudWatch Metrics
A CloudWatch Metric represents a time-ordered set of data points
Its a variable that is monitored over time
ClodWatch comes with many predefined metrics that are generally name spaced by AWS Service

Availability of Data
When an AWS Services emits data to CloudWatch the availability of the data varies based on the AWS Service

CloudWatch Agent
The CloudWatch Agent can be installed using AWS System Manager (SSM) Run Command onto the target EC2 instance
Install or uninstall a Distributor package.
Packages provided by AWS such as AmazonCloudWatchAgent (...) are also supported
You must attach CloudWatchAgentServerRole IAM role to the EC2 instance to be able to run the agent on the instance
Host Level Metrics
Some metrics you might think are tracked by default for EC2 instances are not, and require installing the CloudWatch Agent
Host Level Metrics
These are what you get without installing the Agent
- CPU Usage
- Network Usage
- Disk Usage
- Status Usage
- Underlying Hypervisor status
- Underlying EC2 instance status
Agent Level Metrics
These are what you get when installing the Agent
- Memory utilization
- Disk Swap utilization
- Disk Space utilization
- Page file utilization
- Log collection
The CloudWatch Agent is also used to collect various logs from an EC2 instance and send them to a CloudWatch Log Group
Custom High Resolution Metrics
You can publish your own CustomMetrics using the AWS CLI or SDK
aws cloudwatch put-metric-data \
  --metric-name Enterprise-D \
  --namespace Starfleet \
  --unit Bytes \
  --value 231213412
  --dimensions HullIntegrity=100, Shield=70, Thrusters=maximum
High Resolution Metrics
When you publish a custom metric, you can define the resolution as either:
- standard resolution (1 minute)
- high resolution (> 1 minute to 1 second)
With High Resolution you can track in intervals of:
- 1 second
- 5 seconds
- 10 seconds
- 30 seconds
- multiple of 60 seconds
Log Collection
The CloudWatch Agent can send logs running on your EC2 instance to a CloudWatch Log Group
To send logs:
- the Agent Configuration needs to be updated to include the logs
- The CloudWatch Agent service needs to be restarted
The Agent's configuration file is located at /etc/awslogs/awslogs.conf
[example_application_log]
log_group_name = /example/rails/logs/production
log_stream_name = {instance_id}
datetime_format = %Y-%m-%d%H:%M:%S.%f
file = /var/www/my-app/current/log/production.log*
You specify the location of the log file and what log group you want the log to be sent to
sudo service awslogsd stop
sudo service aws logsd start
Introduction to EventBridge
What is an Event Bus?
- An event bus receives events from a source and routes events to a target based on rules
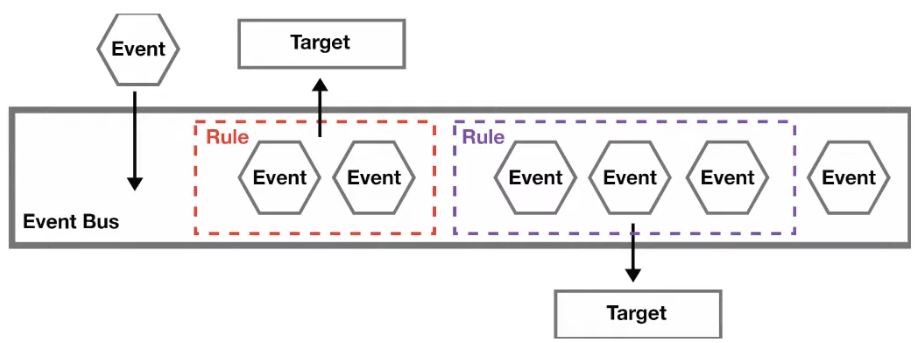
EventBridge is a serverless event bus service that is usd for application integration by streaming real-time data to your application
EventBridge was formerly called Amazon CloudWatch Events
EventBridge Core Components
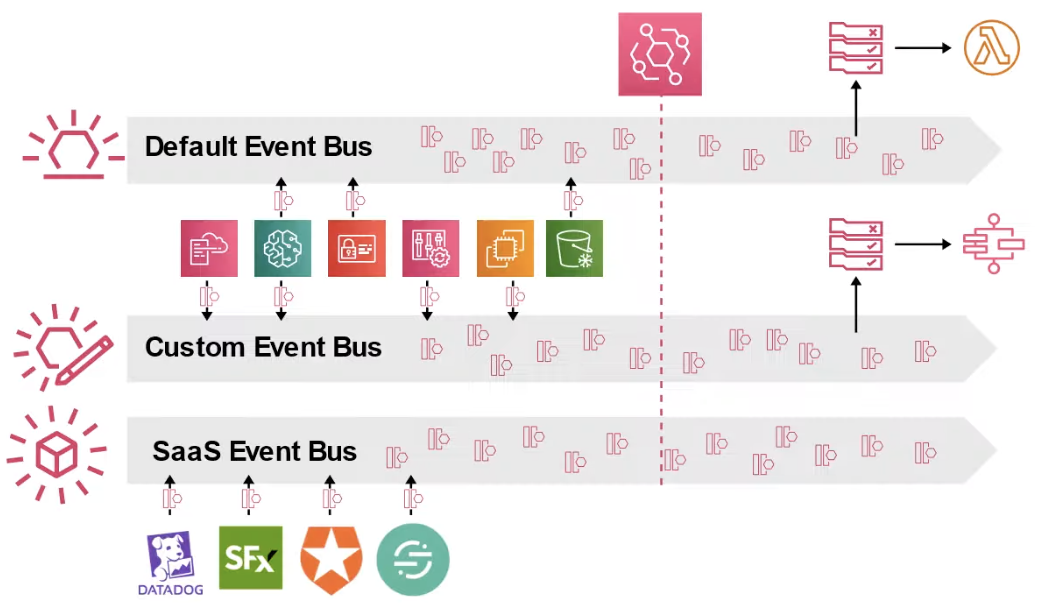
Hold event data, defined rules on an event bus to react to events
- Default Event Bus : An AWS account has a default event bus
- Custom Event Bus : Scoped to multiple accounts or other AWS accounts
- SaaS Event Bus : Scoped to with Third party SaaS Providers
- Producers : AWS Services that emit events
- Events : Data emitted by services. JSON objects that travel (stream) within the eventbus
- Partner Sources : Are third-party apps that can emit events to an event bus
- Rules : Determines what events to capture and pass to target (100 Rules per bus)
- Targets : AWS Services that consume events (5 target per rule)
EventBridge Anatomy of an Event
The top level fields listed here will always appear in every single event
The contents of fields appearing under detail will vary based on what AWS cloud service emits the event
{
  "version": "0",
  "id": "bfdc1220-60ff-44ad-bfa7-3b6e6ba3b2d0",
  "detail-type": "CodeBuild Build State Change",
  "source": "aws.codebuild",
  "account": "123456789012",
  "time": "2017-07-12T00:42:28Z",
  "region": "us-east-1",
  "resources": ["arn:aws:codebuild:us-east-1:123456789012:build/SampleProjectName:ed6aa685-0d76-41da-a7f5-6d8760f41f55"],
  "detail": {
    "build-status": "SUCCEEDED",
    "project-name": "SampleProjectName",
    "build-id": "arn:aws:codebuild:us-east-1:123456789012:build/SampleProjectName:ed6aa685-0d76-41da-a7f5-6d8760f41f55",
    "current-phase": "COMPLETED",
    "current-phase-context": "[]",
    "version": "1"
  }
}- version : by default, this is set to 0 in all events
- Id : A unique value is generated for every event
- detail-type : Identifies fields and values that appear in the detail field
- source : identifies the service that sourced the event
- account : 12 digit number identifying AWS account
- time : the event timestamp
- region : AWS region where the event originated
- resource : JSON array contains ARNs (Amazon Resource Names) that identify resource that are involved in the event
- detail : JSON object containing data provided by the Cloud Service. Can contain 50 fields nested several levels deep
EventBridge - Scheduled Expressions
You can create EventBridge Rules that trigger on a schedule
You can think of it as Serverless Cron Jobs
- All scheduled events use UTC time zone
- the minimum precision for schedules is 1 min
EventBridge supports cron expressions and rate expressions
- Cron expression : very fine grain control
- Rate expression : Easy to set, not as fine grained
+) Fine-Grained
- 하나의 작업을 작은 프로세스로 나눈 후 다수의 호출을 통해 결과를 생성해내는 방식
Coarse-Grained
- 하나의 작업을 큰 프로세스 단위로 나눈 후 Single call 을 통해 작업 결과를 생성해내는 방식
EventBridge - Rules
You specify up to five Targets for a single rule
Commonly targeted AWS Cloud Service:
- Lambda function
- SQS queue
- SNS topic
- Firehose delivery stream
- ESC Task
You can specify what gets passed along by changing Configure Input
This acts as sort of filter
Match Events
The entire event pattern text is passed to the target when the rule is triggered (Just pass everything)
EventBridge - Configure Input
- Match Events : The entire event pattern text is passed to the target when the rule is triggered
- Part of the matched event : only the part of the event text that you specify is passed to the target
- Constant (JSON text) : send static content instead of the matched event data (Mocked JSON)
- Input Transformer : You can transform for the event text a different format of a string or a JSON object
You can't use these as variable names (reserved by AWS)
- aws.events.rule-arn
- aws.events.rle-name
- aws.events.event
EventBridge - SchemaRegistry
EventBridge Schema Registry allows you to create, discover and manage OpenAPI Schema for events on EventBridge
+) What is a Shema?
A Schema is an outline, diagram, or model
Schemas are often used to describe the structure of different types of data
Why would you want a schema of the events int your EventBridge event bus?
- This makes it easier for developers to know What data to expect from a type of event so its easier to integrate into application
- So we can download Code Bindings for various language to make it easier for developers to work with events in their code
A Code Binding is when the schema is wrapped in a programming Object
THis standarizes how to work with event data in code
Leading to fewer bugs and easier discovery of data
- By installing the AWS Toolkie for VSCode you can easily View Schema and install Code Bindings
Event Bridge - CloudTrail Event
Not all AWS Services emit CloudWatch Event
For other AWS Services we can use CloudTrail
Turniging on CloudTrail allows EventBridge to track changes to AWS Services made by API calls or by AWS users
The Detail Type of CloudTrail will be called : "AWS API Call via CloudTrai"
AWS API call events that are larger than 256KB in size a re not supported
Event Bridge - Event Patterns
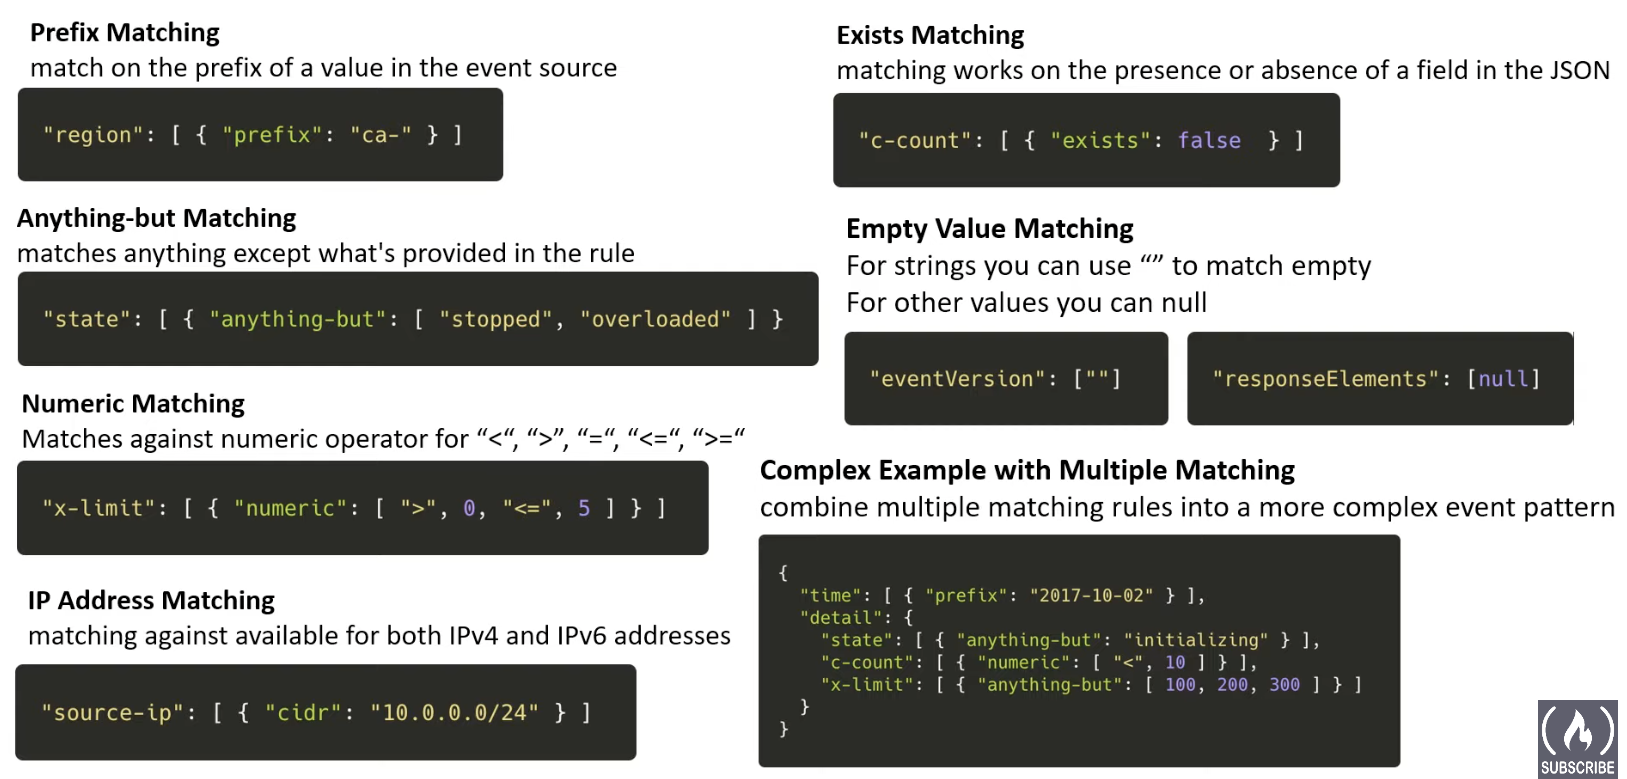
Event Patterns are used to filter what events should be used to pass along to a target
You can filter events by providing the same fields and values found in the original Events
CloudWatch Alarams
A CloudWatch Alarm monitors a CloudWatch Metric based on a defined theshold
When alarm breaches (goes outside the defined threshold) than it changes state
Whe is changes state we can define what action it should trigger
- Notification
- Auto Scailing Group
- EC2 Action
Metric Alarm States
- OK : The metric or expression is within the defined threshold
- ARLAM : the metric or expression is outside of the defined threshold
- INFUFFICIENT_DATA
- the alarm has just started- the metric is not available
- Not enough data is available
CloudWatch Alarms - Anatomy of an Alarm
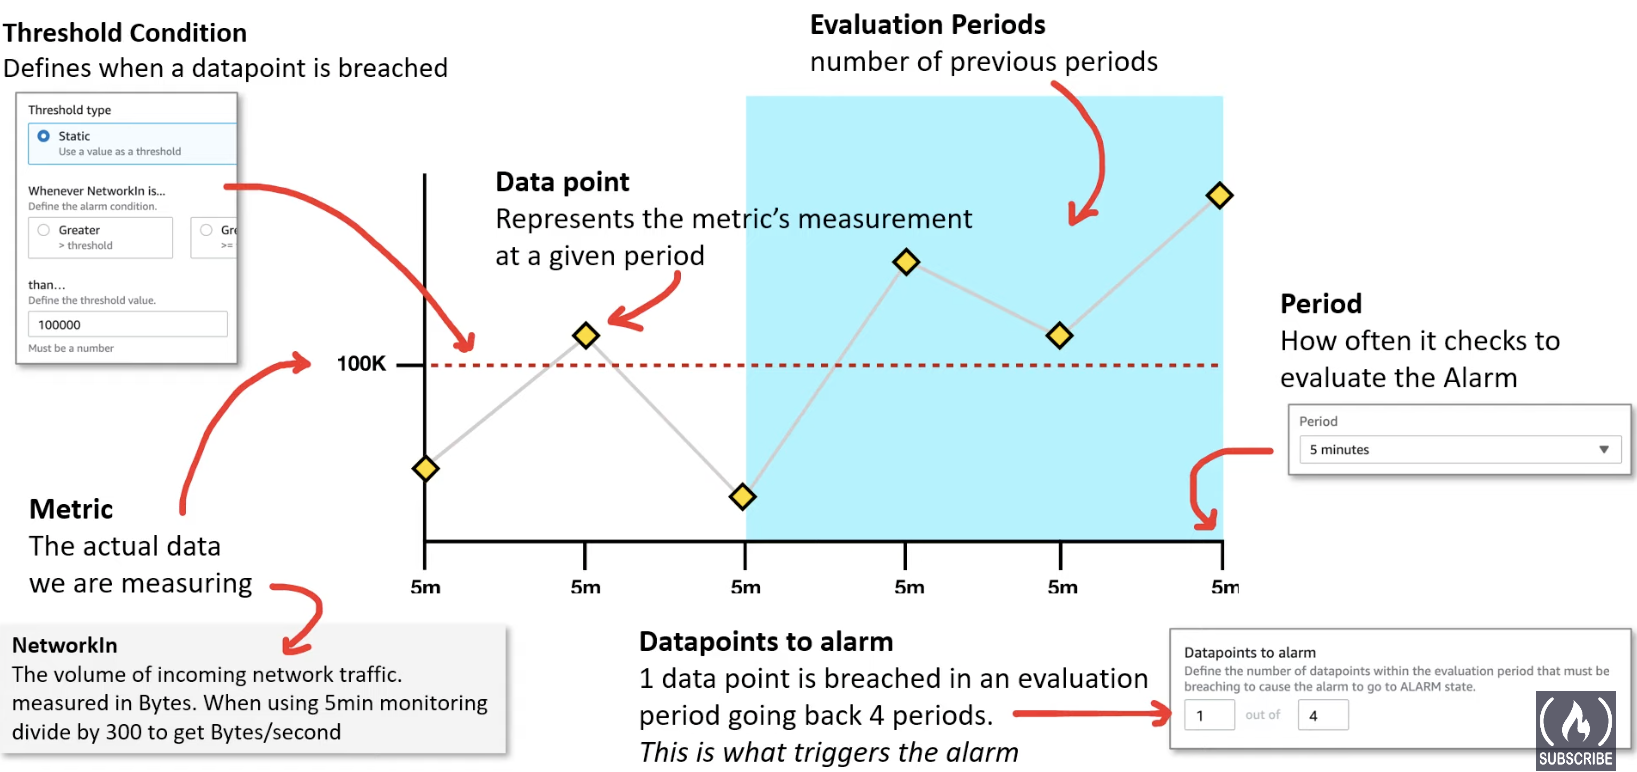
CloudWatch - Alarm Conditions
- When you create an alarm you define the theshold
The most common type is a Static Threadhold
Then you define the condition of the alarm
Then you dfeind the threshold value
ex) You crate an CloudWatch because you want to avoid unexpected charges
- You use the ExtimatedCharges metric
- You set the Threshold Type to Static
- Set the Alarm condition to Greater
- Set the threshold value of 50 USD
You have may have reoccurring datapoints that breach a static threshold,
but this would not be considered "unusual behavior"
Using Statis Threshold Type would trigger the Alarm State and these would be false-positive
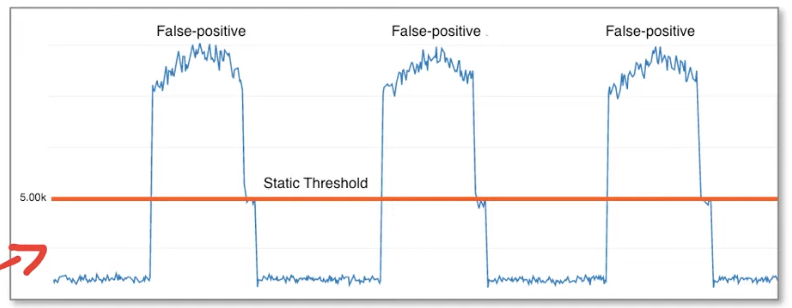
Using Anomaly detection, you can define a band as the thresdhold

CloudWatch Alarms - Composite Alarms
Composite Alarm are alarm that watch other alarms
Using composite alarms can help you reduce alarm noise
Imagine you have 2 Alarms and you configure them to have no actions
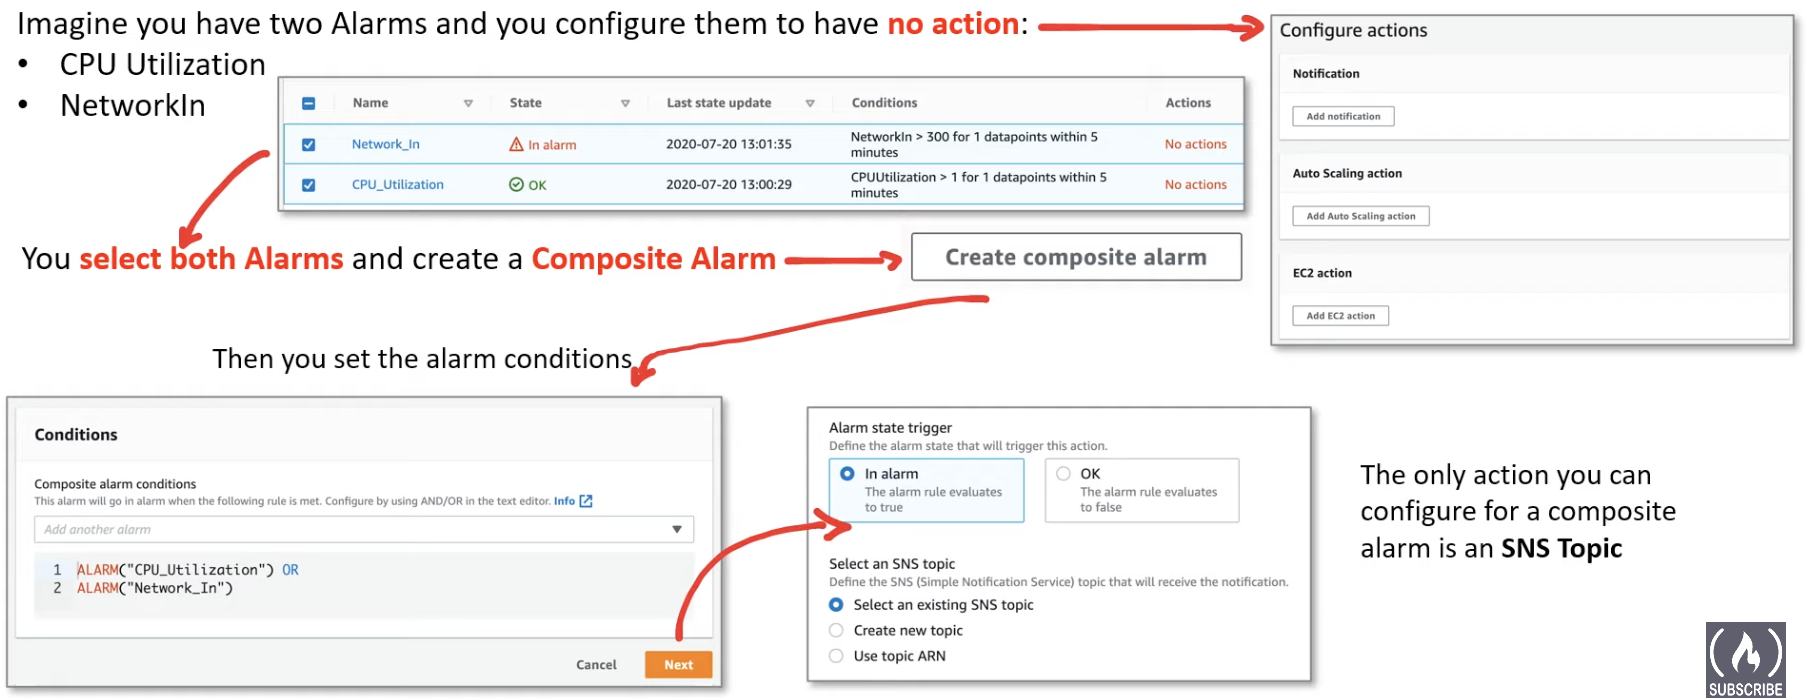
- The only action you can configure for a composite alarm is an SNS Topic
CloudWatch Dashboards
CloudWatch Dashboards allows you to visualize your cloud Metrics in the form of various graphs
You create a widget, choose and configure a metric and add to your dashboard
CloudWatch ServiceLens
CloudWatch ServiceLens gives you observability for your distributed applications by consolidating metrics, traces, logs, alarms into one unified dashboard
What is a distributed application?
Also known as a distributed system, is when network isolated services or applications that have to communicate over a network, together make a larger system/application
Applications that could be defined as distributed system generally utilize:
- Microservices
- Containers
- Various CloudServices, Compute and Databases tied together using Application Integration Services
ServiceLens integrates CloudWatch with X-Ray to provide an end-to-end view of your application to help you efficiently
- pinpoint performances bottlenecks
- identify impacted users
Service Map displays your service endpoints as nodes and highlights the traffic, latency, and errors for each node and its connections
- ServiceLens integrates with CloudWatch Synthetics
- ServiceLens supports log correlation with:
- Lambda Functions
- API Gateway
- Java-based apps on EC2, ECS, EKS
- Kubernetes with container Insights
To install and use Service Lens you need to
- Deploy X-Ray (Instrument your services)
- Deploy CloudWatch Agent and X-Ray daemon
ServiceLens has 2 modes
- Map View : is the Service Map showing us traces between modes
- List View : is flat list of Nodes that are Make us the service
ServiceLens lets us quickly filter trace information to open in X-Ray Analytics
CloudWatch Synthetics
Synthetics is used to test web-application by creating canaries to
- Broken or dead links
- Step by step task completion
- Page load errors
- Load latencies of assets
- Complex Wizard flows
- Checkout flows
+) What is a Canary?
Canaries are configurable scripts that run on a schedule to monitor your endpoints and APIs
Canaries mimic steps a real user would take so you can contiruously verify the customer experiencer
Canaries run on AWS lambdas using Node.js and Puppetteer
Puppeteer is a headless chrome browser and an automated testing framework
You can code Puppeteer to open a web-browser and click and enter information into a website
+) Headless means that there is no visible window. So you don't see the browser
Heart Beat Monitoring
- Used to check a single page
- Supply a single url
- Wait a while and then take a snapshot when page has loaded
- It called Heart Beat Monitoring because it checks continuously to see if the page is still live
API Canary
Supply API endpoint
- Method, Headers, Payload (data)
Check if 200 is returned for success, anyting else is considered a failure
Broken Link Checker
- Supply link(s), then look for links on the page, and follow them to see if any those links are broken
- Tell what website it should look at
- How many links on the page it should, Click on ans see if they load
- You can supply multiples URLs
It will log all the pages it was able to load or not load
Since Canaries use AWS Lambda it would just log to a CloudWatch Log group
GUI Workflow Builder
- Test a sequence of steps that makes up a workflow
- You add actions suc as Click, Input Text, Verify Text
CloudWatch Contributor Insights
Container Insights collect, aggregates and summarizes information about your containers from metrics and logs
Continer Insights works with:
- Elastic Container Service
- ECS Fargate
- Elastic Kubernetes Service
- Kubernetest running on EC2 instance
- Metrics that Container Insights collects are available in CloudWatch automatic dashboards
- You can analyze and troubleshoot container performance and logs data with CloudWatch logs Insights
- Operational data is collected as performance log events
- These are entries that use a structured JSON schema that enables high-cardinality data to be ingested and stored at scale
Container Insights can be filtered by
- Cluster
- Node
- Pod
- Task
- Service Level
Contributor Insights allows you to view top contributors impacting the performance of your systems and application in real-time
Contributor Insights looks at your CloudWatch Logs and based on Insight rules you define shows real-time time-series data
AWS has a bund of sample rules you can use to get started