데이터
Pandas의 DataFrame의 예제를 살펴보기 위해 Kaggle의 타이타닉 데이터를 사용하려고 한다.
import pandas as pd
import numpy as np

titanic_df = pd.read_csv("titanic/train.csv")
Pandas는 Numpy와는 다르게 데이터 핸들링이 용이하다. 보통 데이터를 불러올 때 2차원적인 데이터를 불러오는데, 주로 read_csv를 사용한다. 다른 수단으로는 read_table, read_fwf가 존재한다. csv는 필드 구분 문자(Delimeter)가 콤마(,)이고 table은 탭(\t)이다.
그런데 read_csv는 다른 필드 구분 문자 기반의 파일도 DataFrame로 변환이 가능하다.
read_csv('Paht/파일명', sep='구분 문자')위 코드처럼 sep 파라미터로 가능하다. default값은 당연히 콤마이다.
타이타닉 데이터를 가져왔으면 어떤 데이터인지 확인은 필수적이다.
titanic_df.head()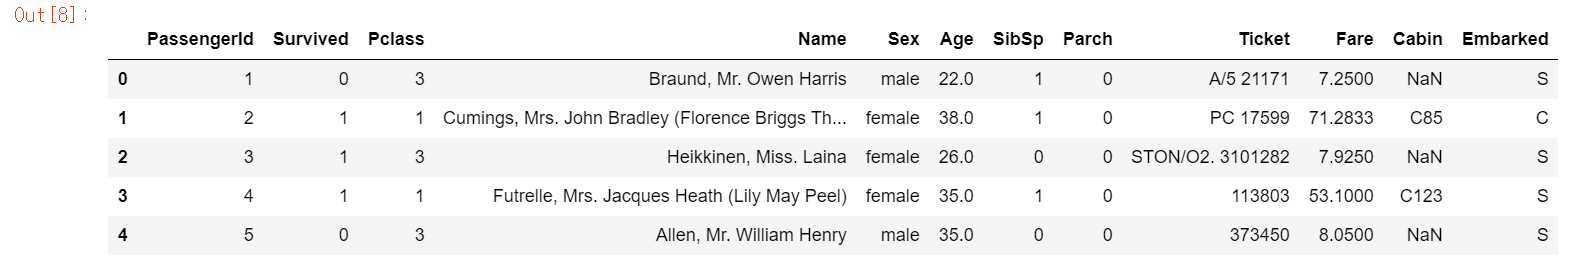
print('titanic 변수 type', type(titanic_df))데이터프레임 titanic_df의 타입을 살펴보면,
titanic 변수 type <class 'pandas.core.frame.DataFrame'>
그리고 shape을 통해 데이터 프레임의 규모 또한 살펴볼 수 있다.
print('DataFrame 크기 : ', titanic_df.shape)DataFrame 크기 : (891, 12)
이뿐만 아니라 칼럼의 타입, NULL 데이터 개수, 데이터 분포도 등의 메타 데이터도 조회가 가능하다.
titanic_df.info()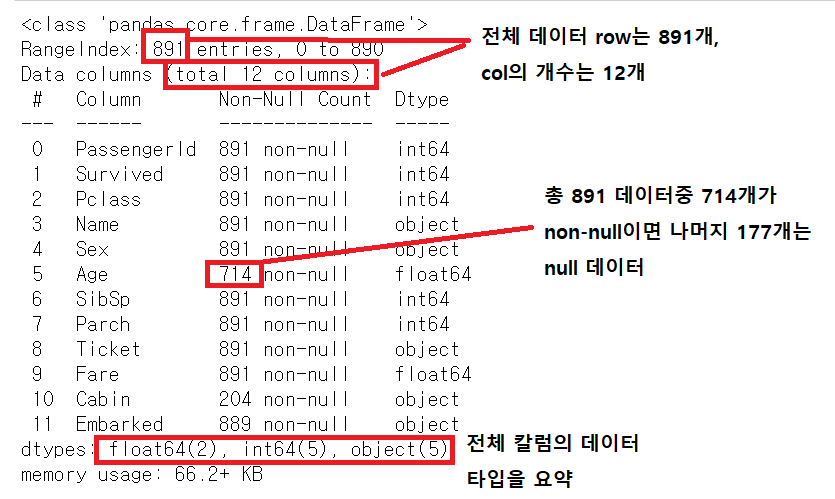
info()를 통해 NULL 데이터 개수 칼럼 및 로우의 개수, 데이터 타입 등을 알 수 있다.
titanic_df.describe()
데이터 분포도를 아는 것은 머신러닝의 성능을 향상시키는 중요한 요소이다. 예를 들어, 회귀분석에서 결정 값이 정규 분포를 이루지 않고, 특정 값으로 왜곡되어 있거나 데이터 값에 이상치가 많은 경우 예측 성능이 저하된다.
describe는 정확한 분포도는 알 수 없지만 대략적인 정보는 알 수 있다.
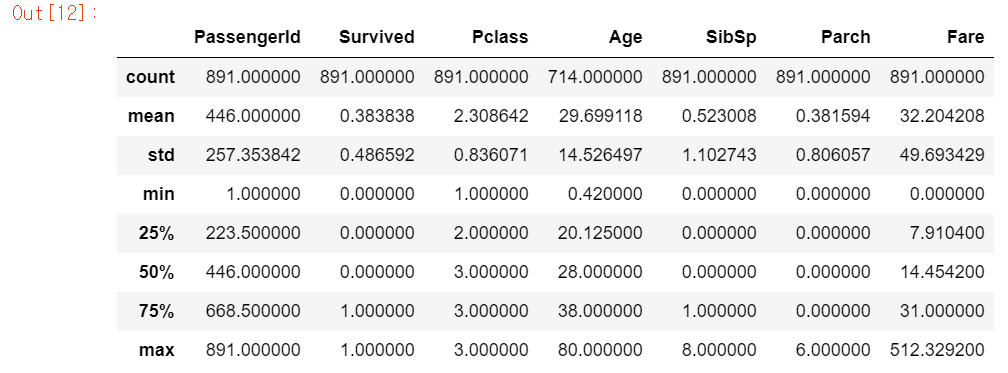
이 데이터 분포도를 보면 일단
Passengerid는 인덱스와 같은 데이터이므로 분석에 의미있는 데이터는 아니다.Survived는 0과 1로 이루어진 일종의 명목형 데이터이다.Pclass또한 1,2,3으로 이루어진 숫자형 명목형 데이터이다.
그럼 여기서 Pclass가 진짜 1,2,3으로 이루어진 숫자형 카테고리컬 데이터인지 확인해보자.
titanic_df['Pclass'].unique()array([3, 1, 2], dtype=int64)
이 데이터의 각 개수를 살펴보면
titanic_df['Pclass'].value_counts()3 491
1 216
2 184
Name: Pclass, dtype: int64
여기서 value_counts()을 쓴 결과값의 type은 Series이다.
type(titanic_df['Pclass'].value_counts())pandas.core.series.Series
Series라는 것은 인덱스를 포함하고 있다는 것인데, 여기서 인덱스는 3,1,2이다.
DataFrame & list & dict & ndarray
DataFrame은 list, dict, ndarray 등 다양한 데이터로부터 생성될 수 있다. 그 반대의 경우도 또한 가능하다.
머신러닝 알고리즘엣 대부분 DataFrame와 ndarray로 인자를 받는다. 그래서 DataFrame과 ndarray의 상호간의 변환은 빈번하게 일어난다.
DataFrame은 list와 ndarray와는 다르게 칼럼명을 가지고 있다. 칼럼명을 가지고 있기 때문에 상대적으로 편하게 데이터 핸들링이 가능하다. 그래서 list나 dict, ndarray로 DataFrame으로 변환 시 이 칼럼명을 지정해준다.
1차원 list & ndarray
col_name1=['col1']
list1=[1,2,3]
arr1=np.array(list1)
print('arr1 shape : ', arr1.shape)
우선 DataFrame로 만들 list와 ndarray를 생성해준다.
df_list1 = pd.DataFrame(list1, columns=col_name1)
print('1차원 리스트로 만든 DataFrame:\n', df_list1)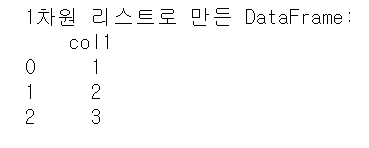
df_arr1 = pd.DataFrame(arr1, columns=col_name1)
print('1차원 ndarray로 만든 DataFrame:\n', df_arr1)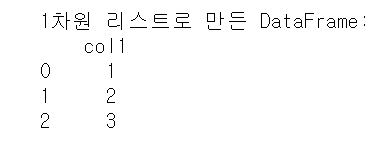
2차원 list & ndarray
col_name2 = ['col1', 'col2', 'col3']
list2 = [[1,2,3],
        [11,12,13]]
arr2 = np.array(list2)
print('arr2 shape : ', arr2.shape)
df_list2 = pd.DataFrame(list2, columns=col_name2)
print('2차원 리스트로 만든 DataFrame:\n', df_list2)
df_arr2 = pd.DataFrame(arr2, columns=col_name2)
print('2차원 ndarray로 만든 DataFrame:\n', df_arr2)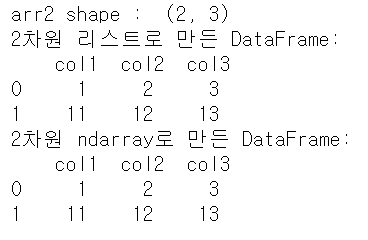
2차원 구조를 가지고 DataFrame를 만드는것도 1차원과 똑같다.
dict
이번엔 딕셔너리를 DataFrame로 변환해보자. 딕셔너리를 DataFrame로 변환 시에는 딕셔너리 키는 colnames로, 값은 키에 해당하는 칼럼 데이터로 변환이 된다. 그래서 키는 문자열, 값의 경우에는 리스트 또는 ndarray 형태로 딕셔너리를 구성해야 한다.
dict = {'col1':[1, 11], 'col2':[2, 22], 'col3':[3, 33]}
df_dict1 = pd.DataFrame(dict)
print('딕셔너리로 만든 DataFrame:\n', df_dict1)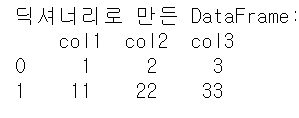
DataFrame을 다른 자료구조로 변환
dict로 만들었던 DataFrame을 다시 다른 자료구조로 변환해보자. 이 때 사용하는 것은 DataFrame.values, DataFrame.tolist(), DataFrame.to_dict()라는 것이다.
우선 DataFrame.values를 사용하면 DataFrame을 ndarray로 변환할 수 있다.
arr3 = df_dict1.values
print('df_dict.value 타입 : ', type(arr3), 'df_dict.values shape : ', arr3.shape)
print(arr3)
df_dict.value 타입 : <class 'numpy.ndarray'> df_dict.values shape : (2, 3)
[[ 1 2 3][11 22 33]]
이번엔 타이타닉 DataFrame을 ndarray로 변환해보자
arr4 = titanic_df.values
arr4
array([[1, 0, 3, ..., 7.25, nan, 'S'],
[2, 1, 1, ..., 71.2833, 'C85', 'C'],
[3, 1, 3, ..., 7.925, nan, 'S'],
...,
[889, 0, 3, ..., 23.45, nan, 'S'],
[890, 1, 1, ..., 30.0, 'C148', 'C'],
[891, 0, 3, ..., 7.75, nan, 'Q']], dtype=object)
DataFrame에서 특정 칼럼을 가지고 변환할 수도 있다.
arr5 = titanic_df.Sex.values
arr5
array(['male', 'female', 'female', 'female', 'male', 'male', 'male',
'male', 'female', 'female', 'female', 'female', 'male', 'male',
'female', 'female', 'male', 'male', 'female', 'female', 'male',
'male', 'female', 'male', 'female', 'female', 'male', 'male',
'female', 'male', 'male', 'female', 'female', 'male', 'male',
'male', 'male', 'male', 'female', 'female', 'female', 'female',
'male', 'female', 'female', 'male', 'male', 'female', 'male',
'female', 'male', 'male', 'female', 'female', 'male', 'male',
'female', 'male', 'female', 'male', 'male', 'female', 'male',
...
이번엔 DataFrame을 list와 dict로 변환해보자.
DataFrame.values을 가지고 tolist()을 사용하면 list형으로 변환이 가능하다.
list3 = df_dict1.values.tolist()
print('df_dict.values.tolist() 타입 : ', type(list3))
print(list3)
df_dict.values.tolist() 타입 : <class 'list'>
[[1, 2, 3], [11, 22, 33]]
DataFrame을 to_dict()로 dict로 변환이 가능한데, to_dict()의 인자로 'list'을 넣어주면 딕셔너리의 값이 list형으로 반환이 된다.
dict3 = df_dict1.to_dict('list')
print('\n df_dict.to_dict() 타입 : ', type(dict3))
print(dict3)
df_dict.to_dict() 타입 : <class 'dict'>
{'col1': [1, 11], 'col2': [2, 22], 'col3': [3, 33]}
drop
DataFrame에서 특정 행 또는 열의 데이터를 삭제하는 기능이 있다. drop()을 사용하면 된다. drop의 원형을 살펴보면 다음과 같다.
DataFrame.drop(labels, axis, index, columns, level, inplace, errors='raise')여기서 주로 사용하는 것은 lebels, axis, inplace 파라미터이다. axis는 열 또는 행을 지정해주는 파라미터이다. axis=0은 행방향, axis=1은 열방향이다. 그래서 칼럼을 지울때에는 axis=1을 지정해주고, 이상치 데이터 등 해당 인덱스 로우를 지울 때는 axis=0을 지정.
titanic_drop_df = titanic_df.drop('Age_10', axis=1)titanic_df에서 'Age_10'이라는 칼럼을 지우기 위해 'Age_10' 칼럼 이름과 axis=1을 지정해준다.
inplace는 default값이 False이다. 위 titanic_df에서 drop을 시킨 후에 다시 titanic_df DataFrame을 살펴보면 원본 DataFrame은 변하지 않았다. 만약 inplace=True로 설정해주면 원본 DataFrame도 수정이 된다. 대신 반환값은 None이다.
drop_res = titanic_df.drop(['Age_10', 'Family_No'], axis=1, inplace=True)
print('drop_res 결과값 : ', drop_res)
titanic_df.head()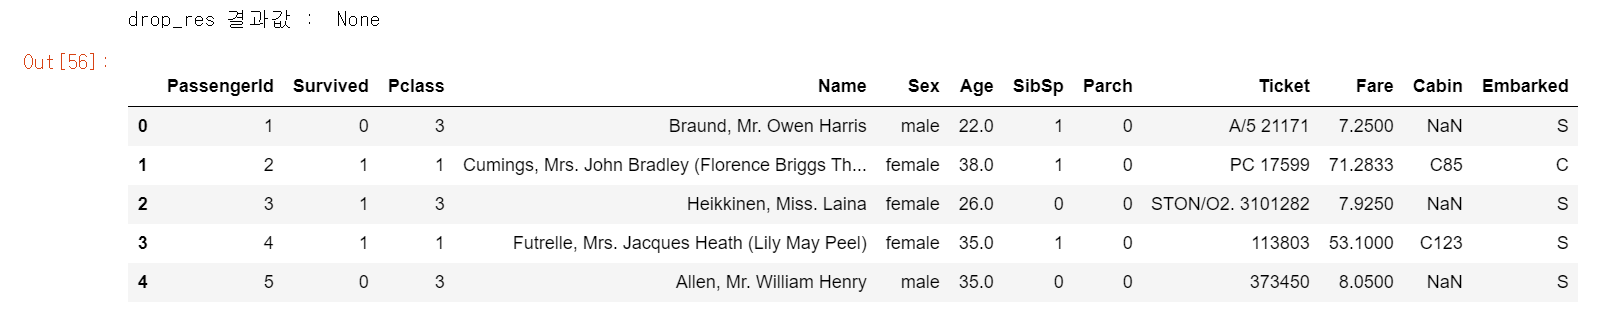
그래서 inplace=True로 설정할 시 자기 자신의 DataFrame 객체로 할당하면 안된다.
titanic_df = titanic_df.drop(['Age_10', 'Family_No'], axis=1, inplace=True)자기 자신의 객체로 할당하면 titanic_df 객체 변수를 None으로 바꾸어 버린다.
pd.set_option('display.width', 1000)
pd.set_option('display.max_colwidth', 30)
책으로 공부하다가 set_option이라는 옵션 지정 함수를 봤다. 이 외에도 여러가지 설정이 있는데, 일단 위에것만 살펴보자면
- display.width : 데이터프레임 출력 전체 폭을 지정
- display.max_colwidth : 데이터프레임 컬럼 길이 출력 폭 지정, -1로 설정 시 제약을 제거
Pandas Index
index 추출
Pandas에서 DataFrame나 Series는 index가 추출이 가능하다. 이 때 index라는 메서드를 사용한다.
indexes = titanic_df.index
print(indexes)
print(type(indexes))
print(type(indexes.tolist()))
print(type(indexes.values))
print(indexes.values)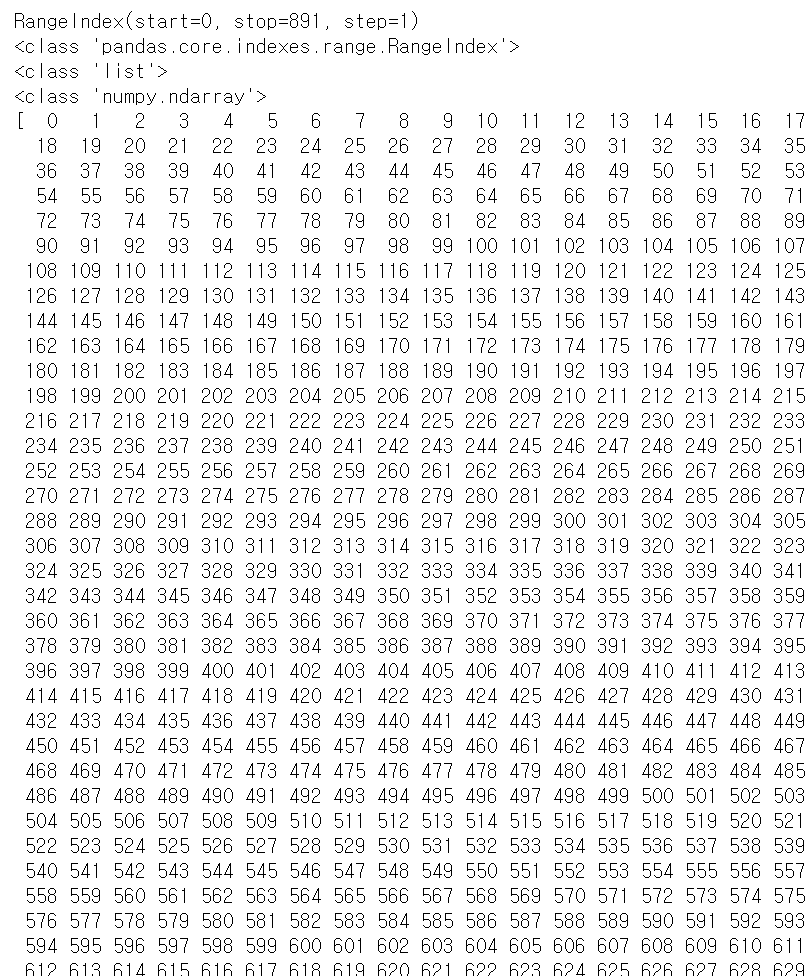
추출한 index를 가지고 list나 ndarray로도 변환이 가능하다. 방식은 위에서 DataFrame을 다른 자료구조로 변환하는 방식과 같다.
Reset_index
DataFrame 및 Series에서 reset_index() 메서드를 수행하면 새롭게 인덱스를 연속 숫자 형으로 할당하며 기존 인덱스는 index라는 새로운 칼럼으로 추가된다.
titanic_reset_df = titanic_df.reset_index(inplace=False)
titanic_reset_df.head(3)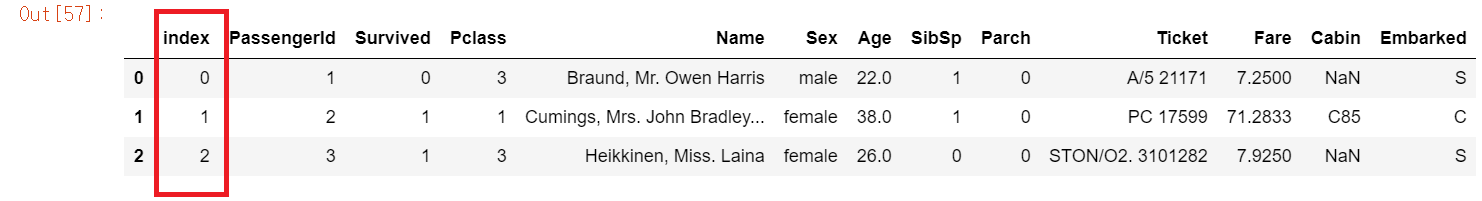
titanic_df DataFrame에서 reset_index() 메서드를 수행한 결과 index라는 기존 index를 가지고 있는 새로운 칼럼이 추가가 됬고 DataFrame에는 새로운 숫자형 index가 생겼다. 이 reset_index() 메서드는 주로 index가 연속된 int형 데이터가 아닐 경우 이를 연속 int 숫자형 index로 수정할 때 주로 사용한다.
위에서 Series와 value_counts()에서 봤듯이 index가 해당 Series의 고유값이었는데, 이럴 때 사용할 수 있다. 그런데 Series에서 reset_index()를 실행할 시 DataFrame로 반환이 된다.
print("### before reset_index ###")
value_counts = titanic_df['Pclass'].value_counts()
print(value_counts)
print('value_counts 객체 변수 타입 : ', type(value_counts))
new_value_counts = value_counts.reset_index(inplace=False)
print("### after reset_index ###")
print(new_value_counts)
print('new_value_counts 객체 변수 타입 : ', type(new_value_counts))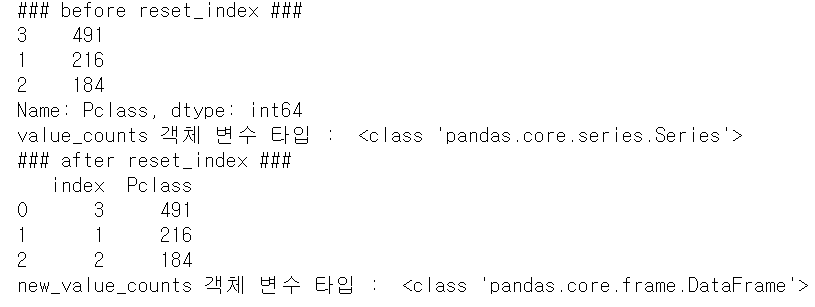
만약 그대로 Series타입으로 남길 원한다면 reset_index() 파라미터중 drop을 True로 설정해주면 된다.
print("### before reset_index ###")
value_counts = titanic_df['Pclass'].value_counts()
print(value_counts)
print('value_counts 객체 변수 타입 : ', type(value_counts))
new_value_counts = value_counts.reset_index(inplace=False, drop=True)
print("### after reset_index ###")
print(new_value_counts)
print('new_value_counts 객체 변수 타입 : ', type(new_value_counts))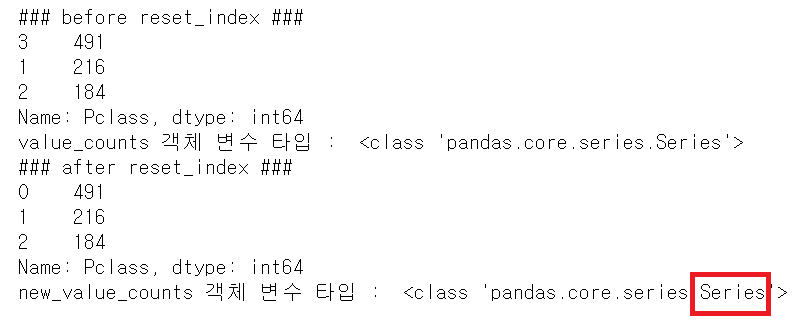
대신 전에 있던 index는 drop처리가 된다.
데이터 selection & filtering
DataFrame[]
Numpy에서는 데이터 selection을 할 때 ndarray[]에서 슬라이싱, 불린 인덱싱, 팬시 인덱싱 등을 이용했다. Pandas에서는 ix[], iloc[], loc[] 연산자를 통해 동일 작업을 수행한다. 여기서 DataFrame의 []와 Numpy의 [] 및 Series의 []와는 다르다.
Numpy의 []는 ndarray의 행, 열의 위치, 슬라이싱 범위 등을 지정해 데이터를 가져올 수 있다. 이에 반해 DataFrame의 []는 안에 들어갈 수 있는 인자는 칼럼 명, 또는 인덱스 표현식이다. 즉,
- DataFrame의 []는 ndarray의 []와 Series의 []와는 다르다.
- DataFrame에서 []는 칼럼명, 불린 인덱스 또는 인덱스 슬라이싱이 사용 가능하다.
- 하지만 DataFrame에서 인덱스 슬라이싱은 비추
우선 칼럼명을 통한 DataFrame에서 특정 칼럼 데이터를 추출해보자
print('단일 칼럼 데이터 추출:\n', titanic_df['Pclass'].head(3))
print('\n여러 칼럼의 데이터 추출:\n', titanic_df[['Survived', 'Pclass']].head(3))
print('[]안에 ndex는 KeyError오류:\n', titanic_df[0])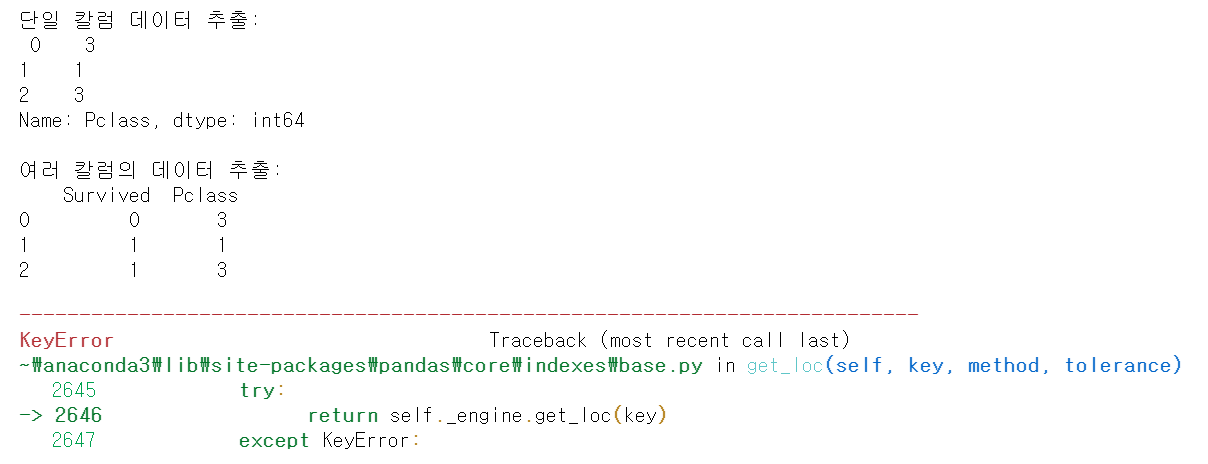
하지만 Pandas []에서 index를 슬라이싱을 통해서는 원하는 결과를 얻을 수 있다.
print('[]안에 index 슬라이싱', titanic_df[0:2])
Numpy에서의 불린인덱스도 DataFrame에서 구현이 된다.
titanic_df[(titanic_df['Sex']=='female') & (titanic_df['Age'] > 40)].head()
&(and)나 |(or) 연산자를 사용할 시 괄호로 묶어줘야 한다.
DataFrame.ix[]
DataFrame[]는 Numpy에서 ndarray의 [] 기능을 수행하는 메서드이다.
DataFrame.ix[index, 'col']처럼 행과 열의 위치값을 지정할 수 있다. col에는 해당 칼럼 명이 들어갈 수도 있고, 칼럼의 위치값도 가능하다.
* DataFrame.ix[0, 'col'] : DataFrame의 'col'칼럼에 속하는 0번째 인덱스의 데이터 값
* DataFrame.ix[0, 2] : DataFrame의 인덱스 0번째 위치에서 3번째 칼럼에 위치하는 데이터 값
현재는 ix()메서드가 삭제된것 같다. 대신에 at()라는 메서드가 있다.
- Series.at[index]
- DataFrame.at[index, col]
at()을 사용하면 해당 위치에 속하는 데이터 값만 추출할 수 있다.
print(titanic_df.at[0, 'Sex'])male
iloc[]
iloc[]는 DataFrame에서 위치 기반 인덱싱을 허용하는 메서드이다. 위치 기반이란 index 0을 기준으로 row, column 따라 숫자가 증가하는 식의 인덱싱이다. 따라서 row, column의 값은 정수로 입력이 된다.
titanic_df.iloc[0, 0]titanic_df에서 (0,0)은 어떤 값을 추출할까?
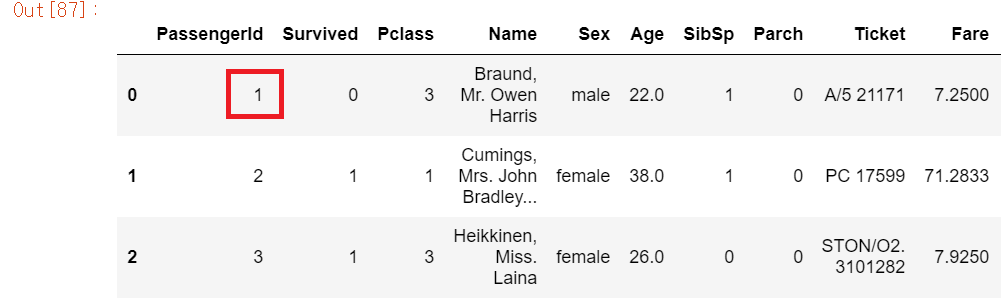
titanic_df의 3번째 row까지 보면 (0,0)에 해당하는 데이터는 PassengerId 칼럼에 속하는 index=0의 데이터 값 1이다. 실제로 1이 출력되는지 코드를 실행해보면
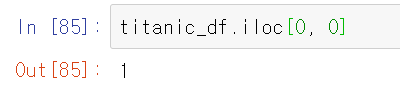
1이 정상적으로 출력이 되는것을 볼 수 있다.
이 iloc[]는 위에서 말했듯이 위치 기반 인덱싱 메서드이다. 여기서 명칭 기반 인덱싱을 실행하면 오류가 발생한다.
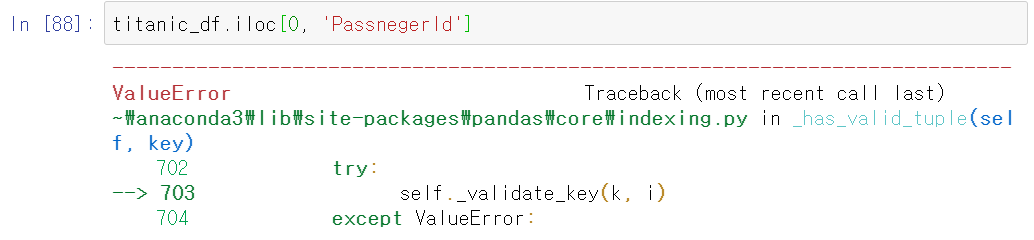
따라서 iloc[]는 명칭이 아닌 위치 기반에 따라 row, col 값을 넣어줘야 한다. row(index)도 마찬가지다.
DataFrame.iloc['one', 0]index 부분을 명칭으로 해도 오류가 발생한다.(value_counts()를 사용할 시 Series에서 index가 명칭으로 적혀있었는데, 이를 iloc[]에서 사용할 시 그대로 명칭을 적어주면 안된다는 부분!)
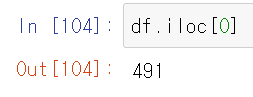
만약 Series에서 iloc를 사용할 경우는 해당 row위치만 적어주면 된다.
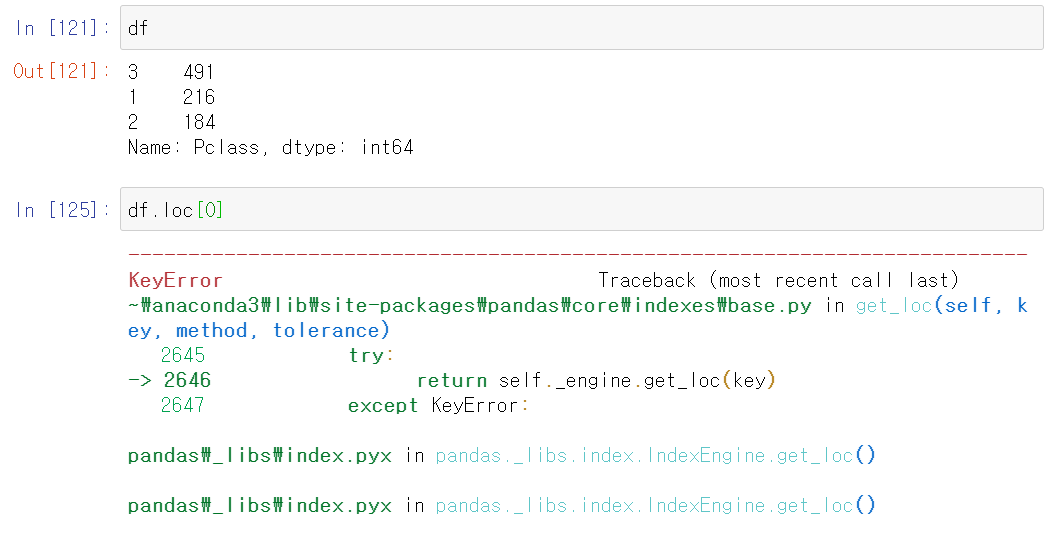
df = titanic_df['Pclass'].value_counts()
df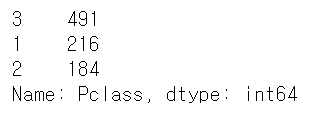
처음에 공부할 때 실수했던 부분은 value_counts()을 해서 뽑아낸 df는 DataFrame가 아닌 Series인데 iloc[]를 사용할 때 2차원으로 생각해서 실행해서 Too Many indexers오류가 발생했다.
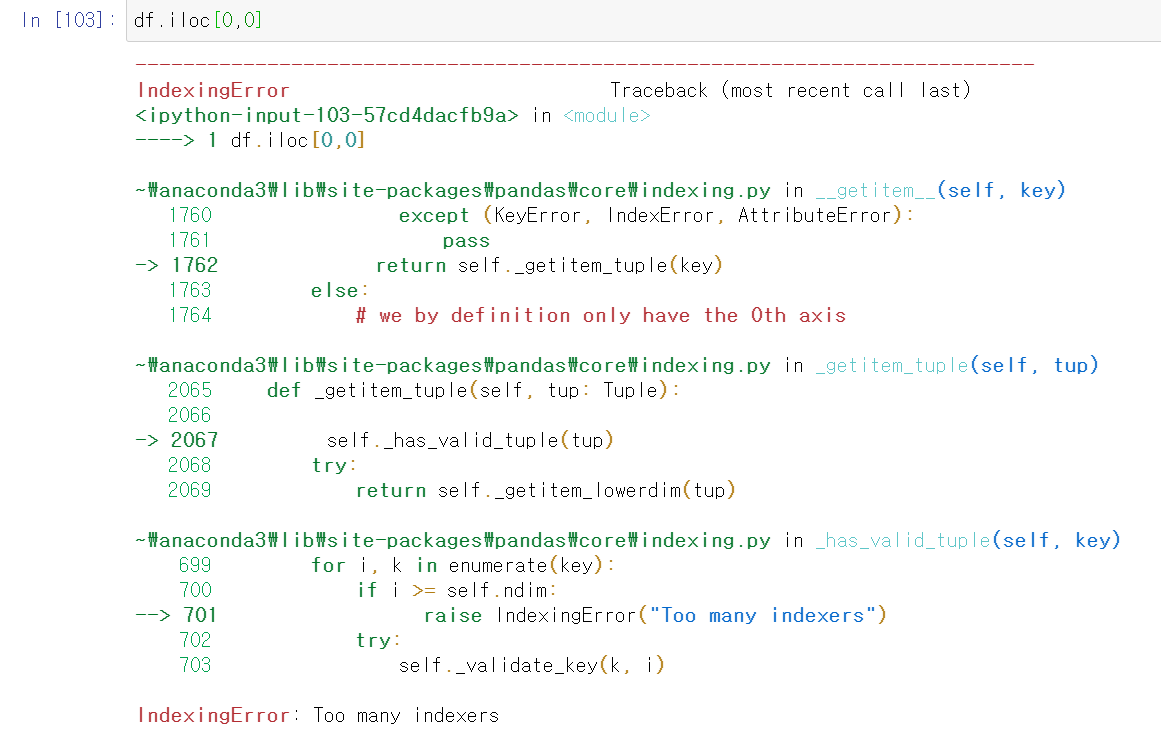
그래서 Series에서 사용할 시 실수를 범하지 말자
loc[]
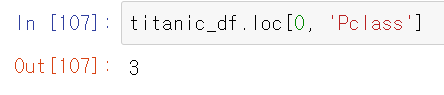
iloc와는 다르게 loc[]는 명칭 기반 인덱싱 기법이다. row 값에는 해당 index 값을, col에는 해당 칼럼 명을 적어준다. index값을 명칭 기반이라고 무조건 문자열이지는 않다. 정수형 index일 경우에는 해당 index의 숫자를 적어주면 된다.
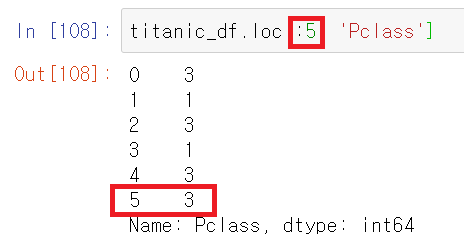
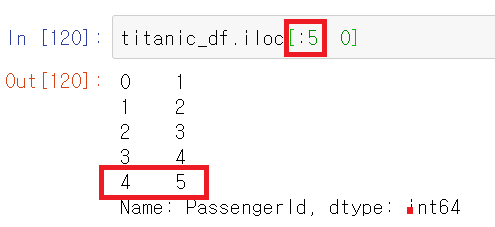
loc[]에서 슬라이싱 기호 :를 사용할 수 있는데 Numpy와 iloc[]와는 다르다. Numpy와 iloc[]에서는 슬라이싱을 할 시 종료 값은 종료값 - 1까지만 포함이 됬는데, loc[]에서 슬라이싱을 사용할 시 해당 종료값까지 포함을 한다.
그리고 추출 방법에 따라 자료구조는 다르다. 이는 iloc[]에서도 마찬가지다.
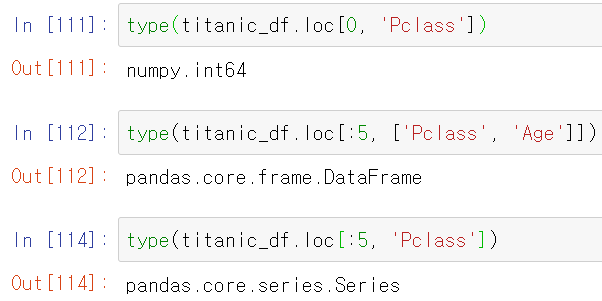
- 특정 데이터 값 하나만 출력하면 Numpy.int
- 여러 데이터 값(col도 여러개)을 출력하면 DataFrame
- row는 여러개지만 col은 한개만 추출할 시 Series
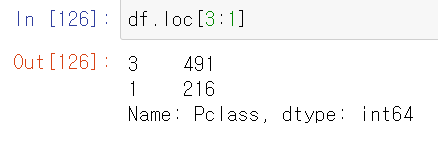
만약 인덱스가 차례로 0부터가 아닌 다른 숫자 구조로 되있으면 어떨까?
df DataFrame의 index는 3, 1, 2이다. 근데 loc를 통해 df.loc[0]을 실행하면 해당 index 명칭을 갖는 값은 없으니 당연히 오류가 발생한다.
따라서 슬라이싱을 할 때도 주의해야 한다.
불린 인덱싱
불린 인덱싱은 DataFrame[], loc[]에서 모두 사용 가능하다. titanic DataFrame에서 나이가 60이상인 데이터만 추출해보자.
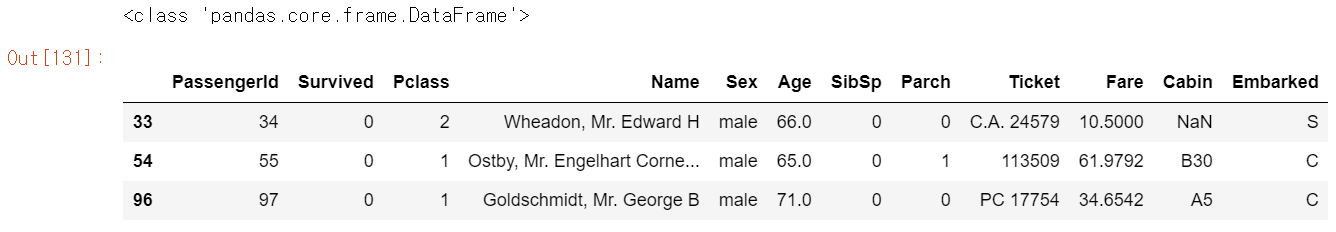
반환 자료구조를 살펴보면 DataFrame인 것을 확인할 수 있다. 따라서 불린 인덱싱을 적용하면 원하는 칼럼명만 별도로 추출이 가능하다. 나이가 60이상인 승객 중에 Survived와 Sex 칼럼만 따로 추출해보자
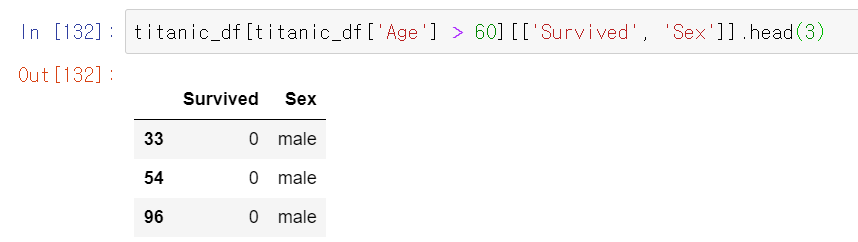
Age가 60 이상인 불린 인덱싱을 통해 DataFrame을 추출하고 그 DataFrame 중에 칼럼명을 리스트화한 ['Survived', 'Sex']을 통해 생존여부와 성별 칼럼만 따로 뽑아냈다.
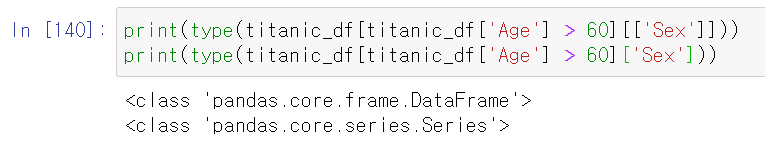
아 그리고 해당 칼럼을 한개만 추출할 때 주의할점이 []가 두개면 DataFrame, 한개면 Series 자료구조이다. 만약 두개 이상의 칼럼을 추출한다면 리스트로 칼럼명을 지정해줘야 하는 것은 기본이다.
loc를 통해 불린 인덱싱을 할 경우에는 조금 방법이 다르다.
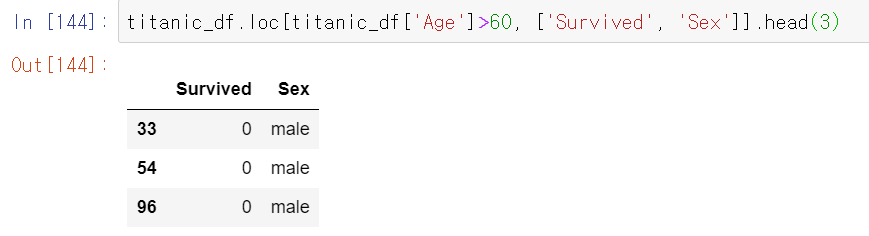
row 값에 해당 불린 인덱싱을, col 값에 해당 칼럼 명을 지정해주어야 한다.
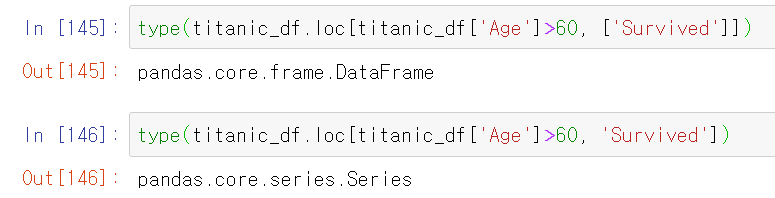
물론 loc[]에서도 []가 두개면 DataFrame, 한개면 Series의 구조를 갖는다.
조건을 복잡하게 해서 불린 인덱싱도 가능!!
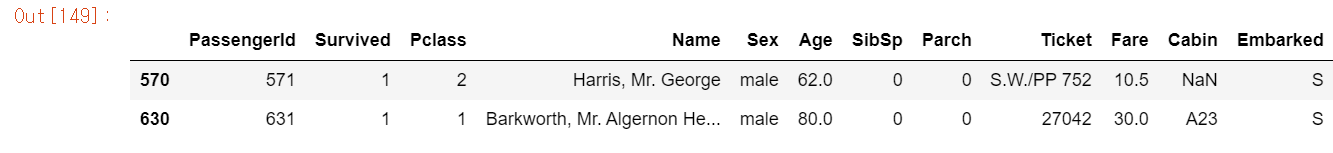
나이가 60 이상이며, 생존자이고, 성별이 남성인 데이터만 봐보자
titanic_df[(titanic_df.Survived == 1) & (titanic_df.Sex == 'male') & (titanic_df.Age > 60)]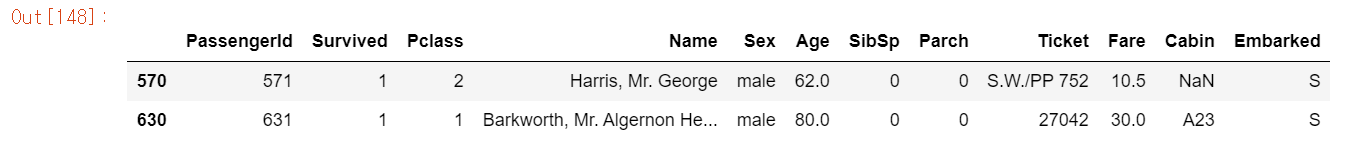
각 조건마다 ()로 묶어줘야 한다.
&는 and 연산자|는 or 연산자~는 not 연산자
아! 조건을 변수에다 저장할 수도 있다.
cond1 = titanic_df.Survived == 1
cond2 = titanic_df.Sex == 'male'
cond3 = titanic_df.Age > 60
titanic_df[cond1 & cond2 & cond3]