📌 실습진행
무작정 따라하기 -3 .html
https://cyan.kku.ac.kr/~sunwoo/classroom/2024-2/data/%EB%AC%B4%EC%9E%91%EC%A0%95%EB%94%B0%EB%9D%BC%ED%95%98%EA%B8%B0-3.html
# 리스트 만들기
mylist <- list(name="kim", quiz=c(50,40,30), score=c(80, 95))
mylist
# 키 이름 출력
print(names(mylist))
# 키 score 내용 출력
print(mylist$score)
# 키 quiz의 2번째 원소 출력
mylist$quiz[2]
# 텍스트 벡터 저으이
msg = c("unlist함수를 적용하면, 리스트에 입력된 순서대로 벡터의 원소가 됩니다. ",
"문자형만 있는 경우 factor로 반환됩니다.",
"The unlist R function converts a list to a single vector." )
# 각 텍스트를 " "를 기준으로 분리 -> 그 결과는 리스트(list)로 저장됨
strings <- strsplit(msg, " ")
print(strings)
# 리스트를 해제 - 벡터로 변환
vector <- unlist(strings)
print(vector)
class(vector)
length(vector)
# 행렬
A <- matrix(1:20, 4, 5)
A
A[1, ] # 1행만
A[ ,2:3] # 2, 3열만
rsum <- apply(A, 1, sum) # 각 행의 합
rsum
rmean <- apply(A, 1, mean) # 각 행의 평균
rmean
csum <- apply(A, 2, sum) # 각 열의 합
csum
cmean <- apply(A, 2, mean) # 각 열의 평균
cmean
# 데이터 프레임 만들기
n <- c("Kim", "Lee", "Park")
m <- c(70, 80, 90)
k <- c(85, 90, 95)
score <- data.frame(name=n, math=m, korean = k)
score
print(score)
score$math
# 새로운 변수 추가하기
score$total <- score$math + score$korean
score
# 데이터 초기화 - data mtcars
data(mtcars)
mtcars
# data mtcars
str(mtcars) # 구조 확인
mean(mtcars$mpg) # 평균 구하기
hist(mtcars$mpg) # 히스토그램
mtcars[1:10, 3:6] # 1-10행, 3-6열만 추출
row.names(mtcars)
# 행 인덱스(모델명)을
mtcars$model <- row.names(mtcars)
row.names(mtcars) <- 1:nrow(mtcars)
mtcars
# 범주형자료의 빈도표
table(mtcars$cyl)
# cyl 순으로 정렬
mtcars[order(mtcars$cyl), ]
# cyl, mpg 순으로 정렬
mtcars[order(mtcars$cyl, mtcars$mpg), ]
# cyl는 오름차순, mpg는 내람차순으로 정렬
mtcars[order(mtcars$cyl, -mtcars$mpg), ]
# cyl==8인 데이터만 추출
cyl8 <- subset(mtcars, mtcars$cyl == 8)
cyl8
# cyl==8인 데이터만 추출, 변수 5개만
subset(mtcars, mtcars$cyl == 8, select=c(1:5))
# 연비가 30이상인 데이터만 추출
highmpg <- subset(mtcars, mtcars$mpg >= 30)
highmpg
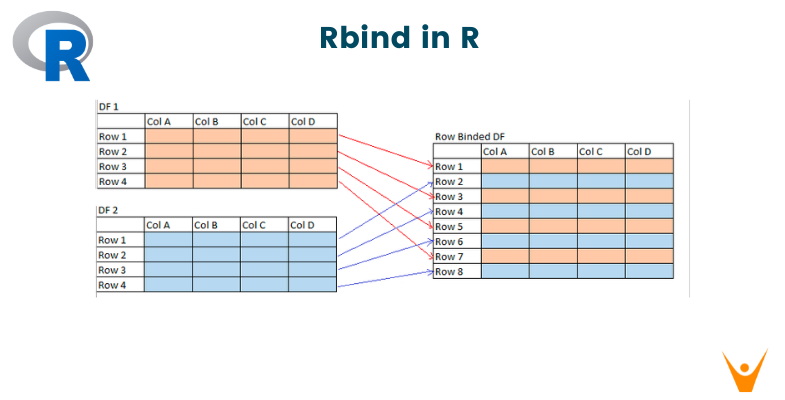
# rbind, cbind를 위한 데이터 추출
r1 <- mtcars[1:3, 1:2]
r2 <- mtcars[4:6, 1:2]
r1
r2
newr <- rbind(r1, r2)
newr
c1 <- mtcars[1:3, 1:2]
c2 <- mtcars[1:3, 3:4]
c1
c2
cbind(c1, c2)
# 데이터 ToothGrowth
head(ToothGrowth)
help(ToothGrowth)
str(ToothGrowth)
# 키 supp변수의 빈표표
table(ToothGrowth$supp)
# 데이터프레임을 supp를 기준으로 분리 -> 결과는 리스트에 저장
newT <- split(ToothGrowth, ToothGrowth$supp)
str(newT)
newT$OJ
newT$VC
# 엑셀 파일 읽기
library(readxl)
data <- read_xlsx("일별평균대기오염도_2023.xlsx")
head(data)
# 측정소가 "강남구"인 데이터만 추출
gangnam <- subset(data, 측정소명 == "강남구")
head(gangnam)
# '강남구'의 4월 데이터만 추출 -> 월이 문자형임에 주의
gangnam04 <- subset(data, 측정소명 == "강남구" & 월=="04", select=c(1,2,7,8))
gangnam04
# 2015년 미세먼지 데이터 읽기 -> 3개의 시트를 각각 읽어 저장
mise1 <- read_xlsx("2015년 미세먼지.xlsx", sheet = 1)
mise2 <- read_xlsx("2015년 미세먼지.xlsx", sheet = 2)
mise3 <- read_xlsx("2015년 미세먼지.xlsx", sheet = 3)
# 각 시트의 행의 수 확인
c(nrow(mise1), nrow(mise2), nrow(mise3))
# mise3의 앞부분 확인
head(mise3)
# rbind를 이용하여 3개의 데이터를 하나로 합침
mise <- rbind(mise1, mise2, mise3)
str(mise)
# 충북 데이터만 추출
idx <- grep("충북", mise$AREA)
cb <- mise[idx, ]
table(cb$Point)
# 지역(AREA)과 측정소(Point)를 합쳐서 새로운 변수 측정소에 저장
cb$측정소 <- paste(cb$AREA, cb$Point)
table(cb$측정소)
# 텍스트 데이터 읽기
text <- readLines("news.txt")
text
print(text)
📌스스로 해보기 – 3
2024년 11월 4일(월)
⚫ 과제 작성 및 제출 방법:
◼ jupyter notebook에서 파일 이름을 “학번-이름-exercise-3”으로 저장하여 TLS에 탑재
https://cyan.kku.ac.kr/~sunwoo/classroom/2024-2/data/R-exercise-3-2024.pdf
 |  |  |
|---|---|---|
 |  |  |
# 1번
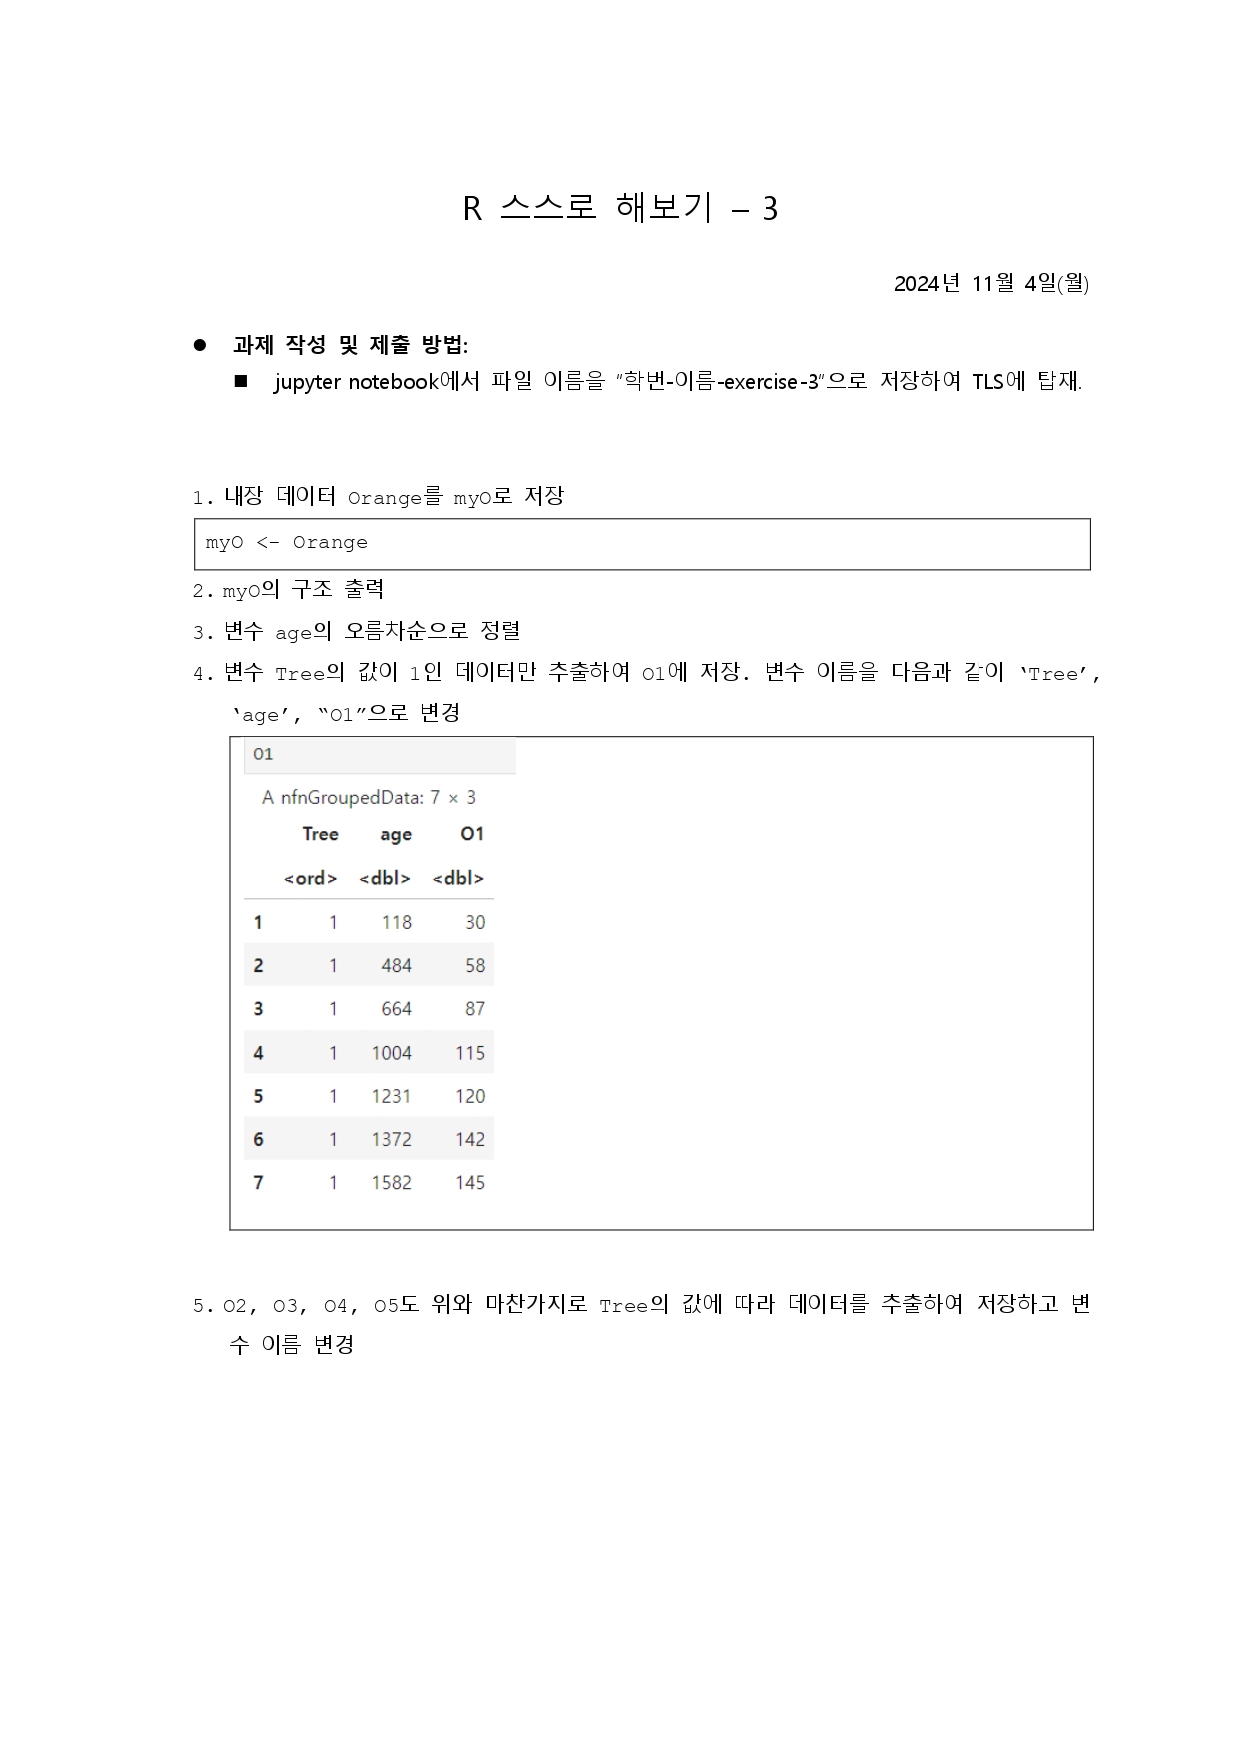
myO <- Orange
# 2번
str(myO)
# 3번
# 변수 age의 오름차순으로 정렬
print(myO[order(myO$age), ])
# 4번
# Tree 값이 1인 데이터만 추출하여 O1에 저장
O1 <- myO[myO$Tree == 1, ]
# 변수 이름 변경
names(O1) <- c("Tree", "age", "O1")
print(O1)
# 5번
# 각각 Tree값에 따라 추출
O2 <- myO[myO$Tree == 2, ]
O3 <- myO[myO$Tree == 3, ]
O4 <- myO[myO$Tree == 4, ]
O5 <- myO[myO$Tree == 5, ]
# 변수 이름 변경
names(O2) <- c("Tree", "age", "O2")
names(O3) <- c("Tree", "age", "O3")
names(O4) <- c("Tree", "age", "O4")
names(O5) <- c("Tree", "age", "O5")
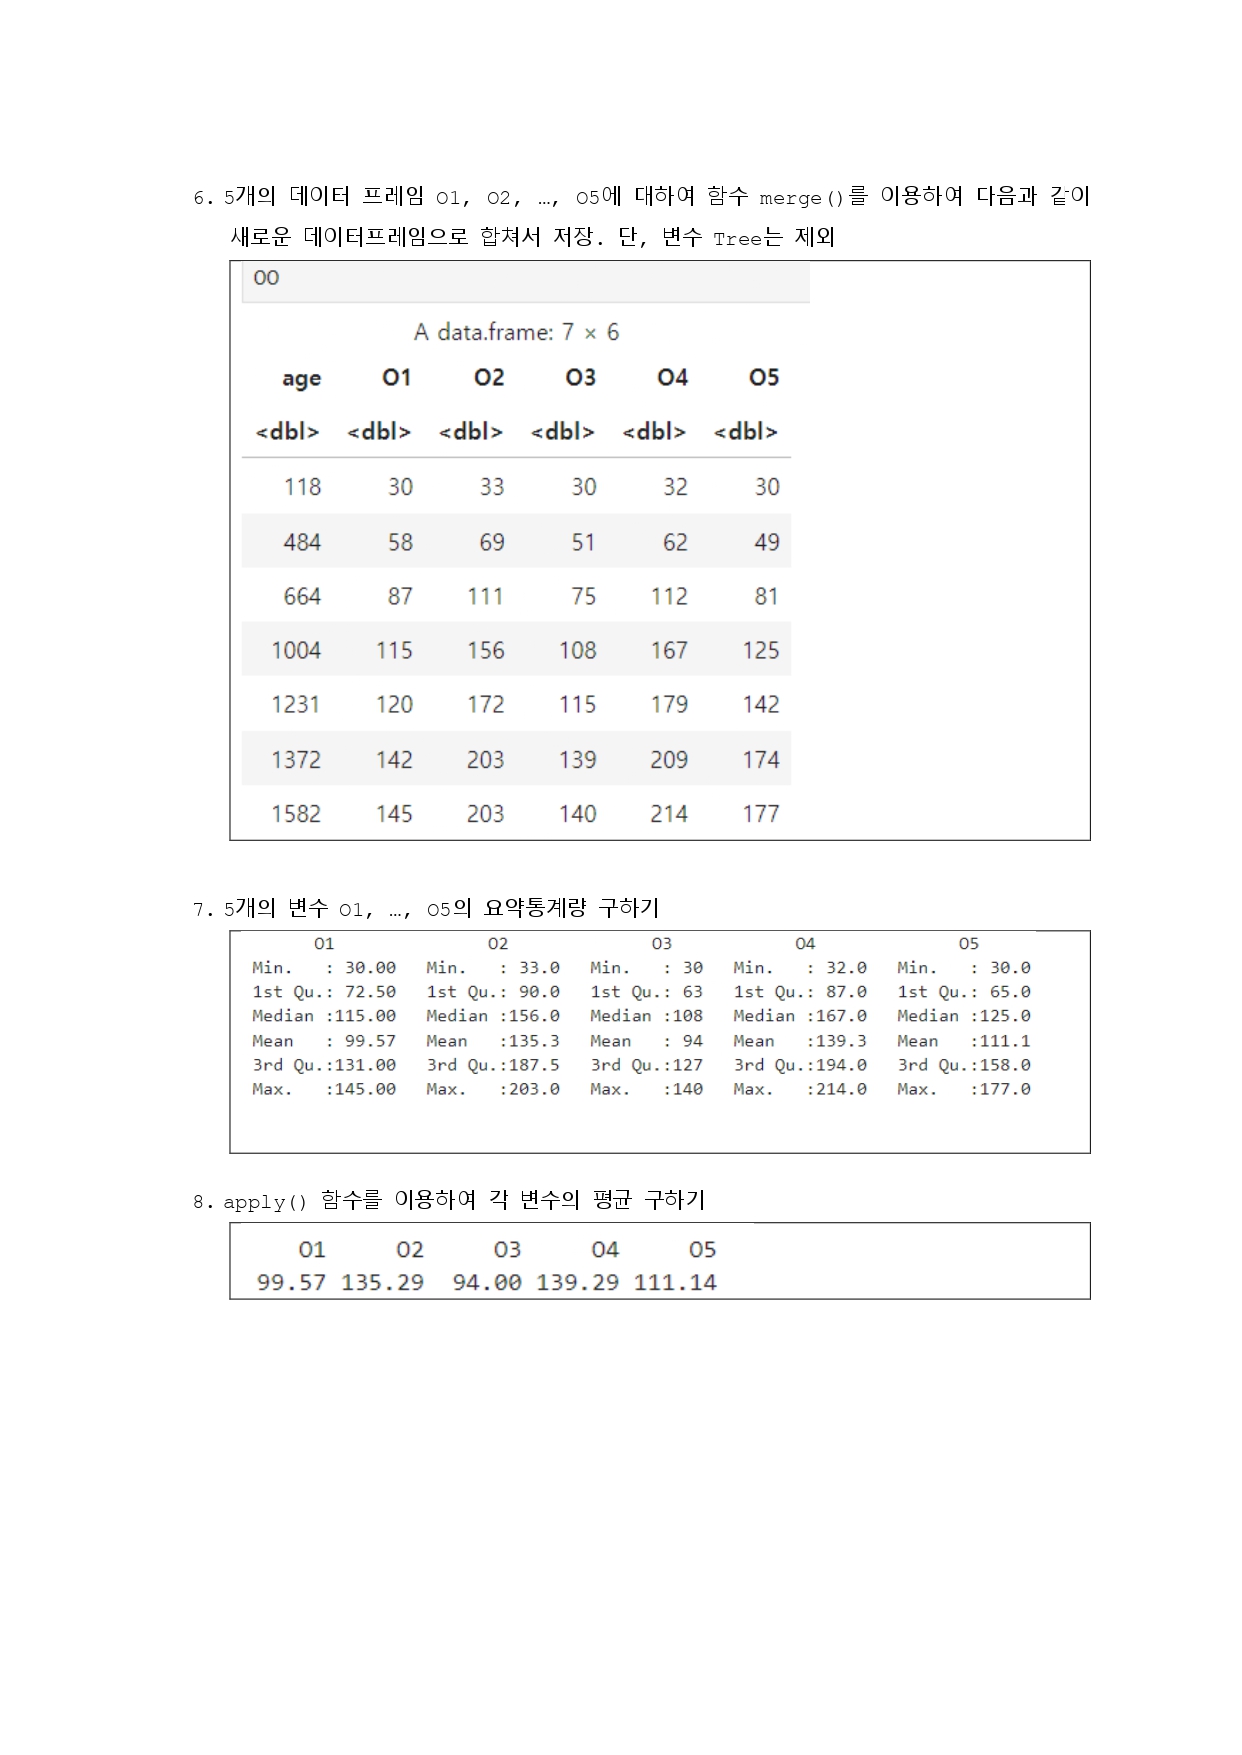
# 6번
# Tree 변수를 제외하고 각 데이터프레임 병합하기
O1_noTree <- O1[, -which(names(O1) == "Tree")]
O2_noTree <- O2[, -which(names(O2) == "Tree")]
O3_noTree <- O3[, -which(names(O3) == "Tree")]
O4_noTree <- O4[, -which(names(O4) == "Tree")]
O5_noTree <- O5[, -which(names(O5) == "Tree")]
# 데이터프레임 병합
merged_df <- Reduce(function(x, y) merge(x, y, all = TRUE), list(O1_noTree, O2_noTree, O3_noTree, O4_noTree, O5_noTree))
merged_df
# 7번
# age 변수를 제외하고 5개의 변수(O1, O2...) 요약 정보 출력
summary(merged_df[, !names(merged_df) %in% "age"])
# 8번
# 각 컬럼의 평균 계산
col_means <- round(apply(merged_df[, !names(merged_df) %in% "age"], 2, mean), 2)
print(col_means)
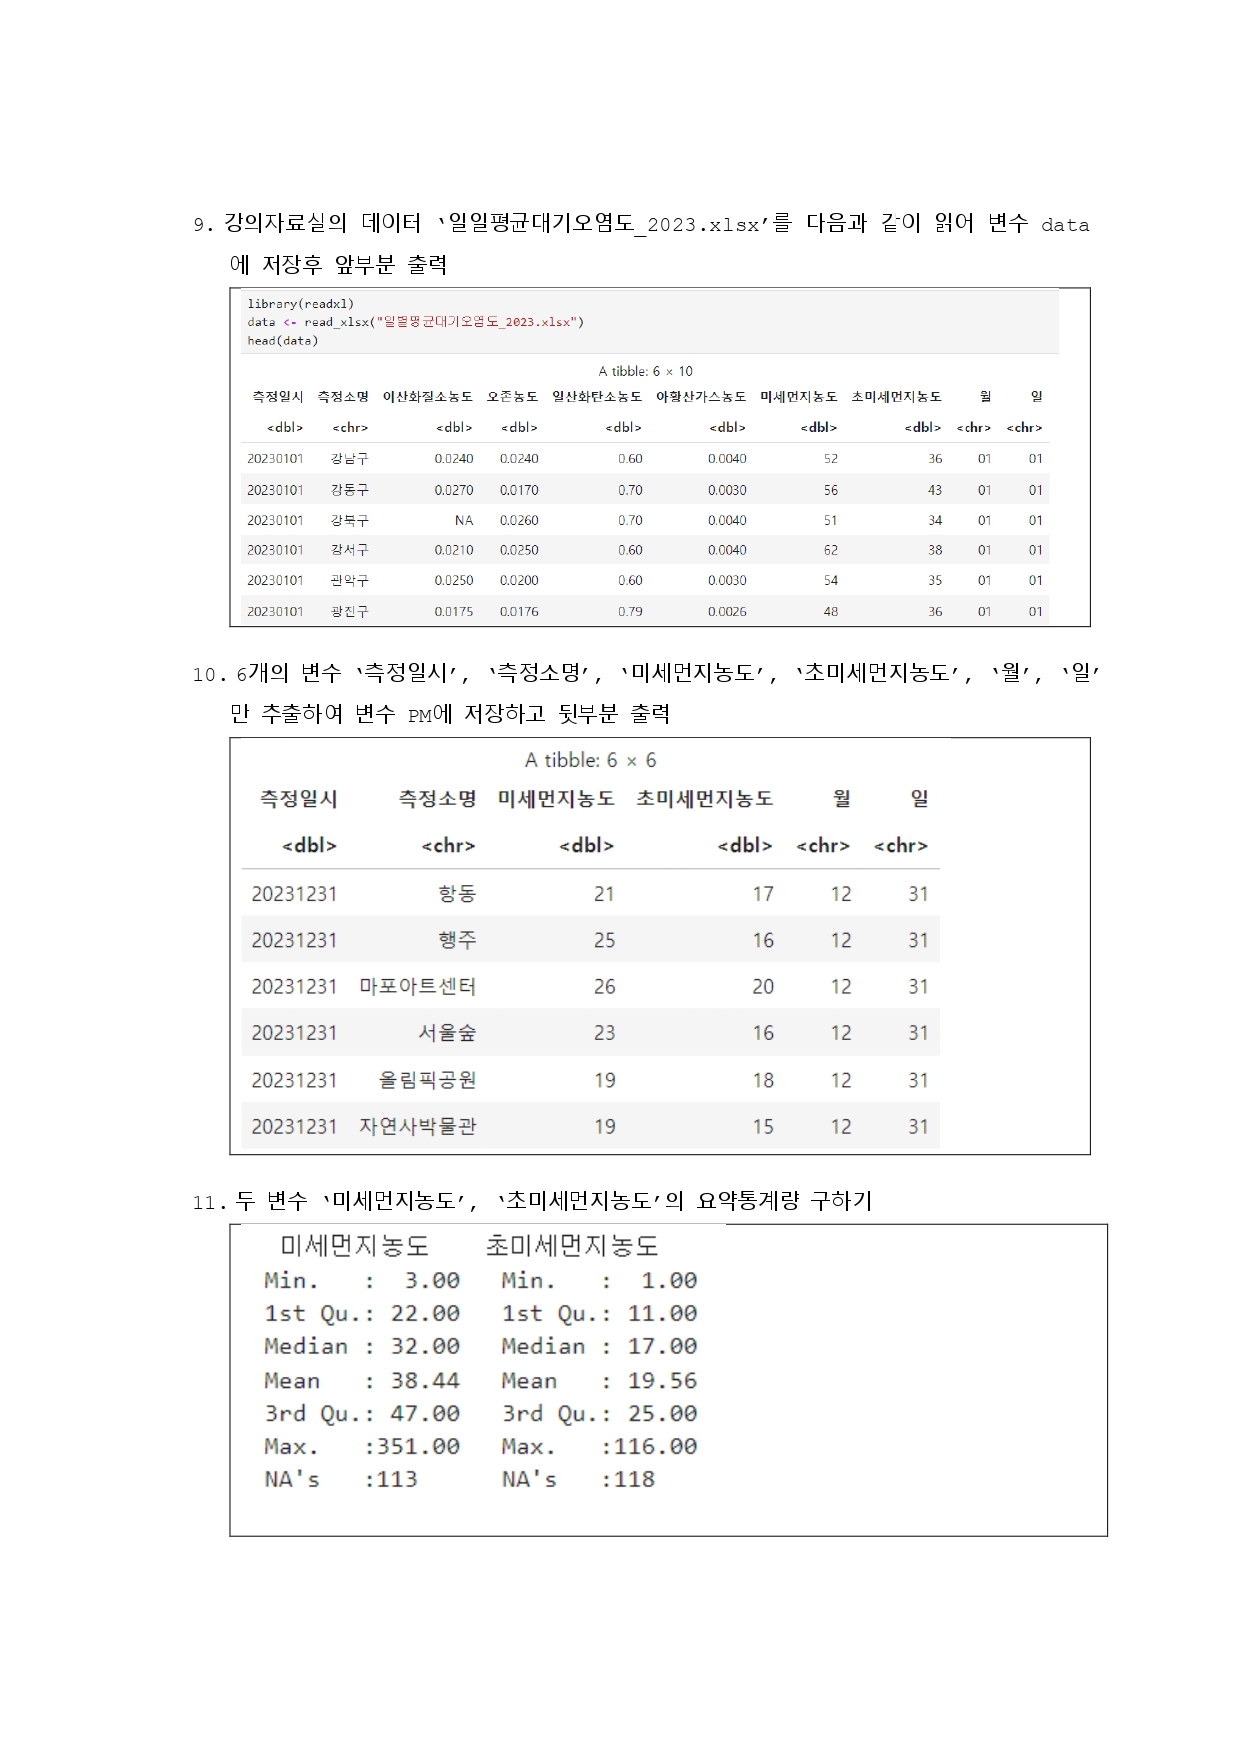
# 9번
library(readxl)
data <- read_xlsx("../mydata/일별평균대기오염도_2023.xlsx")
head(data)
# 10번
# 특정 컬럼만 선택하여 PM 데이터프레임 생성
PM <- subset(data, select = c(1, 2, 7, 8, 9, 10))
tail(PM)
# 11번
# 미세먼지와 초미세먼지 농도의 요약 통계량 계산
summary_stats <- summary(data[, c("미세먼지농도", "초미세먼지농도")])
print(summary_stats)
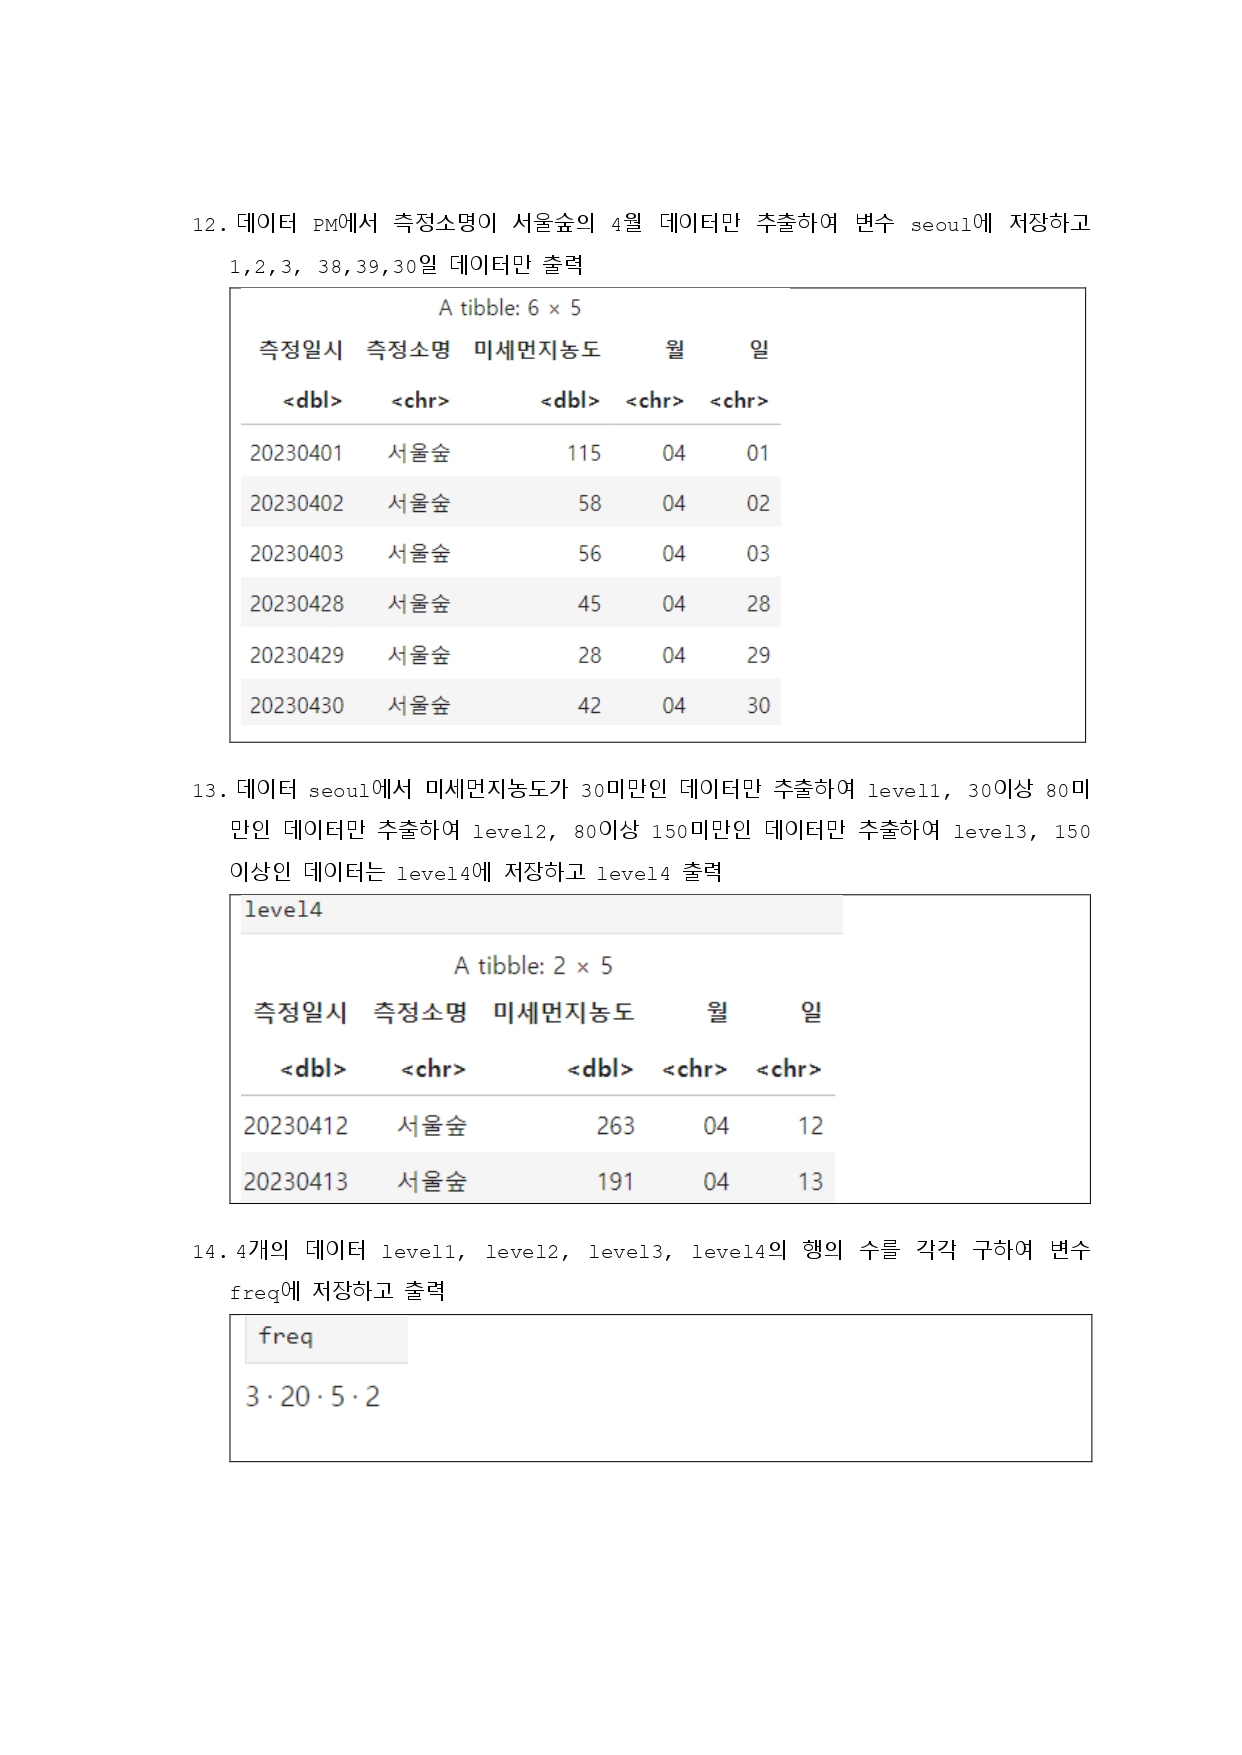
# 12번
# 서울숲 4월 데이터를 필터링하여 seoul 데이터프레임 생성
seoul <- subset(PM, 측정소명 == "서울숲" & as.numeric(월) == 4 & as.numeric(일) %in% 1:31)
seoul
# 13번
# 미세먼지 농도 수준에 따라 분류
level1 <- subset(seoul, 미세먼지농도 < 30)
level2 <- subset(seoul, 미세먼지농도 >= 30 & 미세먼지농도 < 80)
level3 <- subset(seoul, 미세먼지농도 >= 80 & 미세먼지농도 < 150)
level4 <- subset(seoul, 미세먼지농도 >= 150)
level4
# 14번
# 각 수준별 데이터 개수를 freq 데이터프레임으로 저장
freq <- data.frame(
Level = c("level1", "level2", "level3", "level4"),
Count = c(nrow(level1), nrow(level2), nrow(level3), nrow(level4))
)
freq
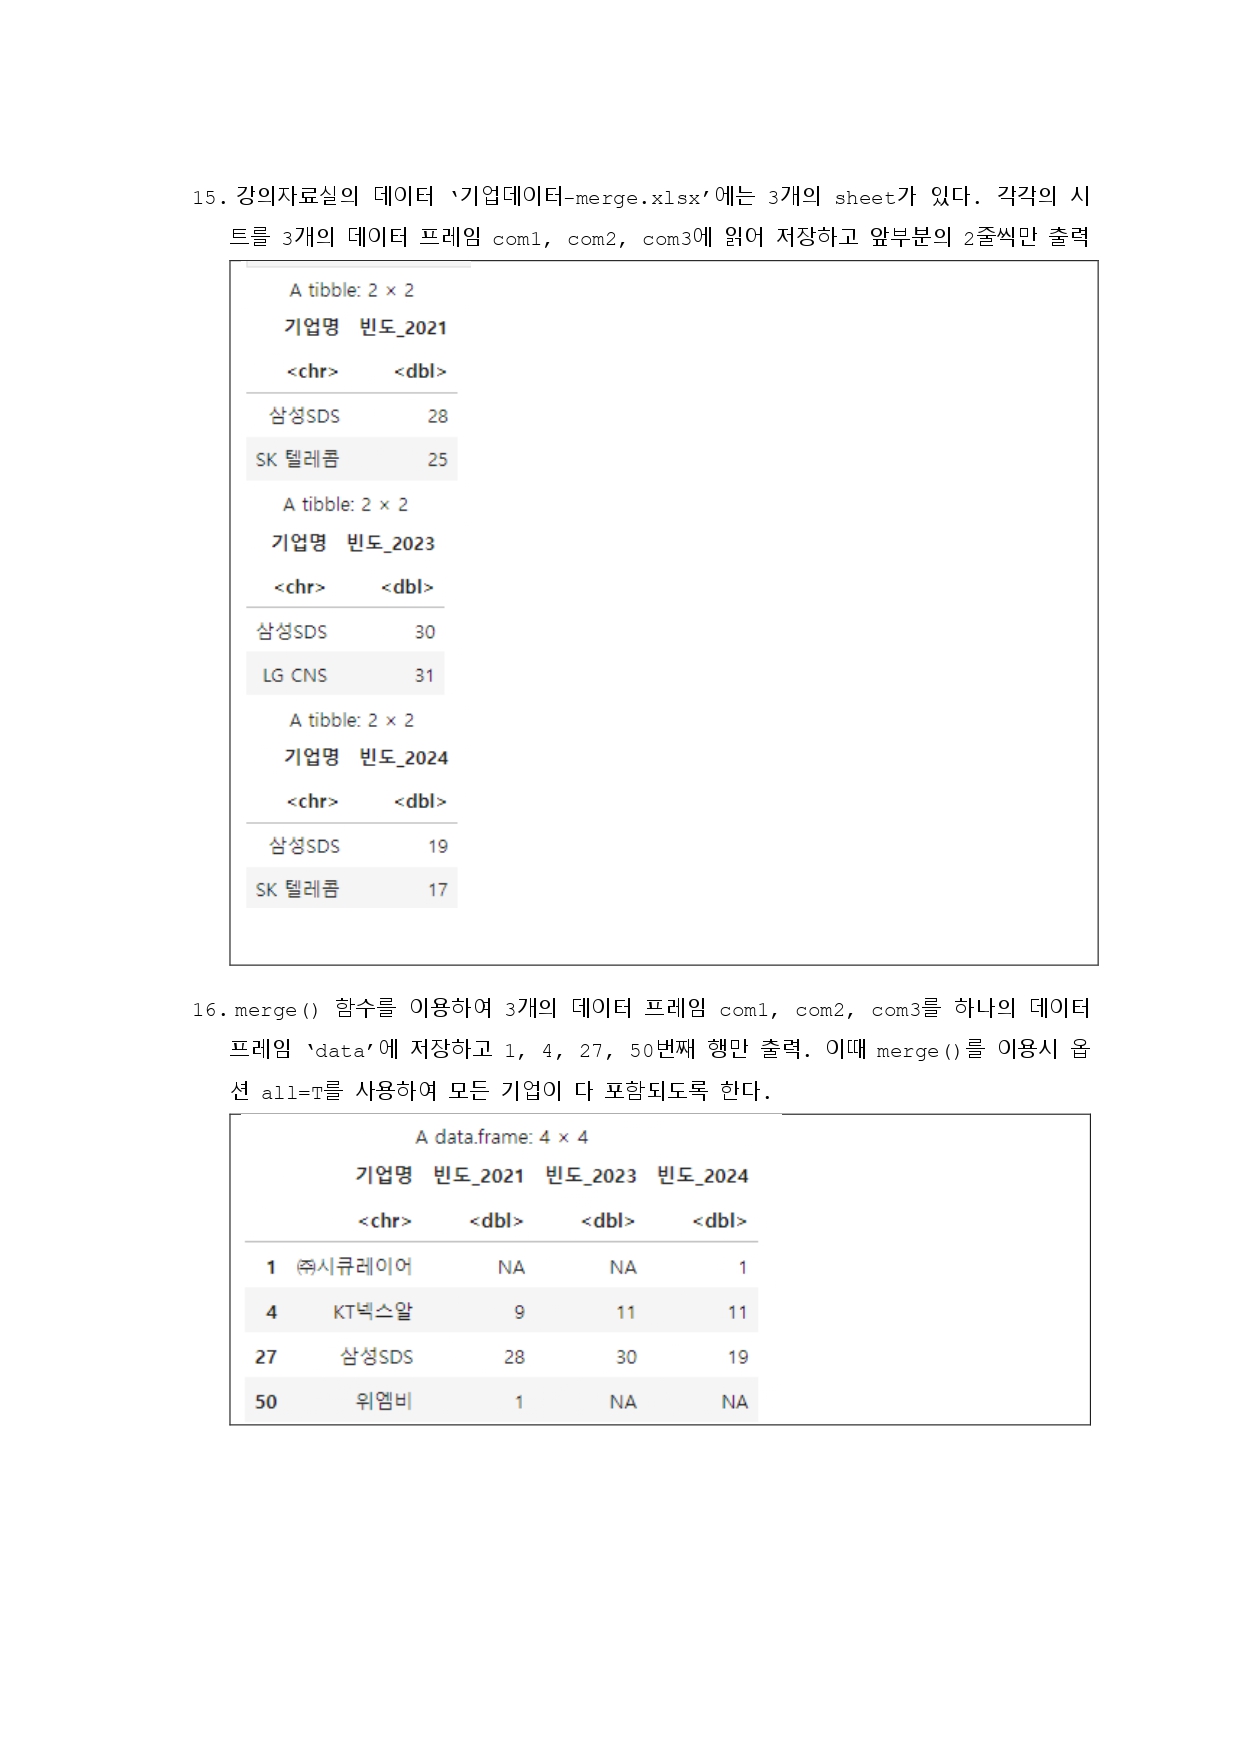
# 15번
# 기업 데이터 시트 읽기
com1 <- read_xlsx("../mydata/기업데이터-merge.xlsx", sheet = 1)
com2 <- read_xlsx("../mydata/기업데이터-merge.xlsx", sheet = 2)
com3 <- read_xlsx("../mydata/기업데이터-merge.xlsx", sheet = 3)
head(com1, 2)
head(com2, 2)
head(com3, 2)
# 16번
# 세 개의 시트를 모두 병합
data <- merge(com1, com2, all = TRUE)
data <- merge(data, com3, all = TRUE)
data[c(1, 4, 27, 50), ]
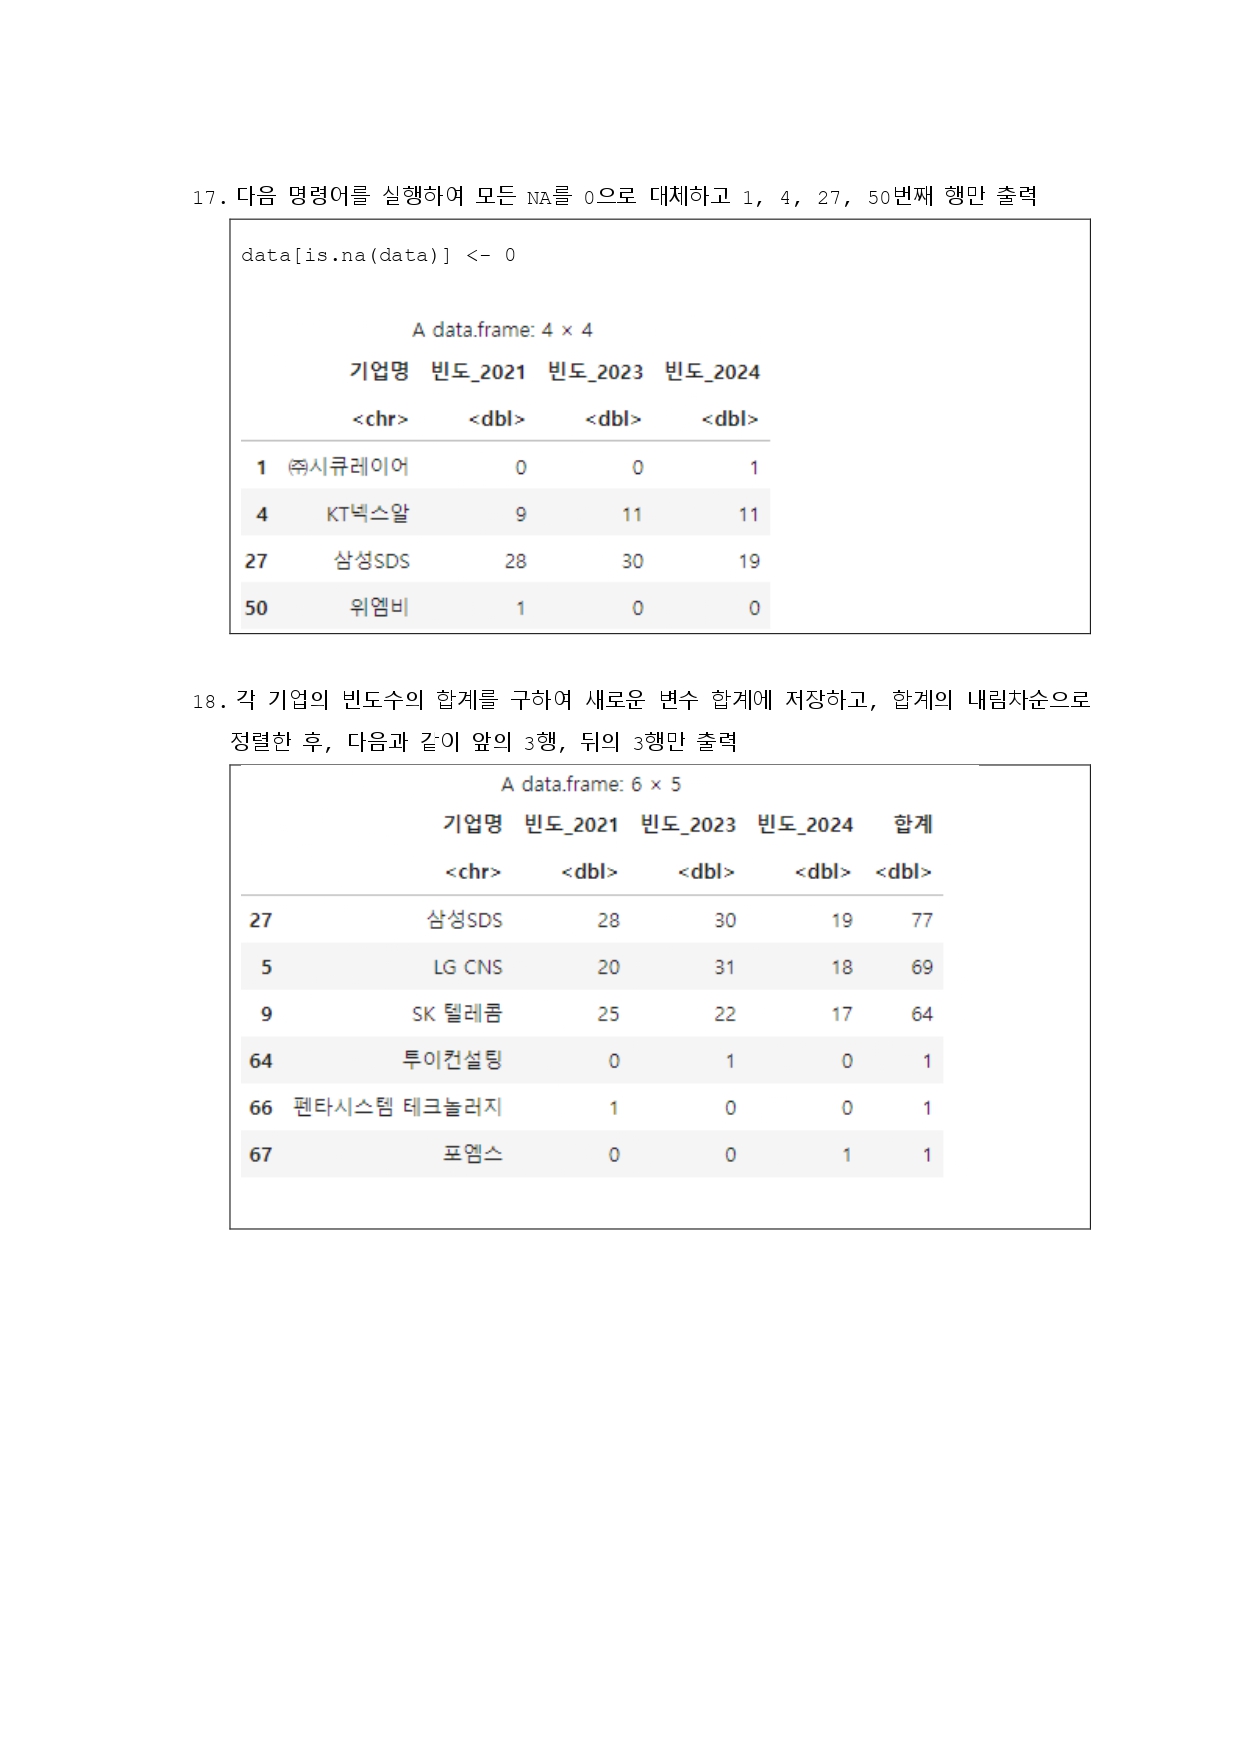
# 17번
# 결측값을 0으로 대체
data[is.na(data)] <- 0
data[c(1, 4, 27, 50), ]
# 18번
# 각 행의 합계를 구하고 합계 기준으로 정렬
data$합계 <- rowSums(data[, sapply(data, is.numeric)])
data_sort <- data[order(-data$합계), ]
# 최종 결과 추출
result <- data.frame(data_sort$기업명, data_sort$합계)
result

무지(無知)