
YOLOv3:An Incremental Improvement Paper
※ One stage object detector 논문 흐름
YOLOv1 => SSD => YOLOv2 => Feature Pyramid Network => RetinaNet => YOLOv3 => EfficientDet => YOLOv4
1. Introduction
YOLOv3는 논문이라기 보다 tech report에 가까운데 저자도 "So get ready for a TECH REPORT!"라고 언급하고 있다. 일반적으로 논문은 형식적인 글로 쓰여진 반면 YOLOv3는 상당수 구어체로 쓴 부분이 눈에 띈다.
그럼 YOLOv3는 어떤 내용일까?
"I managed to make some improvements to YOLO. But, honestly, nothing like super interesting, just a bunch of small changes that make it better. I also helped out with other people’s research a little"
→엄청 흥미로운건 아니고 YOLO에 변화를 조금 주고 더 나은 모델을 만들었다고 한다. 그럼 어떤 변화를 주었는지 아래에서 확인해보자.
2.The Deal
2.1 Bounding Box Prediction
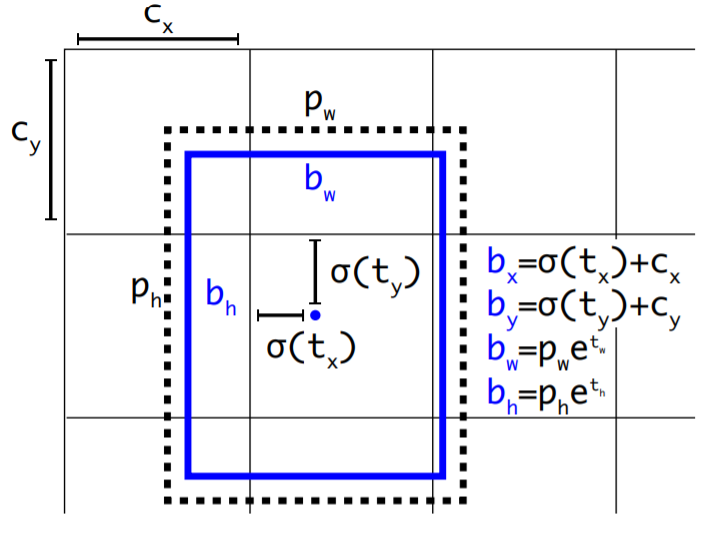
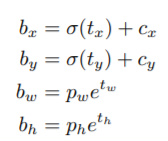
bounding box prediction은 YOLOv2와 큰 차이가 없다.
일단 t_x, t_y, t_w, t_h가 예측할 값이고 c_x, c_y는 왼쪽 상부의 offset 값이다. P_w, P_h는 사전에 설정된 anchor box의 넓이와 높이다. 즉 검은 점선이 ground truth 값이면 파란색은 예측한 bounding box이다.
학습시 sum squared error(SSE)를 loss로 사용했다.
gradient는 ground truth value에서 prediction value를 뺀 값이 된다. 이를 식으로 나타내면 다음과 같다. tˆ*− t*
"YOLOv3 predicts an objectness score for each bounding box using logistic regression. This should be 1 if the bounding box prior overlaps a ground truth object by more than any other bounding box prior"
→여기서 objectness score(물체가 있을 확률인 confidence score라고 해석해도 될거 같다.)를 logistic regression을 사용해 0~1 사이 값이 되게 계산한다.
그다음 다른 어떤 bounding box 보다 ground truth와 많이 겹치는 bounding box의 objectness score는 1이된다.
"We use the threshold of .5. Unlike our system only assigns one bounding box prior for each ground truth object"
→threshold는 0.5로 설정하고 하나의 ground truth object마다 하나의 bounding box를 할당한다.
2.2 Class Prediction
"Each box predicts the classes the bounding box may contain using multilabel classification. We do not use a softmax as we have found it is unnecessary for good performance, instead we simply use independent logistic classifiers. During training we use binary cross-entropy loss for the class predictions."
→classification 단계에서 하나의 레이블을 예측하는게 아니라 multilabel classification을 수행한다. softmax가 좋은 성능을 위해 필수적인게 아니기 때문에 independent logistic classifiers를 쓰는데 아마도 sigmod, ReLU, tanh 등 중에서 sigmoid나 tanh 같은 걸로 값을 제한해주는 classifier를 사용했지 않았나싶다. loss는 multilable에 주로 쓰이는 binary cross-entropy loss를 사용한다.
multilable classification을 하는 이유는 Open Images Dataset는 복잡하고 많은 레이블들이 겹쳐 있는데 예를들어 Woman과 Person은 상호배타적이지 않고 속성이 겹친 부분이 있으므로 이러한 데이터셋에는 multilabel classification이 더 적합하기 때문이다.
2.3 Predictions Across Scales
"YOLOv3 predicts boxes at 3 different scales."
→ 좀 더 자세히 말하자면 서로 다른 3개의 scales 각각으로부터 3개의 anchor box를 예측하여 총 9개 anchor box를 예측한다.
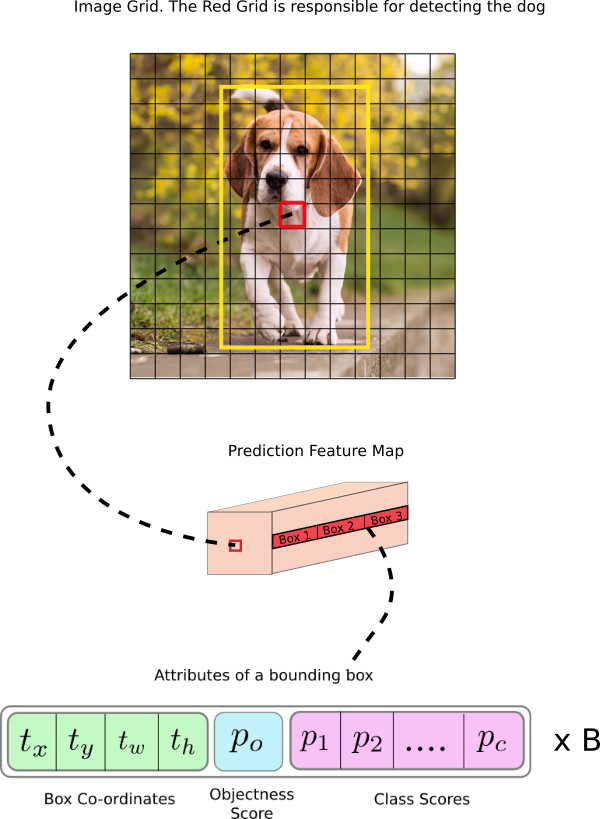
"In our experiments with COCO we predict 3 boxes at each scale so the tensor is N × N × [3 x (4 + 1 + 80)] for the 4 bounding box offsets, 1 objectness prediction, and 80 class predictions."
→COCO 데이터셋을 활용한 실험에서 tensor는 NxNx(3x(4+1+80))의 값을 가지는데 여기서 3은 하나의 scale에서 예측한 bounding box 개수, 4는 예측한 값 t_x, t_y, t_w, t_h이고 1은 confidence score, 80은 COCO dataset lable 개수이다. 즉 tensor는 NxNx255가 된다.
"We still use k-means clustering to determine our bounding box priors. We just sort of chose 9 clusters and 3 scales arbitrarily and then divide up the clusters evenly across scales. On the COCO dataset the 9 clusters were: (10×13),(16×30),(33×23),(30×61),(62×45),(59×119),(116×90),(156×198),(373×326)."
→anchor box를 결정하는 내용으로 k-means clustering을 사용한다. 3개의 scale을 사용하고, 각 scale 마다 box를 3개를 생성하여 총 9개의 clusters를 선택한다. 그 결과 COCO 데이터셋에 대하여 9개의 (10×13),(16×30),(33×23),(30×61),(62×45),(59×119),(116×90),(156×198),(373×326)가 생성된다.
2.4 Feature Extractor
드디어 Darknet-53에 관한 내용이다.
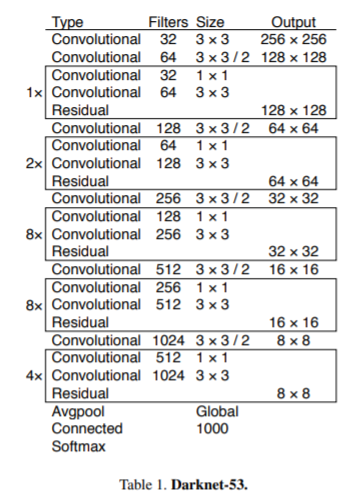
Darknet-19의 backbone에 Residual network를 추가하여 shortcut connection을 도입했고 3x3 Conv layer와 1x1 Conv layer가 연속적으로 연결되어 있는 총 53개 convolution layer로 구성되어 있어 이름이 Darknet-53이다.
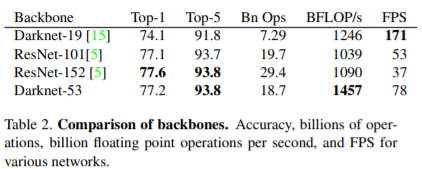
위 표는 ImageNet 데이터를 256x256 해상도에서 테스트 했으며 run time은 Titan X로 측정한 결과다.
Darknet-53는 SOTA classifier(ResNet-101, ResNet-152)와 비슷한 수준의 성능을 보이면서도 더 적은 연산량과 빠른 속도를 보인다. 또한 Darknet-53은 1457 BFLOP/s를 달성했다. 이는 1초간 얼마나 floating point operation을 할 수 있는지를 보여주는 지표로 다른 네트워크 보다 훨씬 더 빠르게 연산이 가능하고 구조적으로 GPU를 더 잘 사용함을 알 수 있다.
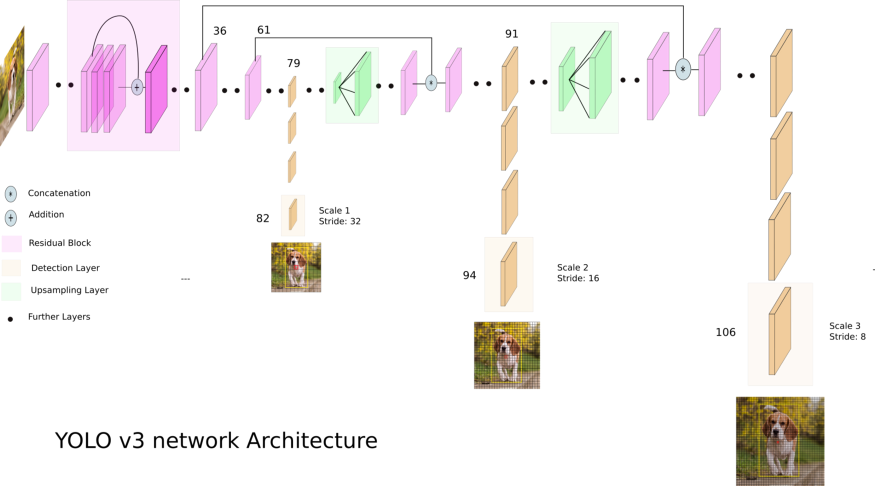
※on par with:~와 비슷한 수준이다.
2.5 Training
"We still train on full images with no hard negative mining or any of that stuff."
→no hard negative mining?
YOLO는 background class를 쓰지 않는데 objectness score를 이용해서 물체가 없으면 score를 날려버린다. 즉, 배경에는 score를 사용하지 않는다고 생각하면 되겠다.
"We use multi-scale training, lots of data augmentation, batch normalization, all the standard stuff. We use the Darknet neural network framework for training and testing."
→multi-scale training은 YOLOv2와 마찬가지로 다양한 해상도에서 학습을 시켰다.
특별한 내용은 업고 학습과 테스트 할 때 Darknet-53을 backbone으로 활용했다.
3.How We Do
📌 결과를 정리한 파트
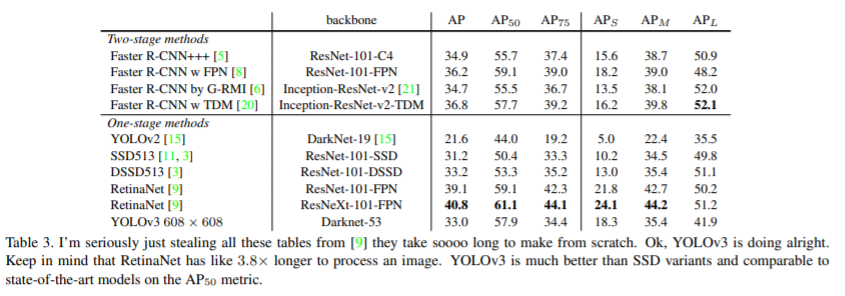
✔ COCO 데이터 셋에 대한 실험 결과를 다른 detection 모델과 정리한 표
✔ SSD 계열보다 성능이 좋지만 RetinaMet 보다는 성능이 좋지 못함을 볼 수 있음
✔ 작은 물체를 잘 detection하지 못하던 YOLOv2보다 작은 scale에서 AP가 훨씬 높아졌음을 확인할 수 있음
✔ 다만 중간 물체와 큰 물체에서 성능이 떨어져서 이에 대한 분석이 필요
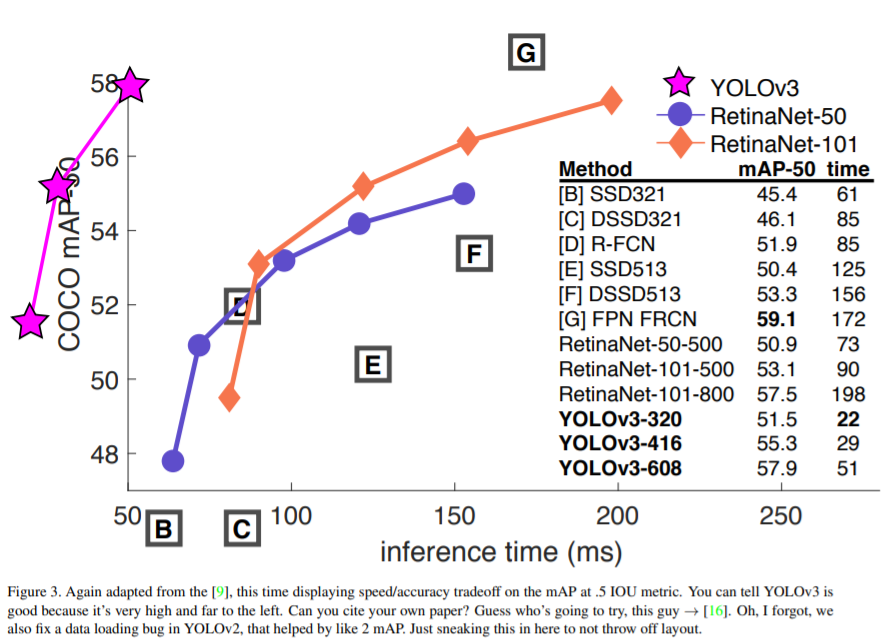
✔ COCO 데이터 셋에 관하여 mAP 기준 물체를 탐지하는 시간(inference time)을 측정한 그래프
✔RetinaNet 계열 보다 훨씬 속도는 빠르면서 높은 mAP를 보임
4. Things We Tried That Didn’t Work
📌 시도는 했으나 잘 되지 않은 점들을 정리한 세션
Anchor box x, y offset predictions
We tried using the normal anchor box prediction mechanism where you predict the x, y offset as a multiple of the box width or height using a linear activation. We found this formulation decreased model stability and didn’t work very well.
→ 일반적인 anchor box predict mechanism을 활용했다. 그러니까 width, height의 비율로 x, y offset을 예측하는데 이 때 linear activiation을 사용했고 그 결과 모델의 안정성이 감소했다.
Linear x, y predictions instead of logistic
Linear x, y predictions instead of logistic. We tried using a linear activation to directly predict the x, y offset instead of the logistic activation. This led to a couple point drop in mAP.
→ x,y offset을 예측시 logisic activation 대신 linear activation을 사용했는데 mAP 감소가 있었다.
Focal loss
We tried using focal loss. It dropped our mAP about 2 points.
→ RetinaNet에서 사용했던 focal loss를 활용했더니 mAP 2 points 감소했다.
이 부분은 아직 이해가 덜 가서 이해하는대로 업데이트 하겠다.
Dual IOU thresholds and truth assignment
Faster RCNN uses two IOU thresholds during training. If a prediction overlaps the ground truth by .7 it is as a positive example, by it is ignored, less than .3 for all ground truth objects it is a negative example. We tried a similar strategy but couldn’t get good results.
→ Faster RCNN은 학습시 두 개의 IOU threshold를 사용한다. 만약에 IOU가 0.7 이상이면 positive이고 0.3 이하면 negative이고 그 사이 값인 0.3~0.7은 무시된다.(Dual IOU threshold) 이 아이디어를 YOLOv3에도 적용해보았지만 좋은 결과를 얻지 못했다.
5. What This All Means
YOLOv3 is a good detector. It’s fast, it’s accurate. It’s
not as great on the COCO average AP between .5 and .95
IOU metric. But it’s very good on the old detection metric
of .5 IOU.
→ YOLOv3는 빠르고 정확한 좋은 detector이다. COCO 데이터셋에서 .5 ~ .95사이의 IOU metric에서 좋은 성능을 보여주지 못하지만 오래된 metric인 .5 IOU에서 좋은 성능을 보인다.
Why did we switch metrics anyway? The original COCO paper just has this cryptic sentence: “A full discussion of evaluation metrics will be added once the evaluation server is complete”. Russakovsky et al report that that humans have a hard time distinguishing an IOU of .3 from .5! “Training humans to visually inspect a bounding box with IOU of 0.3 and distinguish it from one with IOU 0.5 is surprisingly difficult.” If humans have a hard time telling the difference, how much does it matter?
→ 저자는 COCO 데이터셋의 metric을 바꾸는게 어떨까하는 제안을 한다.
COCO 논문에서 evaluation server가 완성되면 평가지표에 대한 discussion이 추가 될거라고 언급했다고 한다. 그리고 인간이 0.5 IOU의 bbox와 0.3 IOU의 bbox를 서로 구분하는데 어려움이 있다고 하는데 예측한 anchor box와 gt를 거의 근접하게 일치시켜야 하는 성능지표가 그렇게 중요한 것인지이 대한 의문점을 제시한다.
But computer vision is already being put to questionable use and as researchers we have a responsibility to at least consider the harm our work might be doing and think of ways to mitigate it. We owe the world that much. In closing, do not @ me. (Because I finally quit Twitter).
→ 컴퓨터 비전이 이미 군사적 목적으로 이용되는데 연구자로서 이러한 사용에 대해 책임감을 갖자는 내용이다. 끝으로 Twitter를 그만뒀으니 @하지 말라고 한다.
Rebuttal
📌 논문에 대한 여러 리뷰를 보고 수정한 내용을 정리한 파트
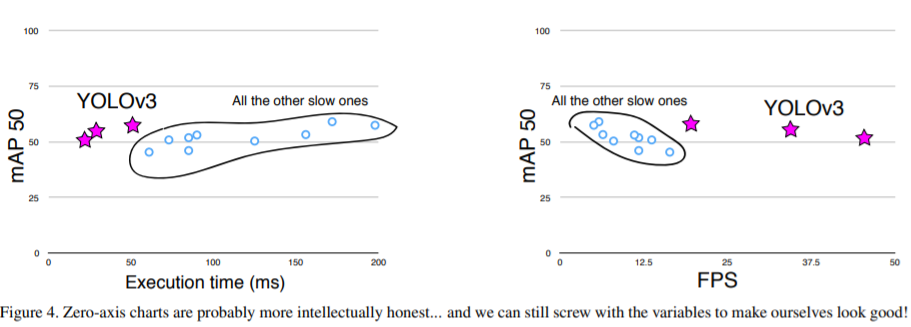
✔ fig3에 원점이 없다는 코멘트를 보고 그래프를 수정
✔ 하나는 x축에 execution time 다른 하나는 FPS를 설정, FPS를 설정한 그래프를 보면 YOLOv3가 다른 모델들 보다 얼마나 빠른지 단번에 알 수 있다.
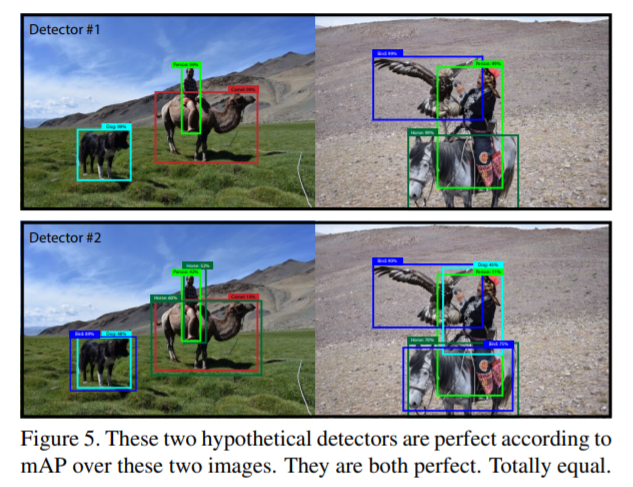
✔ 위에서 언급한 COCO metric에 대한 비판을 좀 더 보충 설명한다.
Does COCO have better labelling than VOC? This is definitely possible since COCO has segmentation masks maybe the labels are more trustworthy and thus we aren’t as worried about inaccuracy. But again, my problem was the lack of justification
→ COCO 데이터셋은 segmentation mask를 갖고 있으므로 lable이 PASCAL 보다 더 정확할 수 있지만 그것이 IOU threshold를 높게 잡아하는 이유가 되지 않는다는 내용으로 판단된다. 그러니까 COCO 데이터셋이 요구하는 높은 기준으로 bounding box를 예측해야만 하는 것은 아니다라는 말이다.
The COCO metric emphasizes better bounding boxes but that emphasis must mean it de-emphasizes something else, in this case classification accuracy.
→COCO의 metric은 더 정확한 bounding box를 강조하는데 이러면 다른 하나가 덜 강조될 수 밖에 없고 이 경우는 classification이 덜 강조된다.
mAP is already screwed up because all that matters is per-class
rank ordering. For example, if your test set only has these two
images then according to mAP two detectors that produce these
results are JUST AS GOOD:
→ mAP의 문제점은 class 별로 mAP를 계산하기 때문에 하나의 물체에 몇개의 bbox가 예측되도 그 중 하나가 정확히 분류를해서 높은 score를 가진다면 mAP 수치는 높게 나올 수 밖에 없다는 점이다. 사진을 보면 위쪽 그림이 bbox를 더 깔끔하게 예측하고 classification도 완벽한데도 아래 그림과 동일한 mAP를 갖는다. 아래 그림은 사람을 말이라고 분류하고 낙타도 말이라고 분류한다. 이러한 경우 아래 그림이 detection과 classification을 제대로 수행하지 못했음에도 mAP수치가 높게 나오기 때문에 위 그림과 동일한 평가를 받는다는 것이다.
Here’s a proposal, What about getting rid of the per-class AP and just doing a global average precision? Or doing an AP calculation per-image and averaging over that?
→ 클래스별 AP 계산이 아닌 전체적으로 average precision을 계산하거나 이미지별로 AP를 계산해서 mAP를 계산하는게 어떠냐는 제안을 한다.