
서론
지난 번에는 와인의 화학적 특성에 따른 품질 점수에 대해 EDA 실습을 진행하였다. 스스로 가설을 세우고, 검증하며 어떤 방식으로 시각화를 할지 고민하는 과정에서 인사이트를 얻을 수 있었다.
다만, 이번에는 좀더 실무와 연관 있는 Hotel Booking Demand Dataset 을 활용하여, 고객들의 예약 취소를 줄이기 위해 호텔 관리인이 어떤 조치를 해야 하는지 알아보고자 한다.
이를 통해 비즈니스 문제를 EDA 와 연결하여 해결하는 역량을 기르고자 한다.
0. import 및 data read
import pandas as pd
import matplotlib.pyplot as plt
import seaborn as sns
import numpy as np
hotel = pd.read_csv("data/hotel_data_modified.csv")
hotel.head()# hotel.head() 실행 결과
hotel is_canceled lead_time arrival_date_year arrival_date_month arrival_date_week_number arrival_date_day_of_month stays_in_weekend_nights stays_in_week_nights adults children babies meal country market_segment distribution_channel is_repeated_guest previous_cancellations previous_bookings_not_canceled reserved_room_type assigned_room_type booking_changes agent company days_in_waiting_list required_car_parking_spaces total_of_special_requests reservation_status reservation_status_date
Resort Hotel 0 342 2015 July 27 1 0 0 2 0 0 BB PRT Direct TA/TO 0 0 0 C C 3 NaN NaN 0 0 0 Check-Out 2015-07-01
Resort Hotel 0 737 2015 July 27 1 0 0 2 0 0 BB PRT Direct TA/TO 0 0 0 C C 4 NaN NaN 0 0 0 Check-Out 2015-07-01
Resort Hotel 0 7 2015 July 27 1 0 1 1 0 0 BB PRT Direct TA/TO 0 0 0 A C 0 NaN NaN 0 0 0 Check-Out 2015-07-02
Resort Hotel 0 13 2015 July 27 1 0 1 1 0 0 BB PRT Direct TA/TO 0 0 0 A A 0 304.0 NaN 0 0 0 Check-Out 2015-07-02
Resort Hotel 0 14 2015 July 27 1 0 2 2 0 0 BB PRT Direct TA/TO 0 0 0 A A 0 240.0 NaN 0 0 1 Check-Out 2015-07-03기본적으로 주피터 노트북에서 나오는 결과값은 열이 너무 많아 velog 마크다운에서 짤리는 현상이 발생하였다.
*이에 코드블록으로 해당 데이터를 확인할 수 있도록 처리하여 표시하였다.
1. 프로젝트 소개 (Introduction)
-
본 프로젝트에서는 Hotel Booking Demand Dataset을 활용하여 호텔 예약 취소 현상을 분석함.
-
해당 데이터는 2015년 7월부터 2017년 8월까지의 City Hotel과 Resort Hotel 예약 정보를 포함하고 있음.
-
예약 고객의 특성, 예약 방식, 체류 기간, 동반 인원 수, 특수 요청 사항 등 다양한 변수를 담고 있음.
-
호텔 예약 취소는 매출에 직접적인 영향을 미치는 중요한 요인으로, 고객 행동 패턴과 외부 요인을 함께 고려해야 관리할 수 있는 문제임.
-
본 분석에서는 호텔 관리자의 입장에서 예약 취소율에 영향을 주는 주요 요인을 파악하고, 이를 통해 취소율을 줄일 수 있는 아이디어를 도출하는 것을 목표로 함.
2. 데이터 분석 목표(Objectives)
-
예약 취소와 관련된 요인 파악
-
City Hotel과 Resort Hotel 비교
-
예약 취소율을 줄이기 위한 개선 아이디어 제안
3. Hotel Booking Demand Dataset 컬럼 설명
| 컬럼명 | 설명 |
|---|---|
hotel | 호텔명 (Resort Hotel 혹은 City Hotel) |
is_canceled | 호텔 예약이 취소되었는지(1) 혹은 취소되지 않았는지(0)를 나타내는 값 |
lead_time | 호텔 예약 시점부터 고객의 호텔 도착 시점까지의 기간 (단위: 일) |
arrival_date_year | 고객의 호텔 도착 연도 |
arrival_date_month | 고객의 호텔 도착 월 |
arrival_date_week_number | 고객의 호텔 도착 주 (예: 2015년도 셋째 주 도착 → 3) |
arrival_date_day_of_month | 고객의 호텔 도착 일 (예: 3월 2일 도착 → 2) |
stays_in_weekend_nights | 고객이 예약한 주말 숙박 수 (토~일). 예: 평일 3일, 주말 2일 예약 → 2 |
stays_in_week_nights | 고객이 예약한 평일 숙박 수 (월~금). 예: 평일 3일, 주말 2일 예약 → 3 |
adults | 예약된 성인 수 |
children | 예약된 어린이 수 |
babies | 예약된 아기 수 |
meal | 예약된 식사 유형 - Undefined/SC: 식사 불포함 - BB: Bed & Breakfast - HB: Half board (아침+저녁) - FB: Full board (아침+점심+저녁) |
country | 투숙객의 출신 국가 (ISO 3155-3:2013 형식) |
market_segment | 시장 세그먼트 ("TA"=Travel Agent, "TO"=Tour Operators 등) |
distribution_channel | 예약 유통 채널 ("TA"=Travel Agent, "TO"=Tour Operators 등) |
is_repeated_guest | 이전에 방문한 고객인지 여부 (1=재방문, 0=신규) |
previous_cancellations | 현재 예약 이전에 고객이 취소한 예약 수 |
previous_bookings_not_canceled | 현재 예약 이전에 취소하지 않은 예약 수 |
reserved_room_type | 예약한 객실 타입 코드 |
assigned_room_type | 배정된 객실 타입 코드 (호텔 운영 사정 또는 고객 요청으로 예약과 다른 경우 가능) |
booking_changes | 예약 후 취소/체크인까지 변경·수정된 횟수 |
agent | 예약을 진행한 여행사 ID |
company | 예약을 한 회사/단체의 ID (또는 예약금 지불 책임 단체) |
days_in_waiting_list | 예약 확정 전 대기자 명단에 있었던 일수 |
required_car_parking_spaces | 고객이 요청한 주차 공간 수 |
total_of_special_requests | 고객의 특별 요청 수 (예: 트윈 베드, 아기 침대, 고층 등) |
reservation_status | 예약의 최종 상태 - Canceled: 예약 취소 - Check-Out: 체크인 후 체크아웃 완료 - No-Show: 고객 미도착, 사유 불명 |
reservation_status_date | 예약 최종 상태(reservation_status)가 설정된 날짜 |
print(hotel.shape)
hotel.info()
(119390, 29)
<class 'pandas.core.frame.DataFrame'>
RangeIndex: 119390 entries, 0 to 119389
Data columns (total 29 columns):
# Column Non-Null Count Dtype
--- ------ -------------- -----
0 hotel 119390 non-null object
1 is_canceled 119390 non-null int64
2 lead_time 119390 non-null int64
3 arrival_date_year 119390 non-null int64
4 arrival_date_month 119390 non-null object
5 arrival_date_week_number 119390 non-null int64
6 arrival_date_day_of_month 119390 non-null int64
7 stays_in_weekend_nights 119390 non-null int64
8 stays_in_week_nights 119390 non-null int64
9 adults 119390 non-null int64
10 children 119386 non-null float64
11 babies 119390 non-null int64
12 meal 119390 non-null object
13 country 118902 non-null object
14 market_segment 119390 non-null object
15 distribution_channel 119390 non-null object
16 is_repeated_guest 119390 non-null int64
17 previous_cancellations 119390 non-null int64
18 previous_bookings_not_canceled 119390 non-null int64
19 reserved_room_type 119390 non-null object
20 assigned_room_type 119390 non-null object
21 booking_changes 119390 non-null int64
22 agent 103050 non-null float64
23 company 6797 non-null float64
24 days_in_waiting_list 119390 non-null int64
25 required_car_parking_spaces 119390 non-null int64
26 total_of_special_requests 119390 non-null int64
27 reservation_status 119390 non-null object
28 reservation_status_date 119390 non-null object
dtypes: float64(3), int64(16), object(10)
memory usage: 26.4+ MB-
해당 데이터셋은 119,390행 * 29열 로 이루어져 있다.
-
결측치가 존재하는 열은 agent 와 company 열로, 총 2개이다.
*(추가 내용) 실습 종료 이후 확인된 점은 결측치가 존재하는 열은 총 4개이다. (children, country, agent, company)
결측치를 한눈에 확인하려면 isna().sum() 사용하는 것을 권장한다...
4. 가설
메인 가설: 고객의 니즈가 명확할 수록 취소 확률이 낮을 것이다.
가설 1. 투숙객의 국가
- 해외 여행을 계획하는 외국인 투숙객의 경우, 취소 확률이 더 낮을 것이다.
- A. 예약자가 내국인인 경우
- B. 예약자가 외국인인 경우
- A보다 B의 취소 확률이 더 낮을 것이다.
*특이사항: 호텔이 위치하는 국가의 위치를 확인해야함.
가설 2. 원하는 객실 유형
- 원하는 객실 유형이 있는 경우, 취소 확률이 더 낮을 것이다.
- A. 고객이 예약한 객실 유형이 있는 경우
- B. 고객이 예약한 객실 유형이 없는 경우
- A보다 B의 취소 확률이 더 높을 것이다.
*특이사항: 해당 컬럼이 필수 입력란인 경우(결측치 또는 미입력 값이 없는 경우), 해당 가설은 검증할 수 없다.
가설 3. 고객의 특별 요청 수
- A. 고객의 특별 요청이 있는 경우
- B. 고객의 특별 요청이 없는 경우
- A 보다 B의 취소 확률이 더 높을 것이다.
가설 4. 고객이 요청한 주차 공간 수
- A. 고객이 요청한 주차 공간이 있는 경우
- B. 고객이 요청한 주차 공간이 없는 경우
- A보다 B의 취소 확률이 더 높을 것이다.
가설 5. 리드 타임(호텔 예약 시점부터 고객의 호텔 도착 시점까지의 기간)
- 리드 타임이 길수록, 취소 확률이 더 낮을 것이다.
- 리드 타임에 따른 예약 취소 수의 분포를 비교한다.
*특이사항: 예약 보증금이 있었는지 유뮤를 확인할 수 없음.
가설 6. 이전 방문 여부
- 이전에 방문한 적 있는 고객일 수록, 취소 확률이 더 낮을 것이다.
- A. 재방문 고객인 경우
- B. 이전에 방문한 적 없는 고객인 경우
- A보다 B의 취소 확률이 더 높을 것이다.
5. 결측치 처리
- 데이터셋 정보를 확인하였을 때, company 컬럼의 결측치가 많음을 확인하였다.
- company 컬럼과 관련된 가설은 없으므로, 이번 데이터 분석간 해당 컬럼의 결측치 처리는 필요하지 않다.
- 다만 학습 차원에서 결측치 처리가 필요한 경우에 어떻게 처리하면 좋을지 해당 company 컬럼을 점검하였다. (agent 컬럼은 미처리)
company_count = hotel['company'].value_counts(dropna=False)  # 각 값별 빈도수
company_count
company
NaN 112593
40.0 927
223.0 784
67.0 267
45.0 250
...
18.0 1
273.0 1
368.0 1
393.0 1
132.0 1
Name: count, Length: 353, dtype: int64company_unique = hotel['company'].nunique() # 고유 값 종류 개수
company_unique352- 해당 컬럼은 결측치가 112,593개, 값이 있는 경우가 6,797개로 결측치가 훨씬 많음을 확인하였다.
- 해당 컬럼의 고유값은 352개로, 예약을 한 회사/단체의 ID 이므로 값이 일정하지 않아 범주화하기 어렵다는 특징이 있다.
- 따라서, 결측치인 경우는 개인이 예약한 것으로, 값이 있는 경우 회사/단체를 통해 예약한 경우로 가정하여 이분법적 구분을 할 수 있다.
- 결측치인 경우는 특정 값(0)으로 변환하고, 특정 값과 특정 값이 아닌 경우를 비교하여 데이터를 비교할 수 있다.
hotel.loc[hotel['company'] == 0]| hotel | is_canceled | lead_time | arrival_date_year | arrival_date_month | arrival_date_week_number | arrival_date_day_of_month | stays_in_weekend_nights | stays_in_week_nights | adults | ... | reserved_room_type | assigned_room_type | booking_changes | agent | company | days_in_waiting_list | required_car_parking_spaces | total_of_special_requests | reservation_status | reservation_status_date |
|---|
0 rows × 29 columns
- 호텔의 company 컬럼에서 기존에 0 을 가진 row 는 없으므로, 결측치를 0으로 처리하였다.
hotel['company'] = hotel['company'].fillna(0)
print(hotel['company'].value_counts())
print(hotel['company'].isna().value_counts())
company
0.0 112593
40.0 927
223.0 784
67.0 267
45.0 250
...
18.0 1
273.0 1
368.0 1
393.0 1
132.0 1
Name: count, Length: 353, dtype: int64
company
False 119390
Name: count, dtype: int646. 가설 검증
- 데이터셋 확인 및 결측치 처리가 완료되었으므로, 각 가설에 대한 검증을 수행한다.
메인 가설: 고객의 니즈가 명확할 수록 취소 확률이 낮을 것이다.
가설 1. 투숙객의 국가
- 해외 여행을 계획하는 외국인 투숙객의 경우, 취소 확률이 더 낮을 것이다.
- A. 예약자가 내국인인 경우
- B. 예약자가 외국인인 경우
- A보다 B의 취소 확률이 더 낮을 것이다.
*특이사항: 호텔이 위치하는 국가의 위치를 확인해야함.
해당 데이터 셋에 대해 검색한 결과, 호텔이 위치한 국가는 포르투갈로 확인하였다.
value_counts 를 통해 국가별 예약 건수를 재확인하였다. 총 177개의 국가가 있다.
그 중 포르투갈 국민이 가장 많은 예약을 했음을 알 수 있다.
print(f"호텔 예약 고객들의 국가 수는 총 {hotel['country'].nunique()}개 입니다.")호텔 예약 고객들의 국가 수는 총 177개 입니다.hotel['country'].value_counts().head(20)country
PRT 48590
GBR 12129
FRA 10415
ESP 8568
DEU 7287
ITA 3766
IRL 3375
BEL 2342
BRA 2224
NLD 2104
USA 2097
CHE 1730
CN 1279
AUT 1263
SWE 1024
CHN 999
POL 919
ISR 669
RUS 632
NOR 607
Name: count, dtype: int64- 호텔 방문객들의 국가 상위 20개를 보면, 호텔이 위치한 국가인 포르투갈(PRT)가 가장 많은 예약 수를 차지하고 있다. 이는 현지 고객들의 예약이 가장 많음을 의미한다.
- 또한, 포르투갈이 위치한 유럽 대륙의 인근 국가들인 영국(GBR), 프랑스(FRA), 스페인(ESP), 독일(DEU), 이탈리아(ITA), 아일랜드(IRL), 벨기에(BEL), 네덜란드(NLD) 등이 높은 수치를 차지하고 있어 유럽권 고객들의 예약이 많음을 알 수 있다.
- 이 외에도 미국(USA), 중국(CN) 등 비유럽권 국가들도 상위권에 올라 있음을 확인할 수 있어 다양한 대륙에서 방문객이 호텔 예약에 참여하고 있음을 보여준다.
# 내외국인 구분 컬럼 생성
hotel['Nationality'] = hotel['country'].apply(lambda x: 'Domestic' if x == 'PRT' else 'Foreign')

# 예약 취소 여부 컬럼 생성: 'Canceled' 만 취소, 'No-Show', 'Check-Out'은 취소하지 않음으로 간주
hotel['Cancelled'] = hotel['reservation_status'].apply(
    lambda x: 'Cancelled' if x == 'Canceled' else 'Completed'
)

# 내국인 데이터 필터링 및 집계, 순서 지정
domestic_data = hotel[hotel['Nationality'] == 'Domestic']
domestic_counts = domestic_data['Cancelled'].value_counts().reindex(['Cancelled', 'Completed'], fill_value=0)

# 외국인 데이터 필터링 및 집계, 순서 지정
foreign_data = hotel[hotel['Nationality'] == 'Foreign']
foreign_counts = foreign_data['Cancelled'].value_counts().reindex(['Cancelled', 'Completed'], fill_value=0)

# 파이 차트 그리기
fig, axes = plt.subplots(1, 2, figsize=(12, 6))

axes[0].pie(domestic_counts, labels=domestic_counts.index, autopct='%1.1f%%', colors=['red', 'green'], startangle=90)
axes[0].set_title('Reservation Status for Domestic Visitors')

axes[1].pie(foreign_counts, labels=foreign_counts.index, autopct='%1.1f%%', colors=['tomato', 'skyblue'], startangle=90)
axes[1].set_title('Reservation Status for Foreign Visitors')

plt.show()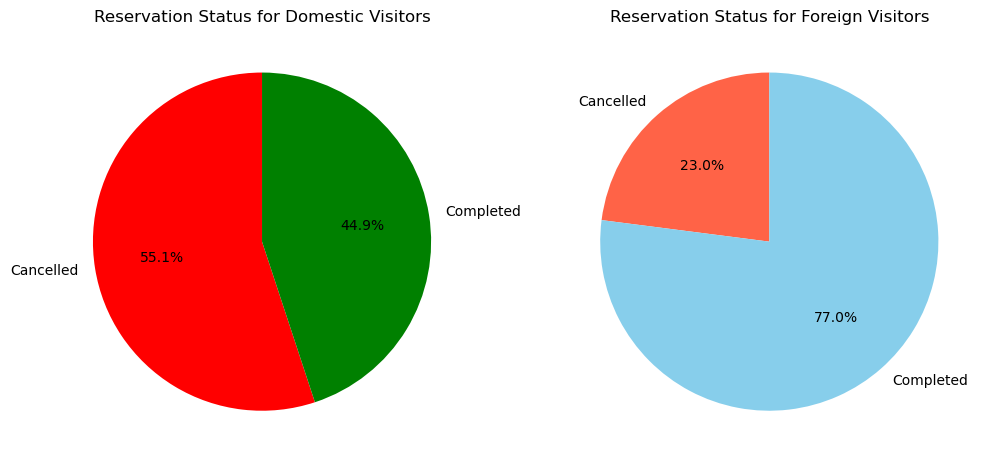
가설 1. 검증 결과
- 내국인(포르투갈인)의 경우, 취소 확률이 55.1%로 외국인에 비해 훨씬 높았다.
- 외국인의 경우, 취소 확률은 23.0%로 내국인에 비해 현저히 낮았다.
- 따라서, “외국인 예약객의 경우 국내 예약객보다 취소할 확률이 낮을 것이다”라는 가설이 지지된다고 볼 수 있다.
- 다만, 노쇼(No-show)를 취소하지 않은 상태(Completed)에 포함하여 분석했으므로 실제로는 취소를 하지 못한 채 노쇼가 발생한 경우가 있을 수 있다. 이처럼 노쇼 사례의 원인이나 특성을 추가로 분석할 필요가 있다.
가설 2. 원하는 객실 유형
- 원하는 객실 유형이 있는 경우, 취소 확률이 더 낮을 것이다.
- A. 고객이 예약한 객실 유형이 있는 경우
- B. 고객이 예약한 객실 유형이 없는 경우
- A보다 B의 취소 확률이 더 높을 것이다.
*특이사항: 해당 컬럼이 필수 입력란인 경우(결측치 또는 미입력 값이 없는 경우), 해당 가설은 검증할 수 없다.
hotel['reserved_room_type'].unique()array(['C', 'A', 'D', 'E', 'G', 'F', 'H', 'L', 'P', 'B'], dtype=object)hotel['reserved_room_type'].value_counts(dropna=False)reserved_room_type
A 85994
D 19201
E 6535
F 2897
G 2094
B 1118
C 932
H 601
P 12
L 6
Name: count, dtype: int64가설 2. 검증 결과
- 원하는 객실 유형이 없는 케이스(결측치 또는 관련 value)가 없음을 확인하였다.
- 즉, 가설 설정에서 오류가 있음을 확인하였다.
- 따라서 해당 가설은 검증하지 않고 넘어가도록 한다.
가설 3. 고객의 특별 요청 수
- A. 고객의 특별 요청이 있는 경우
- B. 고객의 특별 요청이 없는 경우
- A 보다 B의 취소 확률이 더 높을 것이다.
hotel['total_of_special_requests'].value_counts(dropna=False)total_of_special_requests
0 70318
1 33226
2 12969
3 2497
4 340
5 40
Name: count, dtype: int64- A.의 경우: 0
- B.의 경우: 1, 2, 3, 4, 5
# requests 컬럼 생성: 0이면 False, 그 외 True
hotel['requests'] = hotel['total_of_special_requests'].apply(lambda x : False if x == 0 else True)
hotel['requests'].value_counts()
requests
False 70318
True 49072
Name: count, dtype: int64# 'requests'와 'reservation_status'별 방문 수 집계
count_data = hotel.groupby(['requests', 'reservation_status']).size().reset_index(name='count')
# 막대그래프 그리기
ax = sns.barplot(data=count_data, x='requests', y='count', hue='reservation_status')
plt.title('Special Request Presence vs Reservation Status')
plt.xlabel('Special Request Made')
plt.ylabel('Number of Reservations')
plt.xticks([0, 1], ['No Requests', 'Has Requests'])
plt.legend(title='Reservation Status')
# 각 막대 위에 값 표시
for p in ax.patches:
height = p.get_height()
if height > 0:
ax.annotate(f'{int(height)}',
(p.get_x() + p.get_width() / 2, height + 3),
ha='center', va='bottom', fontsize=10, color='black')
plt.show()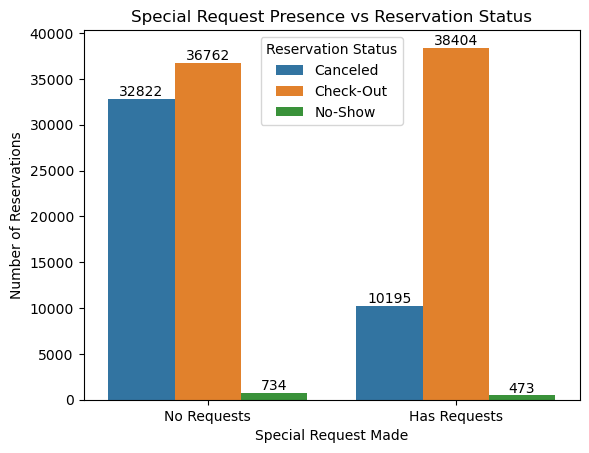
가설 3. 검증 결과 (1)
- 특수 요청이 0 인 경우, 요청이 있는 경우보다 예약이 취소된 수가 훨씬 높음을 확인 할 수 있다.
- 다만, 해당 그래프의 경우 특수 요청 유무에 따라서만 비교를 하여 예약 취소와 특수 요청 수에 따른 상관 관계를 파악하기는 어렵다.
- 따라서 특수 요청의 갯수에 따른 취소 요청 건수 및 비율을 추가로 확인해본다.
# 'Canceled' 상태의 데이터만 필터링
canceled_data = hotel[hotel['reservation_status'] == 'Canceled']

# 히스토그램 그리기 (special_requests가 0~5의 범주를 갖기 때문에, bins=range(0,7)로 설정)
ax = sns.histplot(
    data=canceled_data,
    x='total_of_special_requests',
    bins=range(0, 7),            # 0~6 구간(0,1,2,3,4,5)로 나눔
    discrete=True,
    color='skyblue'
)

plt.title('Histogram of Special Requests (Cancelled Reservations)')
plt.xlabel('Total of Special Requests')
plt.ylabel('Count')
plt.xticks(range(6))

# 막대 위에 값 표시
for p in ax.patches:
    height = p.get_height()
    if height > 0:
        # 막대의 중앙 x 위치와 y값(높이) 위에 값을 적음
        ax.annotate(f'{int(height)}',
                    (p.get_x() + p.get_width() / 2, height),
                    ha='center', va='bottom', fontsize=10, color='black')

plt.show()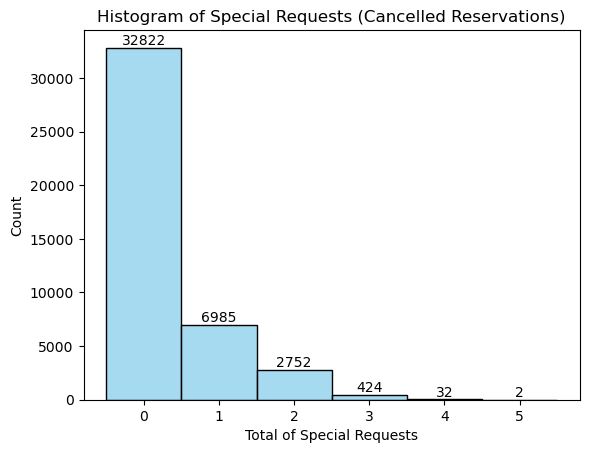
가설 3. 검증 결과 (2)
- 특별 요청 건수가 높을 수록 예약 취소 건수가 낮아짐을 확인할 수 있다.
- 단순히 건수만 비교하는 경우, 특수 요청이 없는 경우가 훨씬 높아 편향된 경향을 보일 수 있다.
*특수 요청 없는 경우: 70,318 건(58.9%) / 특수 요청 있는 경우: 49,072 건 (41.1%) - 따라서, 특수 요청 건수별 예약 취소 비율을 추가로 확인해본다.
# 각 특별 요청별 전체 예약 수
total_counts = hotel['total_of_special_requests'].value_counts().sort_index()

# 각 특별 요청별 취소 예약 수
cancel_counts = hotel[hotel['reservation_status'] == 'Canceled']['total_of_special_requests'].value_counts().sort_index()

# 0~5 범위 보장 (없는 값 0으로 채움)
index = np.arange(6)
total_vals = [total_counts.get(i, 0) for i in index]
cancel_vals = [cancel_counts.get(i, 0) for i in index]

# 취소되지 않은 예약 수 계산
not_cancel_vals = [total_vals[i] - cancel_vals[i] for i in range(len(index))]

# 각 점수별 취소 비율 계산
cancel_rates = [(cancel_vals[i] / total_vals[i] * 100) if total_vals[i] > 0 else 0 for i in range(len(index))]

fig, ax = plt.subplots(figsize=(10,6))

# 취소되지 않은 예약 (하단)
p1 = ax.bar(index, not_cancel_vals, color='lightgreen', label='Not Canceled')

# 취소된 예약 (상단)
p2 = ax.bar(index, cancel_vals, bottom=not_cancel_vals, color='salmon', label='Canceled')

ax.set_xlabel('Total of Special Requests')
ax.set_ylabel('Number of Reservations')
ax.set_title('Reservations by Special Requests (Canceled / Not Canceled)')
ax.set_xticks(index)
ax.legend()

# 막대 안에 % 표시 (취소 비율)
for i in range(len(index)):
    if cancel_vals[i] > 0:
        # 취소된 예약 막대 중앙에 텍스트 위치 지정
        xpos = p2[i].get_x() + p2[i].get_width() / 2
        ypos = p1[i].get_height() + p2[i].get_height() / 2
        ax.text(xpos, ypos, f'{cancel_rates[i]:.1f}%', ha='center', va='center', fontsize=10, color='black')

plt.show()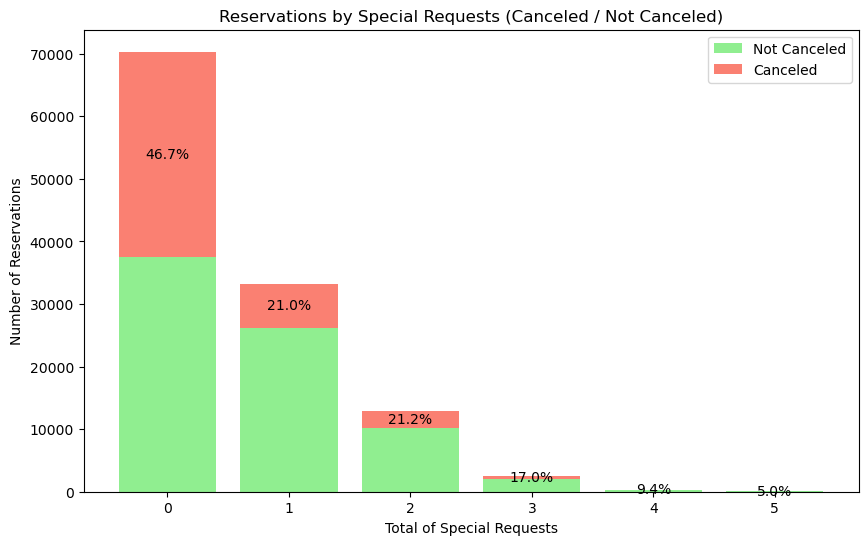
가설 3. 검증 결과 (3)
- 특별 요청 건수가 높을 수록 예약 취소 비율이 낮아짐을 확인할 수 있다.
- 가설 3을 지지하는 상관 관계를 확인할 수 있다.
가설 4. 고객이 요청한 주차 공간 수
- A. 고객이 요청한 주차 공간이 있는 경우
- B. 고객이 요청한 주차 공간이 없는 경우
- A보다 B의 취소 확률이 더 높을 것이다.
print(hotel['required_car_parking_spaces'].unique())
print(hotel['required_car_parking_spaces'].nunique())
[0 1 2 8 3]
5- A. 고객이 요청한 주차 공간이 있는 경우: 1, 2, 3, 8
- B. 고객이 요청한 주차 공간이 없는 경우: 0
- 주차 공간 옵션은 총 5가지의 선택지가 존재한다.
- 우선, A와 B로만 경우를 나누어 취소 상관 관계를 확인한다.
print(hotel['required_car_parking_spaces'].value_counts())required_car_parking_spaces
0 111974
1 7383
2 28
3 3
8 2
Name: count, dtype: int64- 주차 공간 요청 수에 따른 취소 확률 비교에서 0 값(주차 요청 없음)이 절대적으로 많아 단순 건수 비교 시 편향이 발생할 수 있다.
- 이를 보완하기 위해 A 그룹과 B 그룹의 각 총 예약 건수 대비 취소율을 알아본다.
*주차 공간 요청이 2 이상인 데이터 비율이 매우 낮으므로, A-B 그룹 비교만 진행하였다.(요청한 주차 공간 수 증가에 따른 상관 관계 분석 미진행)
# 'parking' 컬럼 생성
hotel['parking'] = hotel['required_car_parking_spaces'].apply(lambda x: False if x == 0 else True)

# 그룹별 취소율 계산
cancel_rates = hotel.groupby('parking')['reservation_status'].apply(lambda x: (x == 'Canceled').mean()).reset_index(name='cancel_rate')

# barplot 그리기
ax = sns.barplot(data=cancel_rates, x='parking', y='cancel_rate')

plt.title('Cancellation Rate by Parking Request')
plt.xlabel('Requested Parking Space')
plt.ylabel('Cancellation Rate')
plt.xticks([0, 1], ['No Parking Requested', 'Parking Requested'])

# 막대 위에 취소율 (%) 텍스트 표시
for p in ax.patches:
    height = p.get_height()
    ax.annotate(f'{height*100:.1f}%',
                (p.get_x() + p.get_width()/2, height),
                ha='center', va='bottom')

plt.show()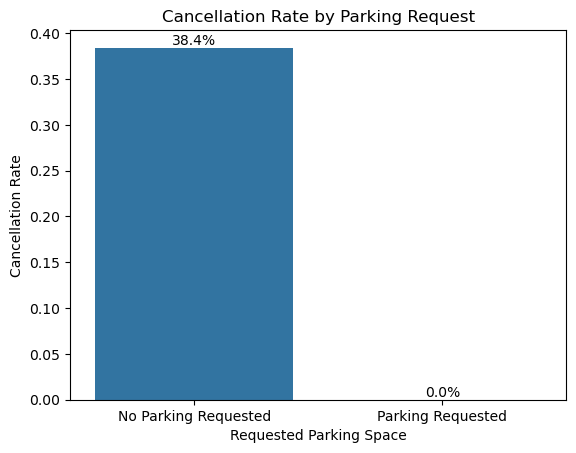
가설 4. 검증 결과
- 주차 공간을 요청하지 않은 고객(0개 요청)의 예약 취소 확률은 38.4%로 나타났다.
- 반면, 주차 공간을 1개 이상 요청한 고객의 예약에서는 취소된 사례가 한 건도 없어 취소 확률이 0%로 집계되었다.
- 주차 공간을 요청한 예약의 표본 수가 적긴 하지만, 해당 그룹 내 취소 사례가 완전히 없다는 점에서 부가 서비스(주차) 요청이 예약 확정 의사를 강화하는 경향이 있다고 해석할 수 있다.
*그룹별로 최종 상태를 재확인하여, 아래와 같이 차트 상에 오류가 없는지 재점검하였다.
parking_counts = hotel.groupby('parking')['reservation_status'].value_counts().unstack(fill_value=0)
print(parking_counts)
reservation_status Canceled Check-Out No-Show
parking
False 43017 67750 1207
True 0 7416 0가설 5. 리드 타임(호텔 예약 시점부터 고객의 호텔 도착 시점까지의 기간)
- 리드 타임이 길수록, 취소 확률이 더 낮을 것이다.
- 리드 타임에 따른 예약 취소 수의 분포를 비교한다.
*특이사항: 예약 보증금이 있었는지 유뮤를 확인할 수 없음.
print(hotel['lead_time'].nunique())
print(hotel['lead_time'].min(), hotel['lead_time'].max())
print(hotel['lead_time'].value_counts())
479
0 737
lead_time
0 6345
1 3460
2 2069
3 1816
4 1715
...
435 1
532 1
371 1
380 1
463 1
Name: count, Length: 479, dtype: int64- 호텔의 리드타임 고유값은 총 479개이므로, 리드타임을 일정 기간으로 범주화하여 취소 여부 분포를 확인하고자 한다.
- 다만, 예외값(이상치)이 많아 박스플롯을 확인하여 어느 정도의 기간으로 나누어 범주화할지 결정하고자 한다.
import matplotlib.pyplot as plt

plt.figure(figsize=(7,5))
plt.boxplot(hotel['lead_time'])
plt.title('Boxplot of Lead Time')
plt.ylabel('Lead Time')
plt.show()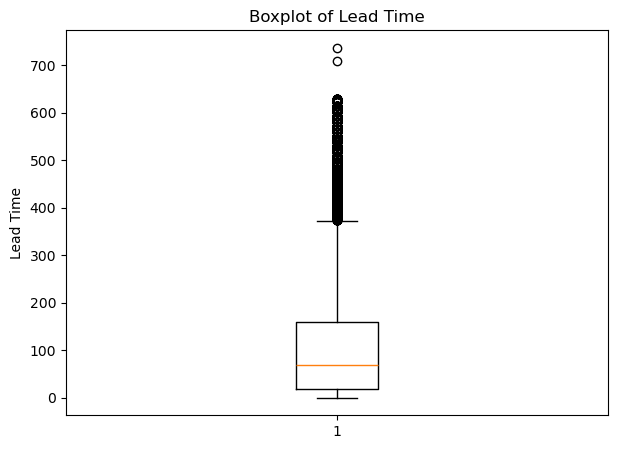
q1 = hotel['lead_time'].quantile(0.25)   # 1분위수 (Q1)
q2 = hotel['lead_time'].quantile(0.50)   # 2분위수 (Q2, 중앙값)
q3 = hotel['lead_time'].quantile(0.75)   # 3분위수 (Q3)
q4 = hotel['lead_time'].quantile(1.00)   # 4분위수 (Q4, 최댓값)
iqr = q3 - q1                            # IQR(Interquartile Range)

# 윗수염, 아랫수염 계산 (수염 기준: 1.5*IQR)
lower_whisker = hotel['lead_time'][hotel['lead_time'] >= (q1 - 1.5*iqr)].min()
upper_whisker = hotel['lead_time'][hotel['lead_time'] <= (q3 + 1.5*iqr)].max()

print(f"아랫수염: {lower_whisker}")
print(f"1분위수 (Q1): {q1}")
print(f"2분위수 (중앙값, Q2): {q2}")
print(f"3분위수 (Q3): {q3}")
print(f"윗수염: {upper_whisker}")
아랫수염: 0
1분위수 (Q1): 18.0
2분위수 (중앙값, Q2): 69.0
3분위수 (Q3): 160.0
윗수염: 373박스 플롯의 분위수에 따라 리드타임을 아래와 같이 범주화하였다.
-
0: 즉시 예약/당일 예약
-
1~18: Q1(1분위수)까지 - 단기 예약 (25% 이내)
-
19~69: Q1~Q2 - 약간 더 미리 예약한 군 (25~50%)
-
70~160: Q2~Q3 - 중장기 리드타임 군 (50~75%)
-
161~373: Q3~윗수염까지 - '정상' 범위 내 장기 예약 (75~100%)
-
373~: 이상치(Outlier) - 극단적으로 미리 예약한 경우
# 박스플롯 기준으로 리드타임 구간 정의
bins = [0, 0.99, 18, 69, 160, 373, hotel['lead_time'].max()]
labels = ['0', '1~18', '19~69', '70~160', '161~373', f'374~{int(hotel["lead_time"].max())}']

# lead_time 범주화
hotel['lead_time_cat'] = pd.cut(hotel['lead_time'], bins=bins, labels=labels, right=True, include_lowest=True)

# 범주별 취소 건수 집계
cancel_counts = hotel[hotel['reservation_status'] == 'Canceled']['lead_time_cat'].value_counts().sort_index()

print(cancel_counts)
lead_time_cat
0 317
1~18 3609
19~69 10310
70~160 12338
161~373 14440
374~737 2003
Name: count, dtype: int64plt.figure(figsize=(8,5))
bars = plt.bar(cancel_counts.index.astype(str), cancel_counts.values, color='tomato')
plt.xlabel('Lead Time Category')
plt.ylabel('Canceled Reservations')
plt.title('Canceled Reservations by Lead Time Category')
# 막대 위에 건수 표시
for bar in bars:
height = bar.get_height()
plt.text(bar.get_x() + bar.get_width()/2, height, f'{int(height)}',
ha='center', va='bottom', fontsize=10, color='black')
plt.show()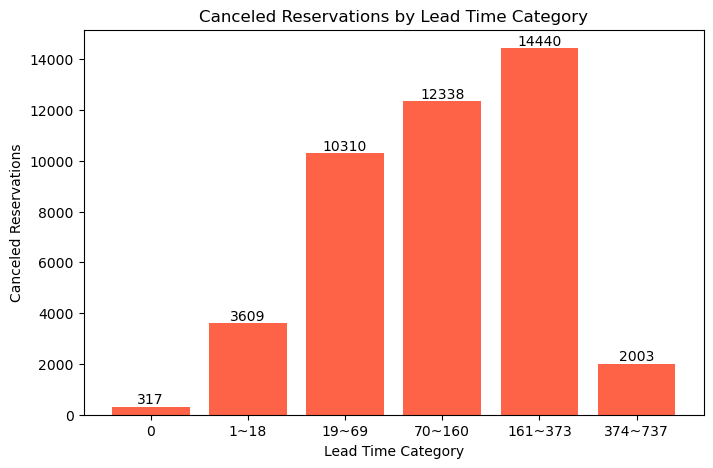
가설 5. 검증 결과 (1)
- 정상 범위(0일~373일) 내에서는 리드타임이 길수록 취소 건수가 많아짐을 확인하였다.
- 이는 가설과는 반대 되는 분석 결과이다. (가설에서는 변수 간 음의 상관 관계를 나타낼 것이라 예측하였으나, 실제로는 양의 상관 관계를 나타내고 있다.)
- 각 범주별 건수가 아닌 비율로도 확인하고자 한다.
# 전체 예약 건수 대비 범주별 건수 집계
total_counts = hotel['lead_time_cat'].value_counts().sort_index()

# 범주별 취소 건수 집계 (이전 코드)
cancel_counts = hotel[hotel['reservation_status'] == 'Canceled']['lead_time_cat'].value_counts().sort_index()

# 취소 비율 계산
cancel_ratio = (cancel_counts / total_counts).fillna(0) * 100  # % 비율로 변환

plt.figure(figsize=(8,5))
bars = plt.bar(cancel_ratio.index.astype(str), cancel_ratio.values, color='tomato')
plt.xlabel('Lead Time Category')
plt.ylabel('Cancellation Rate (%)')
plt.title('Cancellation Rate by Lead Time Category')

# 막대 위에 비율 표시
for bar in bars:
    height = bar.get_height()
    plt.text(bar.get_x() + bar.get_width()/2, height, f'{height:.1f}%',
             ha='center', va='bottom', fontsize=10, color='black')

plt.show()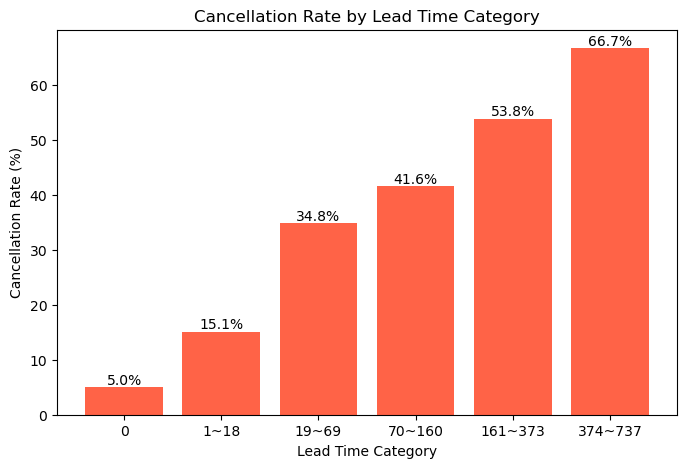
가설 5. 검증 결과 (2)
- 리드타임(예약~체크인까지 기간)이 길수록 예약 취소율이 현저하게 증가하는 경향을 보인다.
- 특히 373일 이상(극단값 범주)에서는 취소율이 66.7%로 가장 높게 나타났다.
- 단기(0~18일) 예약은 취소율이 15.1% 이하로 매우 낮으며, 이 구간은 상대적으로 예약 의사가 확고한 고객이 많을 것으로 보인다.
- 중·장기(19~373일) 리드타임 구간에서도 취소율은 지속적으로 상승하여, 사전에 미리 예약한 고객일수록 취소 위험이 더 큼을 알 수 있다.
- 이 결과는 기존 가설(리드타임이 짧으면 취소 확률이 높다)과 달리, 리드타임이 길수록 취소 위험이 높아지는 점이 데이터로 명확하게 확인된다.
가설 6. 이전 방문 여부
- 이전에 방문한 적 있는 고객일 수록, 취소 확률이 더 낮을 것이다.
- A. 재방문 고객인 경우 (1)
- B. 이전에 방문한 적 없는 고객인 경우 (0)
- A보다 B의 취소 확률이 더 높을 것이다.
hotel['is_repeated_guest'].value_counts()is_repeated_guest
0 115580
1 3810
Name: count, dtype: int64- 그룹 A는 96.8%, 그룹 B는 3.2% 절대 수치에서 많은 차이를 보인다. (취소 건수로 비교하는 것은 무리가 있다.)
- 따라서 각 그룹의 취소 및 노쇼에 대한 비율을 비교 분석하였다.
# 취소 혹은 노쇼 상태만 필터링
filtered = hotel[hotel['reservation_status'].isin(['Canceled', 'No-Show'])]

# 그룹별 건수 집계
count_data = filtered.groupby(['is_repeated_guest', 'reservation_status']).size().reset_index(name='count')

# 전체 예약 건수 집계 (비율 계산용)
total_by_group = hotel.groupby('is_repeated_guest').size()
count_data['percent'] = count_data.apply(lambda x: x['count']/total_by_group[x['is_repeated_guest']] * 100, axis=1)

# 막대 그래프 (비율 기준, hue로 취소/노쇼)
ax = sns.barplot(data=count_data, x='is_repeated_guest', y='percent', hue='reservation_status')

plt.title('Cancel & No-Show Ratio by Repeated Guest')
plt.xlabel('Repeated Guest')
plt.ylabel('Percentage (%)')
plt.xticks([0, 1], ['Not Repeated', 'Repeated'])
plt.legend(title='Reservation Status')

# 막대 위에 비율(00%) 표시
for bars in ax.containers:
    for bar in bars:
        height = bar.get_height()
        ax.text(bar.get_x() + bar.get_width()/2, height, f'{height:.1f}%', ha='center', va='bottom', fontsize=10, color='black')

plt.show()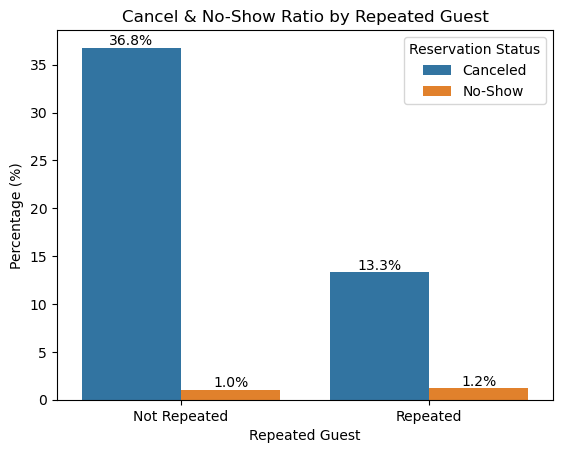
가설 6. 검증 결과
- 재방문이 아닌 고객의 취소율은 약 36.8%로, 재방문 고객의 13.3%보다 현저히 높다.
- 노쇼 비율은 두 그룹 모두 낮지만, 재방문 고객에서 약간 더 높은 약 1.2%로 나타났다.
- 전반적으로 재방문 고객은 비재방문 고객 대비 취소·노쇼 위험이 더 낮아, 고객 충성도가 예약 이행에 긍정적으로 작용함을 시사한다.
7. 결론: 고객의 예약 취소율을 낮추기 위한 지침
데이터 분석 결과
- 위의 데이터 분석에 의하면, 가설은 각각 아래와 같이 검증되었다.
- 외국인 예약객의 경우, 내국인 예약객보다 취소 확률이 더 낮았다.
- 고객이 원하는 객실 유형에 대한 가설은 결측치가 없어 검증에서 제외하였다.
- 특별 요청 건수가 많을수록, 특별 요청이 없는 경우보다 취소 확률이 더 낮았다.
- 고객이 주차 공간을 요청한 경우, 요청하지 않은 경우보다 취소 확률이 더 낮았다.
- 리드타임이 길수록, 리드타임이 짧은 경우보다 취소 확률이 더 높았다.
- 재방문 고객의 경우, 재방문 경험이 없는 고객보다 취소 및 노쇼 확률이 더 낮았다.
호텔 관리인 예약 취소 리스크 관리 지침
- 데이터 분석 결과에 따라, 호텔 관리인은 아래와 같은 경우 예약 취소 리스크에 대비해야 한다.
- 내국인 고객의 경우, 해외 고객보다 취소 가능성이 높으므로 예약확정 리마인드를 추가 발송하는 전략이 필요하다.
- 특별 요청이나 부가 서비스(주차 등) 요청이 없는 고객을 대상으로 이탈 방지 프로모션을 고려할 수 있다.
- 장기 리드타임(사전 예약) 고객일수록 실제 취소 가능성이 높아지므로, 취소 정책 강화 및 중간 리마인드 메시지 발송 등 사전 대응 방안이 요구된다.
- 신규(재방문 이력 없는) 고객은 예약 취소에서 높은 위험성을 보이므로 유인책(특별 혜택, 보증금 제도 등) 도입을 검토할 필요가 있다.
추가 사항: 보완할 내용
- 호텔 관리인의 입장에서는 Resort Hotel과 City Hotel 각각의 운영 특성과 고객층이 다르기 때문에, 이에 따른 세부적인 전략 및 관리 지침이 필요할 것이다.
- 다만 이번 실습에서는 두 호텔 유형을 구분하지 않고 통합된 데이터로 가설 설정 및 검증을 진행하였다.
- 따라서 이를 보완하기 위해서는 호텔 유형별로 세분화된 EDA 및 예측 모델링을 수행하여, 각 호텔의 예약 패턴·취소 요인·고객 특성 차이를 구체적으로 파악하는 것이 필요하다.
결론
이번 분석을 통해 단순히 데이터의 통계적 특성을 파악하는 데 그치지 않고, 실제 호텔 운영 전략과 연결할 수 있는 분석적 사고를 기를 수 있었다.
EDA를 통해 고객의 예약 취소에 영향을 주는 주요 요인을 탐색하면서, 데이터 기반으로 문제를 정의하고 개선 방향을 도출하는 과정의 중요성을 다시 한 번 느낄 수 있었다.
다음에는 이번 EDA 경험을 바탕으로, 소규모 표본 데이터셋을 활용해 비즈니스에 영향을 주는 요인을 예측하는 모델을 만들어보고자 한다.
이를 통해 단순한 데이터 탐색을 넘어, 데이터 기반 의사결정으로 확장되는 분석 과정을 경험해볼 계획이다.