
Pandas
- 판다스는 파이썬에서 데이터 처리를 위해 존재하는 가장 인기 있는 라이브러리이다
- 판다스는 행과 열로 이뤄진 2차원 데이터를 효율적으로 가공/처리할 수 있는 다양하고 훌륭한 기능을
DataFrame
- 판다스의 핵심 객체
Index, Series
- Index는 개별 데이터를 고유하게 식별하는 Key값이다
- Series와 DataFrame은 모두 Index를 key값으로 가지고 있다
- Series와 DataFrame의 가장 큰 차이는 Series는 칼럼이 하나뿐인 데이터 구조체이고, DataFrame은 칼럼이 여러 개인 데이터 구조체다
Start Pandas
import pandas as pd
판다스를 pd로 에일리어스해 임포트 하는것이 관례이다
read_csv()
-
read_csv() 와 read_table()의 차이는 필드구분문자가 콤마냐 탭이냐의 차이이다
-
read_csv()는 csv뿐만 아니라 어떤 필드 구분문자 기반의 파일도 DataFrame으로 변환이 가능하다
-
read_csv()함수에서 가장 중요한 인자는 filepath이다 filepathㅇ에 로드하려는 데이터 파일의 경로를 포함한 파일명을 입력한다
titanic_df = pd.read_csv('titanic_train.csv')
print('titanic 변수 type:', type(titanic_df))
titanic_df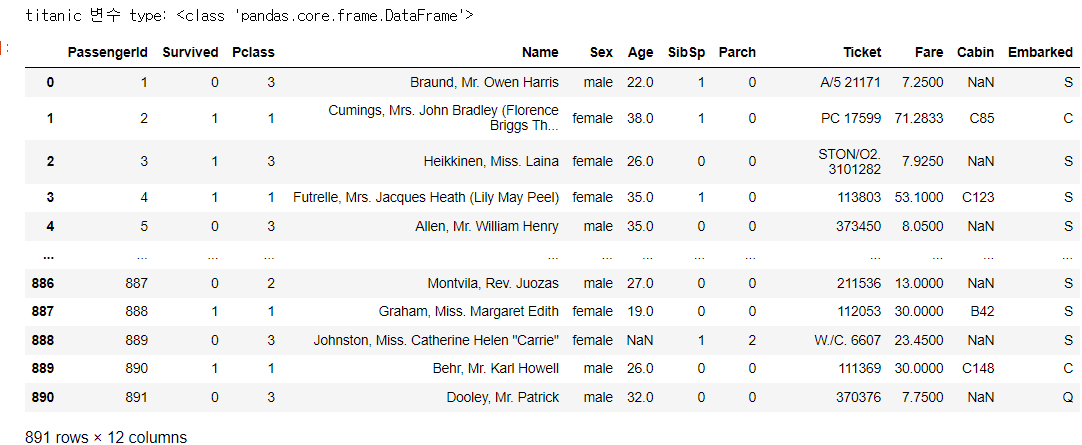
head()
- head()함수는 DataFrame의 맨 앞에 있는 N개의 로우를 반환한다
(디폴트는 5이다)
titanic_df.head(3)
(3개의 로우만 반환)
shape
- shape변수를 통해 DataFrame의 행과 열의 크기를 알아볼 수 있다
행과 열을 튜플 형태로 반환한다
print('DataFrame의 크기: ', titanic_df.shape)
ouput: (891, 12)
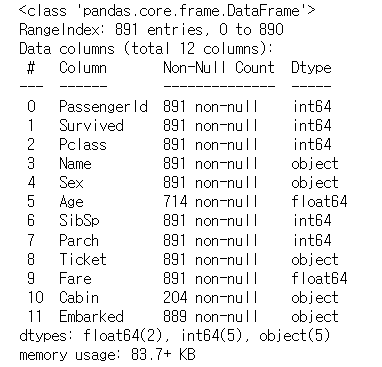
info()
- 총 데이터 건수와 데이터 타입, Null 건수를 알 수 있다
titanic_df.info()
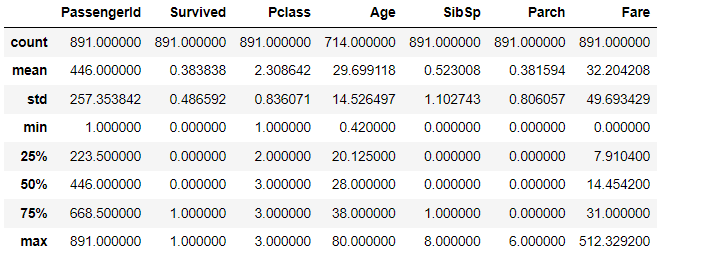
describe()
- describe()메소드는 칼럼별 숫자형 데이터값의 n-percentile분포도, 평균값, 최댓값, 최솟값을 나타낸다
- describe()메소드는 숫자형 칼럼의 분포도만 조사한다(object타입은 제외)
titanic_df.describe()
value_counts()
- value_counts()메소드를 호출하면 해당 칼럼값의 유형과 건수를 확인할 수 있다
value_counts = titanic_df['Pclass'].value_counts()
print(type(value_counts))
print(value_counts)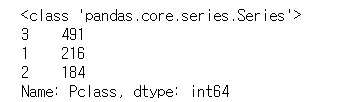
- value_counts()메소드는 Null 값을 무시하고 결과값을 내놓음에 주의
- value_counts(dropna=False)와 값이 dropna 인자값을 False로 입력해주면 Null값을 포함하여 적용한다
DataFrame 상호변환
- DataFrame은 파이썬의 리스트, 딕셔너리 넘파이 ndarray로 상호 변환할 수 있다
넘파이 ndarray, 리스트를 DataFrame으로 변환
import numpy as np

col_name1 = ['col1']
list1 = [1, 2, 3]
array1 = np.array(list1)
print('array1 shape:', array1.shape)
# 리스트를 이용해 DataFrame 생성
df_list1 = pd.DataFrame(list1, columns=col_name1)
print('1차원 리스트로 만든 DataFrame:\n', df_list1)
# 넘파이 ndarray를 이용해 DataFrame 생성
df_array1 = pd.DataFrame(array1, columns=col_name1)
print('1차원 ndarray로 만든 DataFrame:\n', df_array1)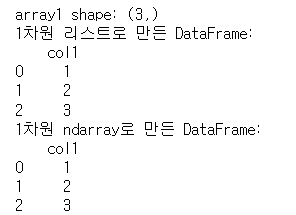
딕셔너리를 DataFrame으로 변환
dict = {'col1':[1,11], 'col2':[2,22], 'col3':[3,33]}
df_dict = pd.DataFrame(dict)
print('딕셔너리로 만든 DataFrame:\n', df_dict)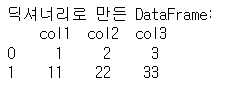
DataFrame을 ndarray, 리스트, 딕셔너리로 변환
# DataFrame을 ndarray로 변환
array3 = df_dict.values
print('df_dict.values 타입:', type(array3), 'df_dict.values shape:', array3.shape)
print(array3)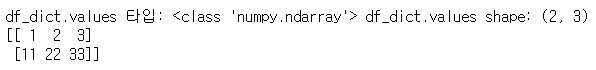
# DataFrame을 리스트로 변환
list3 = df_dict.values.tolist()
print('df_dict.values.tolist() 타입:', type(list3))
print(list3)

# DataFrame을 딕셔너리로 변환
dict3 = df_dict.to_dict('list')
print('\n df_dict.to_dict() 타입:', type(dict3))
print(dict3)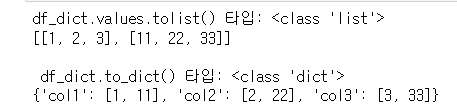
DataFrame의 칼럼 데이터 세트 생성, 수정
- DataFrame의 칼럼 데이터 세트 생성과 수정은 [ ] 연산자를 이용해 쉽게 할 수 있다
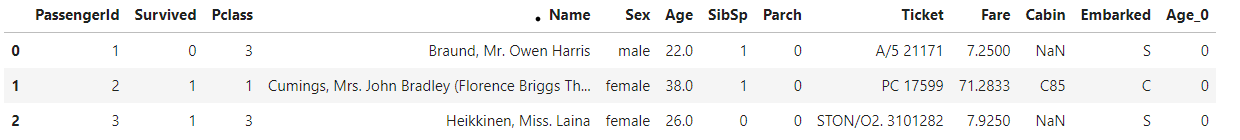
titanic_df['Age_0']=0
위의 코드로 Titanic DataFrame 의 새로운 칼럼 Age_0을 추가하고 일괄적으로 0 값을 할당한 것이다
titanic_df['Age_by_10'] = titanic_df['Age']*10
titanic_df['Family_No'] = titanic_df['SibSp'] + titanic_df['Parch']+1
위의 코드는 기존 칼럼 Series를 가공해 새로운 칼럼 Age_by_10과 Family_No를 추가한것이다

DataFrame 데이터 삭제
- 데이터의 삭제는 drop() 메소드를 사용한다
- drop() 메소드중 중요한 파라미터는 labels, axis, inplace이다
- axis 값에 따라 특정 칼럼 또는 행을 드롭한다
- labels에 원하는 칼럼명을 입력한다
- inplace=False이면 자기 자신의 DataFrame의 데이터는 삭제하지 않고 삭제한 결과 DataFrame을 반환한다
inplace=True로 설정하면 반환 값이 없고 자기 자신의 DataFrame의 데이터를 삭제한다
drop_result = titanic_df.drop(['Age_0', 'Age_by_10', 'Family_No'], axis = 1, inplace = True)
print(' inplace=True 로 drop 후 반환된 값:', drop_result)
titanic_df.head(3)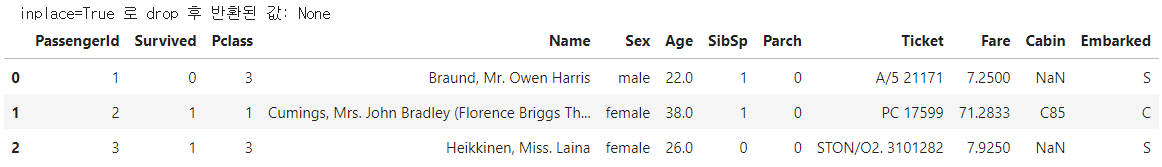
- axis = 0으로 로우삭제
pd.set_option('display.width', 1000)
pd.set_option('display.max_colwidth', 15)
print('#### before axis 0 drop ####')
print(titanic_df.head(3))

titanic_df.drop([0, 1, 2], axis=0, inplace=True)

print('#### after axis 0 drop ####')
print(titanic_df.head(3))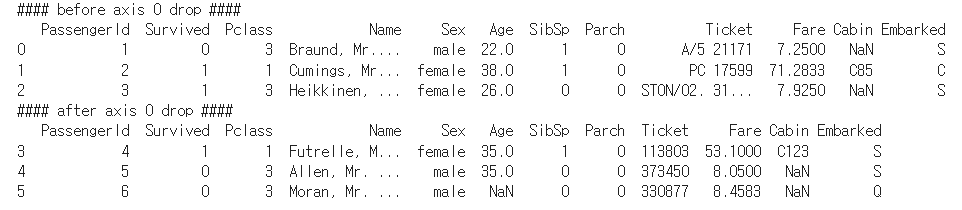
0, 1, 2 인덱스가 삭제된 모습
Reference 권철민, 파이썬 머신러닝 완벽 가이드, 위키북스2020
.jpg)