
시리즈 데이터와 내용이 이어집니다.
DataFrame
- 여러 개의 Series가 모여서 행과 열을 이룬 데이터
import pandas as pd

gdp_dict = {
'china': 1409250000,
'japan': 516700000,
'korea': 169320000,
'usa': 2041280000,
}
gdp = pd.Series(gdp_dict)

country = pd.DataFrame({
'gdp': gdp,
'population': population          # population 값은 이전 내용 참고
})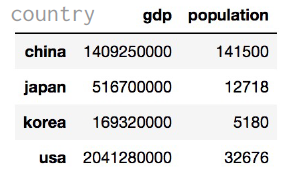
- Dictionary를 활용하여 DataFrame 생성 가능
import pandas as pd

data = {
'country': ['china', 'japan', 'korea', 'usa'],
'gdp': [1409250000, 516700000, 169320000, 2041280000],
'population': [141500, 12718, 5180, 32676]
}
country = pd.DataFrame(data)
country = country.set_index('country') # `contry`를 인덱스로 사용하겠다-
딕셔너리, 시리즈, 데이터프레임 정리!

① 딕셔너리:
data = {key:value}② 시리즈: 딕셔너리에서 인덱스가 따로 생긴 것!
series([1, 2, 3, 4])③ 데이터 프레임: 앞에는 인덱스가 들어가고 뒤는 시리즈 데이터가 들어감.
④ 1에서 3번으로 바로 가는 것도 가능함. 딕셔너리에서 시리즈를 거치지 않고 바로 데이터 프레임으로 넘어가는 것 가능!
속성
- 데이터 프레임이 어떻게 구성되어 있는지 확인해보자.
...
print(country.shape)  # (4, 2) | index와 column을 뺀 값이 들어감.
print(country.size)   # 8
print(country.ndim)   # 2
print(country.values) # [[1409250000 141500]
                      # [ 516700000 12718]
                      # [ 169320000 5180]
                      # [2041280000 32676]]
index와 column에 이름 지정
- DataFrame의 index와 column에 이름지정
...
country.index.name = "Country" # 인덱스에 이름 지정
country.columns.name = "Info" # 컬럼에 이름 지정

print(country.index)
# Index(['china', 'japan', 'korea', 'usa'], dtype='object', name='Country’)

print(country.columns)
# Index(['gdp', 'population'], dtype='object', name='Info')
저장 & 로드
- 데이터 프레임 저장 및 불러오기 가능
...
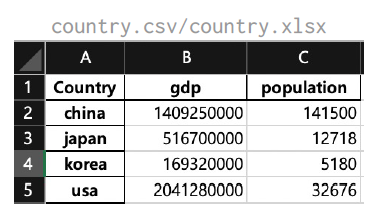
country.to_csv("./country.csv")
country.to_excel("country.xlsx")
country = pd.read_csv("./country.csv")
country = pd.read_excel("country.xlsx")위 코드를 입력하면 저장 및 불러오기 기능을 사용할 수 있다.
저장할 때엔 아래와 같은 형태로 저장된다.
[실습 2] 데이터 프레임
문제
-
여러 개의 시리즈 데이터를 이용하여 데이터 프레임을 만드는 법을 익혀보자.
- 국가별 인구를 나타내는 시리즈 데이터인
population과 국가별 GDP를 나타내는 시리즈 데이터인gdp가 있습니다.
두 시리즈 데이터로country라는 데이터 프레임을 만드세요. 반드시 population, gdp의 순서로 만들어주셔야 합니다.
- 완성한 데이터 프레임을 출력해보세요!
code
- 국가별 인구를 나타내는 시리즈 데이터인
import numpy as np
import pandas as pd

# 두 개의 시리즈 데이터가 있습니다.
print("Population series data:")
population_dict = {
    'korea': 5180,
    'japan': 12718,
    'china': 141500,
    'usa': 32676
}
population = pd.Series(population_dict)
print(population, "\n")

print("GDP series data:")
gdp_dict = {
    'korea': 169320000,
    'japan': 516700000,
    'china': 1409250000,
    'usa': 2041280000,
}
gdp = pd.Series(gdp_dict)
print(gdp, "\n")


# 이곳에서 2개의 시리즈 값이 들어간 데이터프레임을 생성합니다.
print("Country DataFrame")
country = pd.DataFrame({'population':population, 'gdp':gdp})
print(country, "\n")

print(country.index)
print(country.columns)
실행 결과
Population series data:
korea      5180
japan     12718
china    141500
usa       32676
dtype: int64

GDP series data:
korea     169320000
japan     516700000
china    1409250000
usa      2041280000
dtype: int64

Country DataFrame
population         gdp
korea        5180   169320000
japan       12718   516700000
china      141500  1409250000
usa         32676  2041280000

Index(['korea', 'japan', 'china', 'usa'], dtype='object')
Index(['population', 'gdp'], dtype='object')
개발자로 시작| 공부한 것을 기록합니다.