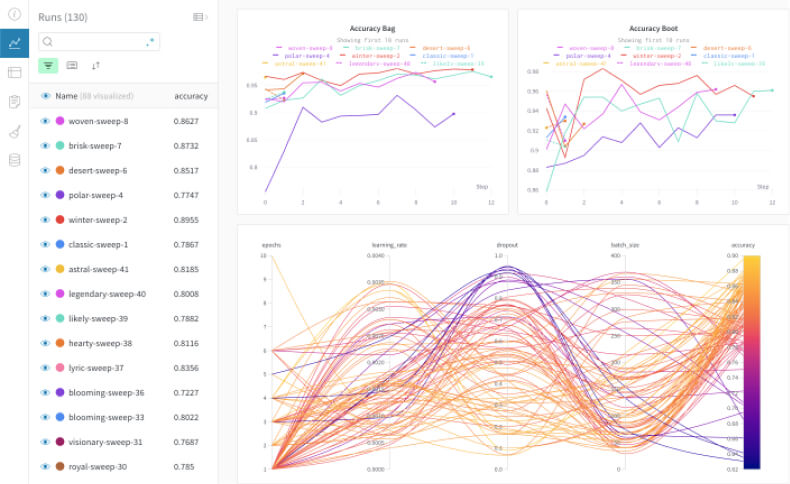
Pytorch wandb (Weight & Biases) 적용
딥러닝 모델을 학습하다가 보면 Loss나 필요한 Metric, 평가지표들을 그래프로 시각화해서 보는 방법이 필요하다. 많이 사용하는 방법으로는 텐서보드나 파이썬에서 제공하는 모듈들을 사용해 표현 하는 방법들이 있다.
최근에는 wandb를 이용해서 시각화를 많이 하며, 그동안 미뤄왔던 wandb를 기존 코드에 적용한다.
1. wandb(Weight & Bias)?
wandb는 머신 러닝 개발자들의 모델개발을 돕는 플랫폼이다. 모델을 학습하는데 있어서 모델 실험, 통합, 하이퍼파라미터 튜닝, 데이터 및 모델 버저닝, 데이터 시각화 등을 돕는다.

위 여러가지 기능에서 일반적으로 데이터 시각화에 많이 사용한다.
가격 정책
wandb는 basic, standard, advanced 3가지 정책으로 나눠지며, 개인의 경우 무제한에 100GB의 저장공간을 지원해준다.
2. 설치 및 로그인
사용하기 위해서는 먼저 Weight & Biases에 회원가입이 되어있어야 한다.
2.1. 설치
pip3 install wandb2.2. 로그인
아래 명령 입력후 API Key 입력
wandb login3. Pytorch wandb 적용
파이토치의 경우 아래와 같이 적용하며, 각 도구, 프레임워크 별로 적용하는 방법이 Weight & Biases에서 제공 된다.
3.1. 초기화
wandb.init()은 시스템 메트릭과 콘솔 로그들을 추적한다.
import wandb

wandb.init(project="[프로젝트명]", entity="[계정명]")
3.2. 로깅
3.2.1. 기본 사용법
wandb.log()는 메트릭을 추적한다. 일반적으로는 아래와 같이 dictionary 구조로 로깅을 할수 있다.
wandb.log({'accuracy': train_acc, 'loss': train_loss})로깅에는 위와 같이 스칼라 값 뿐만 아니라, 이미지나 히스토그램, 비디오 다른 미디어들도 로깅할 수 있다. 자세한 내용은 wandb.log() 문서 참고.

3.2.2. 중첩 딕셔너리 구조
train과 evaluation 시에 로깅을 분리하고자 하는 경우 아래와 같이 중첩 딕셔너리 구조를 사용해 로깅 세션을 분리해서 사용할 수 있다.
wandb.log({"train": {"acc": 0.9}, "val": {"acc": 0.8}})위와같이 사용하는 경우 train과 val 섹션으로 나누어져서 wandb UI에서 구분되어 사용할 수 있다.
3.2.3. 여러 포맷의 로깅
기본
import wandb
wandb.init()
wandb.log({'accuracy': 0.9, 'epoch': 5})
Incremental logging
import wandb
wandb.init()
wandb.log({'loss': 0.2}, commit=False)
# Somewhere else when I'm ready to report this step:
wandb.log({'accuracy': 0.8})
히스토그램
import numpy as np
import wandb

# sample gradients at random from normal distribution
gradients = np.random.randn(100, 100)
wandb.init()
wandb.log({"gradients": wandb.Histogram(gradients)})
numpy 이미지
import numpy as np
import wandb

wandb.init()
examples = []
for i in range(3):
    pixels = np.random.randint(low=0, high=256, size=(100, 100, 3))
    image = wandb.Image(pixels, caption=f"random field {i}")
    examples.append(image)
wandb.log({"examples": examples})
PIL 이미지
import numpy as np
from PIL import Image as PILImage
import wandb

wandb.init()
examples = []
for i in range(3):
    pixels = np.random.randint(low=0, high=256, size=(100, 100, 3), dtype=np.uint8)
    pil_image = PILImage.fromarray(pixels, mode="RGB")
    image = wandb.Image(pil_image, caption=f"random field {i}")
    examples.append(image)
wandb.log({"examples": examples})
numpy 비디오
import numpy as np
import wandb

wandb.init()
# axes are (time, channel, height, width)
frames = np.random.randint(low=0, high=256, size=(10, 3, 100, 100), dtype=np.uint8)
wandb.log({"video": wandb.Video(frames, fps=4)})
Matplotlib plot
from matplotlib import pyplot as plt
import numpy as np
import wandb

wandb.init()
fig, ax = plt.subplots()
x = np.linspace(0, 10)
y = x * x
ax.plot(x, y)  # plot y = x^2
wandb.log({"chart": fig})
PR Curve
wandb.log({'pr': wandb.plots.precision_recall(y_test, y_probas, labels)})3D Object
wandb.log({"generated_samples":
[wandb.Object3D(open("sample.obj")),
    wandb.Object3D(open("sample.gltf")),
    wandb.Object3D(open("sample.glb"))]})
