# In[1]
import matplotlib.pyplot as plt
plt.style.use('seaborn-whitegrid')

%matplotlib inline
import numpy as np- Plot legends give meaning to a visualization, assigning meaning to the various plot elements.
- The simplest legend can be created with the
plt.legendcommand, which automatically creates a legend for any labeled plot elements.
# In[2]
x=np.linspace(0,10,1000)
fig,ax=plt.subplots()
ax.plot(x,np.sin(x),'-b',label='Sine')
ax.plot(x,np.cos(x),'--r',label='Cosine')
ax.axis('equal')
leg=ax.legend()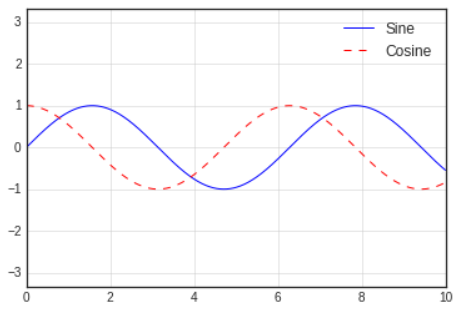
- There are many ways we might want to customize such a lengend.
- We can specify the location and turn on the frame.
# In[3]
ax.legend(loc='upper left',frameon=True)
fig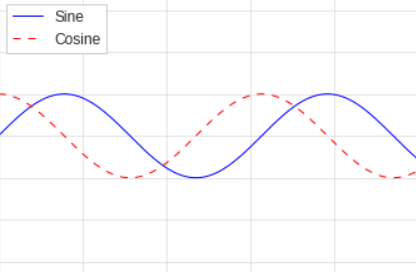
- We can use the
ncolcommand to specify the number of columns in the legend.
# In[4]
ax.legend(loc='lower center',ncol=2)
fig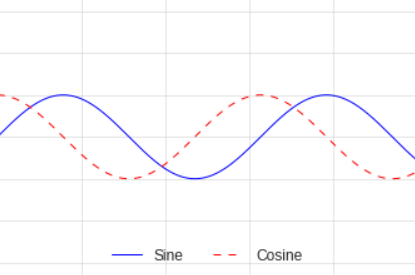
- And we can use a rounded box(fancybox) or add a shadow, change the transparency(alpha value) of the frame, or change the padding around the text
# In[5]
ax.legend(frameon=True,fancybox=True,framealpha=1,
shadow=True,borderpad=1)
fig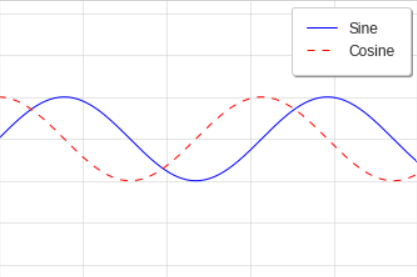
For more information on available legend options, refer to this url :
plt.legend documentation
Choosing Elements for the Legend
- By default the legend includes all labeled elements from the plot.
- If this is not what is desired, we can fine-tune which elements and labels appear in the legend by using the objects returned by
plotcommands. plt.plotis able to create multiple lines at once, and returns a list of created line instances.- Passing any of these to
plt.legendwill tell it which to identify, along with the labels we'd like to specify.
# In[6]
y=np.sin(x[:,np.newaxis] + np.pi * np.arange(0,2,0.5))
lines=plt.plot(x,y)

# lines is a list of plt.Line2D instances
plt.legend(lines[:2],['first','second'],frameon=True);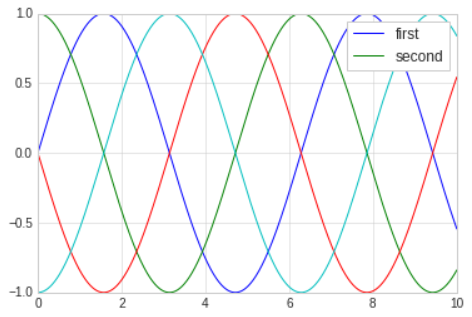
- The book says, it is clearer to use the first method, applying labels to the plot elements you'd like to show on the legend.
# In[7]
plt.plot(x,y[:,0],label='first')
plt.plot(x,y[:,1],label='second')
plt.plot(x,y[:,2:])
plt.legend(frameon=True);- The legend ignores all elements without a
labelattribute set.
Legend for Size of Points
- Sometimes the legend defaults are not sufficient for the given visualization.
- For example, you're using the size of points to mark certain features of the data, and want to create a legend reflecting this.
- The legend will always reference some object that is on the plot, so if we'd like to display a particular shape we need to plot it.
- For example, the objects we want are not on the plot, we can fake them by plotting empty lists.
- Recall that the legend only lists plot elements that have a label specified.
- By plotting empty lists, we can create labeled plot objects that are picked up by the legend, and our legend will tell us some useful information.
- This strategy can be useful for creating more sophisticated visualizations.
Multiple Legends
- Sometimes when designing a plot you'd like to add multiple legends to the same axes.
- Matplotlib does not make this easy: via the standard
legendinterface, it is only possible to create a single legend for the entire plot. - If you try to create a second legend using
plt.legendorax.legend, it will simply override the first one. - We can work around this by creating a new legend artist (
Artistis the base class Matplotlib uses for visual attributes) from scratch, and then using the lower-levelax.add_artistmethod to manually add the second artist to the plot.
# In[8]
fig,ax=plt.subplots()

lines=[]
styles=['-','--','-.',':']
x=np.linspace(0,10,1000)

for i in range(4):
    lines += ax.plot(x,np.sin(x - i * np.pi / 2),styles[i],color='black')
ax.axis('equal')

# specify the lines and labels of the first legend
ax.legend(lines[:2],['line A','line B'],loc='upper right')

# create the second legend and add the artist manually
from matplotlib.legend import Legend
leg=Legend(ax,lines[:2],['line C','line D'],loc='lower right')
ax.add_artist(leg);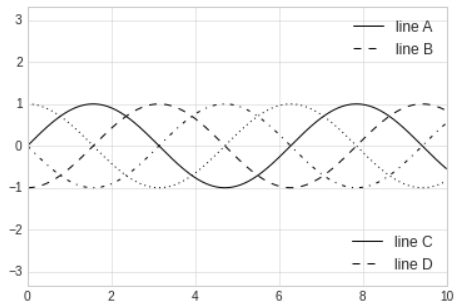
- This is a peek into the low-level artist objects that comprise any Matplotlib plot.
- If you examine the source code of
ax.legend, you'll see that the function simply consists of some logic to create a suitableLegendartist, which is then saved in thelegend_attribute and added to the figure when the plot is drawn.
For more information about plt.subplots(), refer to these urls :
1. plt.subplots() documentation
2. About subplots() in Matplotlib
3. Difference between subplot() and subplots()

노정훈