데이터마이닝과 직접적으로 연관은 없는 챕터지만, r programming에 대한 설명을 간단히 하겠다.
->r programming에 대해 잘 알고 있다면, 이 챕터는 넘겨도 될 것!
data analysis에 관한 c언어에는 2가지가 있다
->R or Python
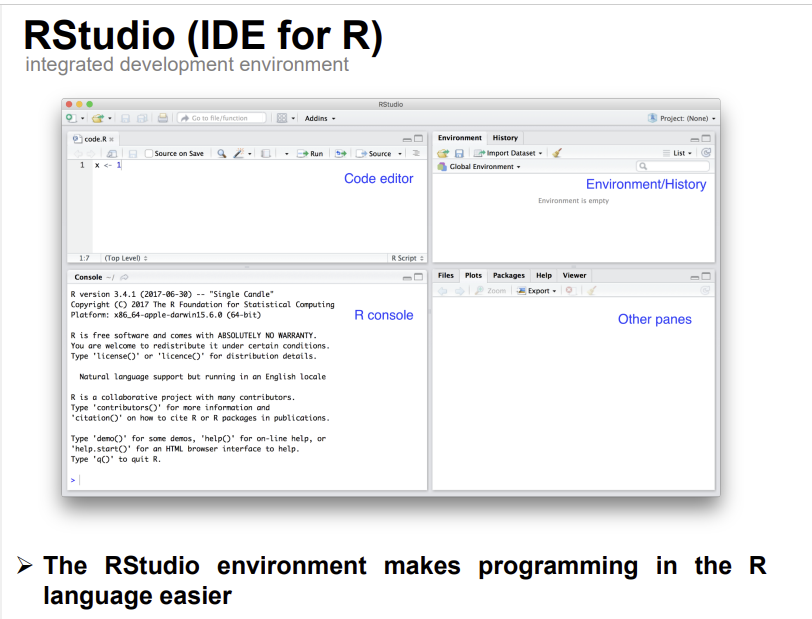
cf.) IDE
Integrated Development Environment(통합 개발 환경)
->a software application that provides comprehensive(포괄적인) facilities to computer programmers for software development.
->An IDE normally consists of at least 'a source code editor','build automation tools',and a 'debugger'(디버깅: 컴퓨터 프로그램이나 시스템에서 발생하는 오류를 찾고 수정하는 과정).
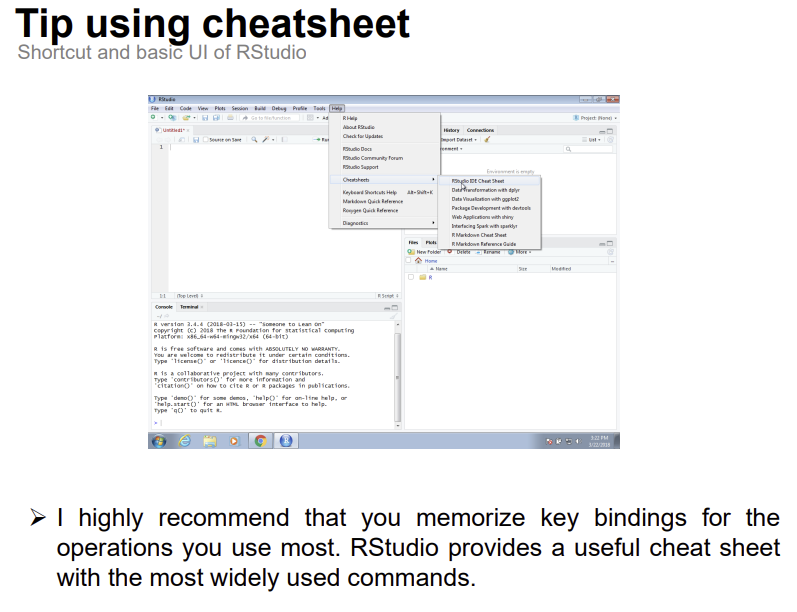
cf.)Tip using cheatsheet(cheatsheet: 프로그래밍이나 기술 분야에서 사용되는 용어,명령어,함수 등의 짧은 요약된 정보를 담은 문서)
Basic user prompt guide
Commands are entered interactively at the R user prompt.(prompt가 코드를 입력하는 곳이라고 생각하면 된다.)
Up and down arrow keys scroll through your command history.But, sometimes, don't recommend that programming directly in the prompt window.
->i.e.)Imagine if you programmed it with the 100,000 lines in the prompt. -> If, blackout event is suddenly visited?
->In this situation, we could write codes in memo, or some places where we can record.
R workspace
*getwd(): You can check current working directory.
*setwd(Dir): You can change working directory(코드를 저장하는 폴더 경로라고 생각하면 된다.) to Dir. Dir is path of targeted directory.(Warning: "\" is escape character. You should write "\" not "\".)You have two options for saving your work.
-> 1. Save your R script. -> When you save only your code in text format.
-> 2. Save your R workspace using 'save.image()' function. -> When you want to save a workspace you put in RAM based on your code.
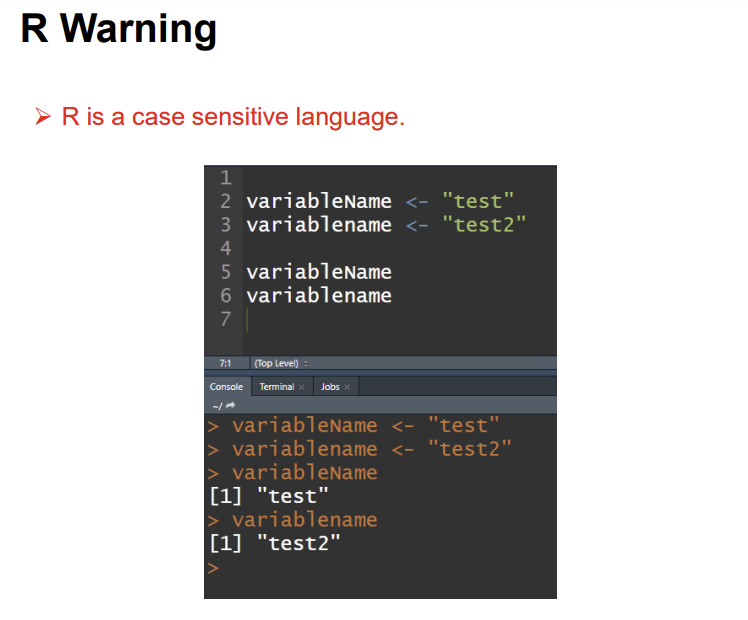
R Warning
R is a case sensitive language.
Basic Programming guide
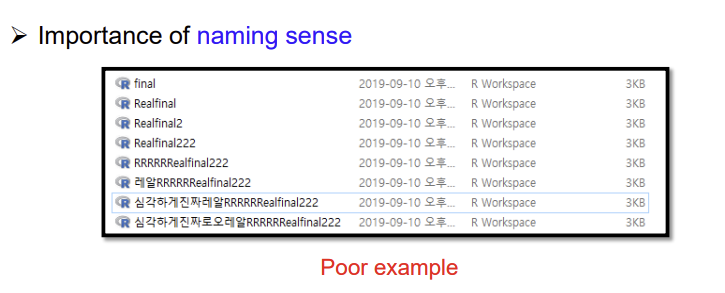
Programmers should have habits that saving always and making backup.
One of the best ways is to save every time a script.
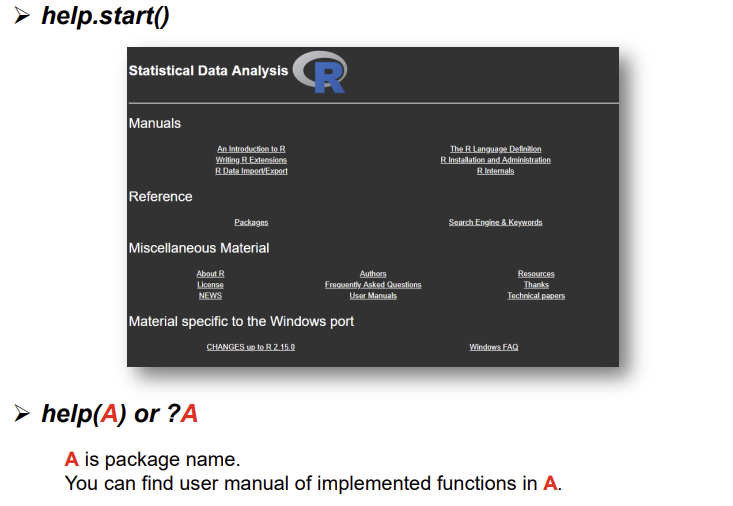
help & help.start() function
If you want to check role of specific function, you can find user manually easily.
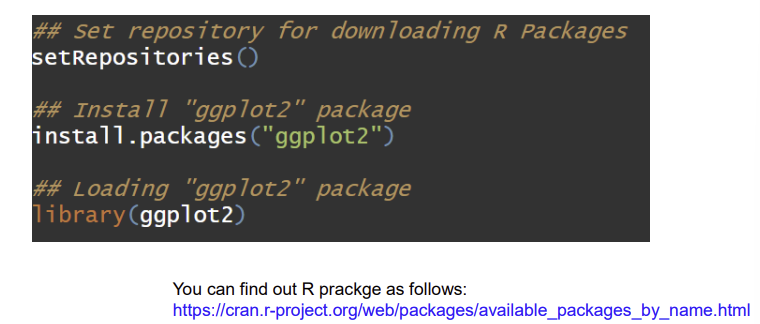
R Packages
*One of the strengths of R is that the system can easily be extended.
*The system allows you to write new functions and packages those functions in a so called 'R package(or 'R library')'.
*To find out R package, setting repository is first step.
->We often set repositories like 'setRepositories(ind=1:7)', which means we use all of 7 mirror sites provided in R studio.
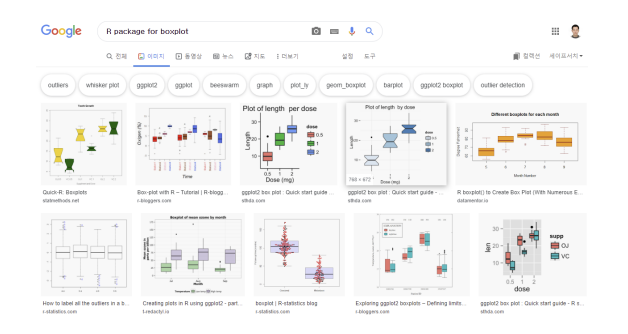
One tip to find out R Package
*You can find boxplot related packages by using Google search.
*You can also consider your style by searching for images.
Data Types in R
*Vector
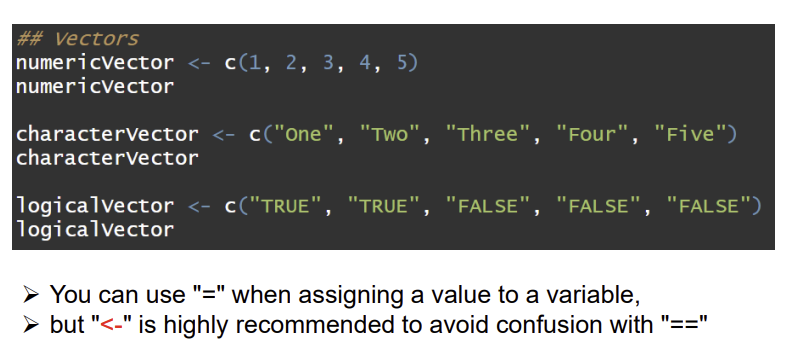
Data Types
Up to now, the variables we have defined are just one number.This is not very useful for storing data.
The most common way of storing a dataset is in R is in a data frame.
Conceptually, we can think of a data frame as a table with rows representing observations and the different variables reported for each observation defining the columns.
->개념적으로, 우리는 데이터프레임을 하나의 테이블(표 형식)로 볼 수 있는데, 이 테이블은 가로(행)가 관측대상들(객체들)을 나타내고, 세로(열)가 각각의 관측대상에서 모아진 다양한 변수들로 볼 수 있다.Data frames are particularly useful for datasets because we can combine different data types into one project.
->데이터프레임은 데이터셋들에 매우 유용히 사용될 수 있는데, 이 이유는 하나의 프로젝트에 다른 데이터 타입들을 결합시킬 수 있기 때문이다.
-> 이 말을 간단히 말하자면, 데이터프레임의 열에 해당하는 각각 다른 변수들은 서로 다른 데이터 타입을 가질 수 있다.
Data Types(2)
*Data(Dataset name)
->Loads specified data sets, or list the available data sets.*Is()
->Checking list of loaded data.*class()
->Checking data types.*str()
->This is useful for finding out more about the structure of an object.
Data Types(3)
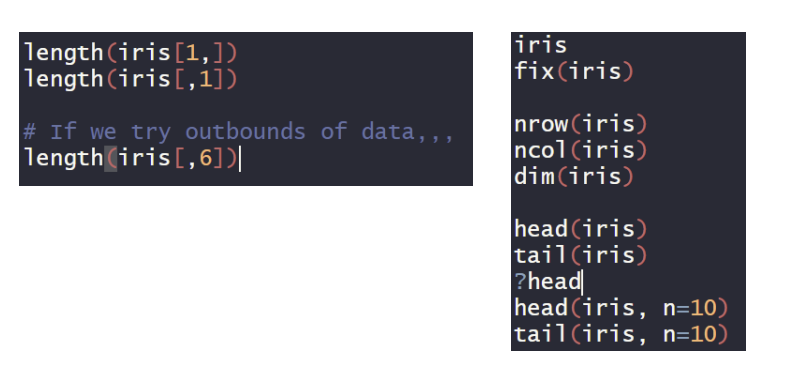
*Length(Variable Name)
->In case of 1-dimension variable, you can get a #(number,갯수) of elements(values).
※iris는 R 프로그래밍 언어에서 제공하는 내장 데이터셋 중 하나로, 붗꽃(iris)의 꽃잎과 꽃받침의 길이와 너비 등을 측정한 데이터이다.
※iris[1,]의 의미는 iris 데이터셋에서 첫번째 행을 추출한 것이다. length(iris[1,])는 이 첫번째 행에 대한 길이를 나타낸 것이다.
※마찬가지로, iris[,1]은 첫번째 열을 추출한 것이다.
※fix(iris)를 하면 iris 데이터셋에서 수정을 할 수가 있다.
->cf.) 데이터셋 vs 데이터프레임
->데이터프레임은 그냥 r프로그래밍에서 사용되는 자료구조 중 하나로, 행과 열로 이루어진 이차원 배열의 데이터 구조이고, 데이터셋은 하나 이상의 관련된 테이블들의 모음을 의미한다. 데이터프레임도 하나 이상의 관련된 테이블들의 모임으로 볼 수 있으나, 일반적으로 데이터프레임은 하나의 파일로 저장되고, 데이터셋은 대규모 데이터를 다루고, 여러 파일로 분산되어 저장되거나, 데이터베이스로부터 불러와서 사용된다.※nrow(iris),ncol(iris)
->iris의 행의 개수와 열의 개수를 출력해준다.※dim(iris)
->iris의 차원에 대한 정보를 알려준다. 즉, 행의 개수와 열의 개수를 모두 출력해준다.※head(iris),tail(iris)
->head는 iris의 앞에서 1~6번째 행에 대한 정보를, tail은 뒤에서 1~6번째 행에 대한 정보를 알려준다.※?head
->? 키워드는 ? 다음의 해당 키워드에 대한 설명을 띄어준다. 설명은 'Other panes->Help'에서 볼 수 있다.※head(iris, n=10),tail(iris, n=10)
->그냥 head랑 tail을 쓰면 기본적으로 6개만 출력해주는데, n의 값에 따라 그 갯수만큼 행에 대한 정보를 출력해준다. 여기서는 10개의 정보를 출력해준다.
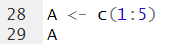
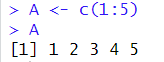
Quiz to help you understand
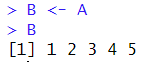
*Please generate A variable with 1,2,3,4,5 values
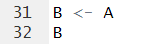
cf.) c(1:5)의 의미는 1~5까지를 'c'ombine 한다는 의미이다. 연속적인 값들은 다음과 같이 ':'기호를 사용해서 간편히 사용할 수 있다.*Copy Variable A to create variable B
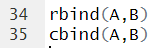
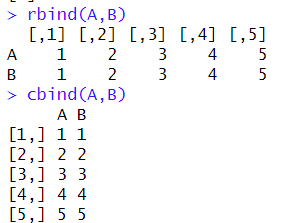
*Let's binding column-wise or row-wise directions between A and B variable using cbind() and rbind() functions, respectively
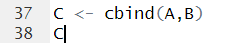
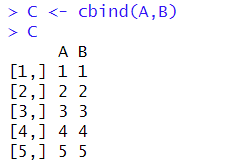
*Combine A and B column by column and assign them to variable C
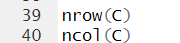
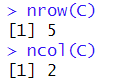
cf.) column by column = column-wise*Let's check # of columns and rows of C variable
cf.) nrow(),ncol() = number of row, number of column
Data Types
Difference between data.frame and data.matrix
*Data frame has column names and row names.
*Data frame let you treat some features as factor.
->데이터프레임에서 열에 '범주형(categorical)' 데이터가 포함되어 있으면, 이러한 데이터를 R에서는 '팩터(factor)'라고 부른다.
->ex) 어떤 데이터셋에 성별(gender)라는 열이 있다고 가정해보자. 이 열에는 male(남성)과 female(여성)으로 두 개의 범주형 데이터로 분류되고, 이들을 팩터로 지정하면, male과 female을 각각 1과 2의 수치로 대응시켜 데이터를 분석한다.
->즉, 팩터(factor)는 문자열 데이터를 수치값으로 매핑하는 것이다. 일부 R함수는 팩터로 변환된 범주형 데이터를 더 쉽게 처리할 수 있다.*You can do a lot of work with data frame: fit stat formulas,processing data and, what you actually not possible with matrix: you need to convert matrix to data frame to begin to work with it.
->fit stat formulas: 통계 모델에서 모델이 데이터에 잘 적합되는지를 측정하기 위한 통계량들
->즉, matrix에서 못하는 것들을 data.frame으로 형태를 바꿔서, 데이터 수정 작업(전처리 과정,데이터 클렌징)이나 모델링(모델링은 추후에 설명,머신러닝과 관련되어 있다고 일단 지금은 이렇게 생각하기) 등을 할 수 있다.
->matrix는 모든 원소가 같은 자료형을 가지는 이차원 배열이고, data.frame은 똑같이 이차원 배열이기는 하나, 각각의 변수가 서로 다른 자료형을 가질 수 있어서, 데이터 전처리 과정에서 유용하게 쓰인다.*You can also transpose data frame but it will be converting data frame where row names become column names, which is a very useful in data science.
->transpose: 전치시키다. 즉, 행과 열을 서로 바꾸는 것이다. 이렇게 하는 이유는 나중에 유용하게 쓰이는 부분이 있어서 그렇다. 이 부분은 추후 실습에서 알아보도록 하자.
->전치(transpose)하는 이유 중 일반적인 이유는 데이터 분석에서 변수와 관측치(즉, 행과 열)의 개념을 다룰 때 편리하게 하기 위해서이다.
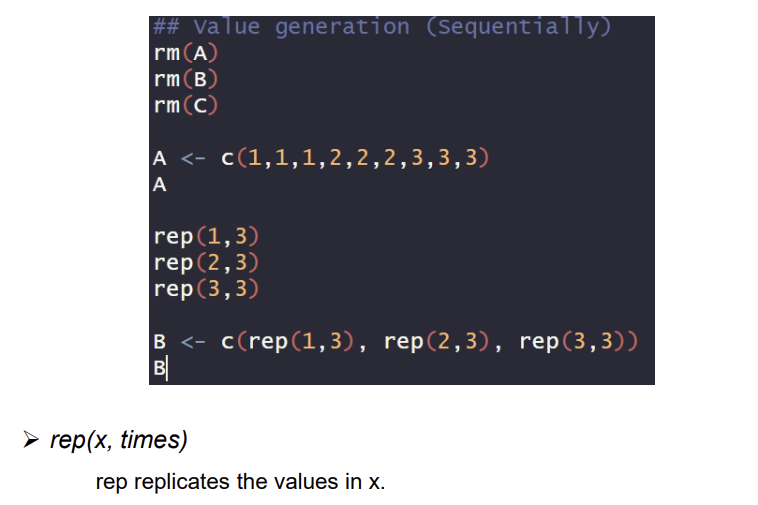
Generating values
Generating numeric and categorial values
cf.) rm(A)= remove(A). 기존의 A variable을 제거하는 것이다.
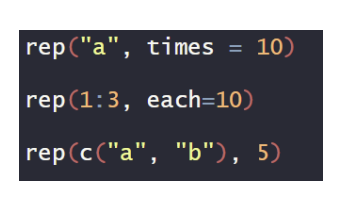
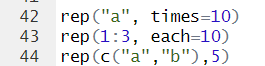
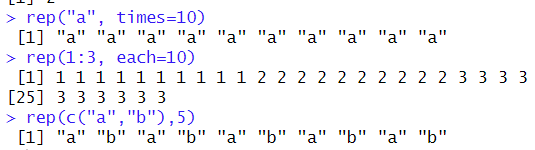
Generating values(2)
Generating numeirc and categorical values
tip.)보면 알겠지만, r코드 해석은 단순하고 직관적인 편이다. 모든(대부분) c언어 코드가 그렇 듯, 영어단어와 매치해서 코드를 이해하면 이해하기 쉬워진다.
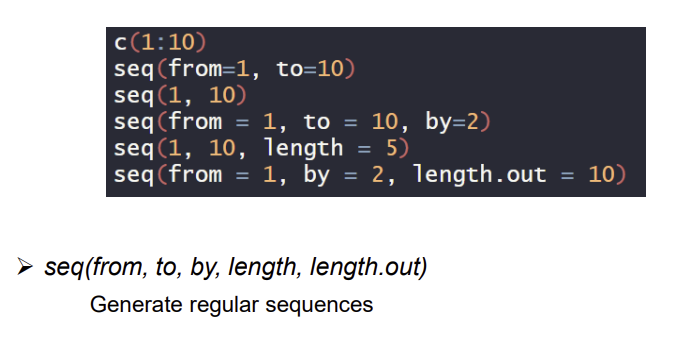
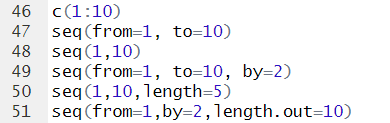
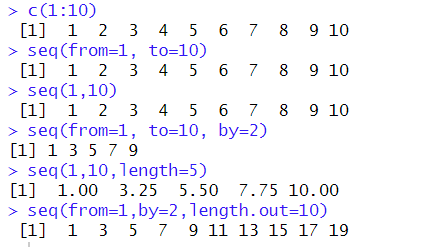
Generating Values(3)
Generating numeirc and categorical values
cf.)seq=sequential(연속적인,순서적인). seq(1,10,length=5)는 1부터 10까지 5개를 일정한 간격으로 출력한 것을 볼 수 있고, seq(from=1,by=2,length.out=10)은 1부터 2만큼 간격으로 10개를 출력한 것을 볼 수 있다.
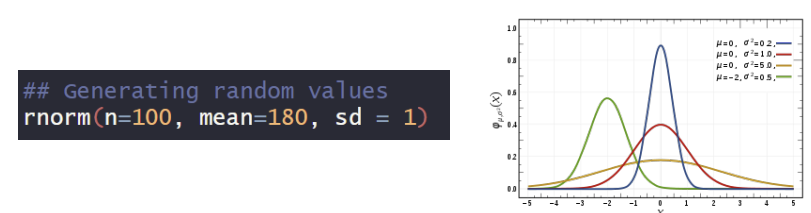
Generating values(4)
Generating random numeric values from the Normal Distribution(정규분포)
*rnorm(value,mean,sd): Generate random variables from normal distribution.
->rnorm: random normal distribution.
->n은 개수, mean은 평균, sd는 표준편차이다.
*In probability theory, the normal(or Gaussian or Gauss or Laplace-Gauss) distribution is a very common continuous probability distribution.
*Normal distribution are important in statistics to represent real-valued random variables whose distributions are not known.
->즉, 실제 난수 데이터에 대해 분포에 대한 정보가 없을 때, 정규분포가 중요하게 쓰인다라는 말임.*A random variable with a Gaussian distribution is said to be normally distributed and is called a normal deviate(일탈하다,벗어나다,편차,오차).
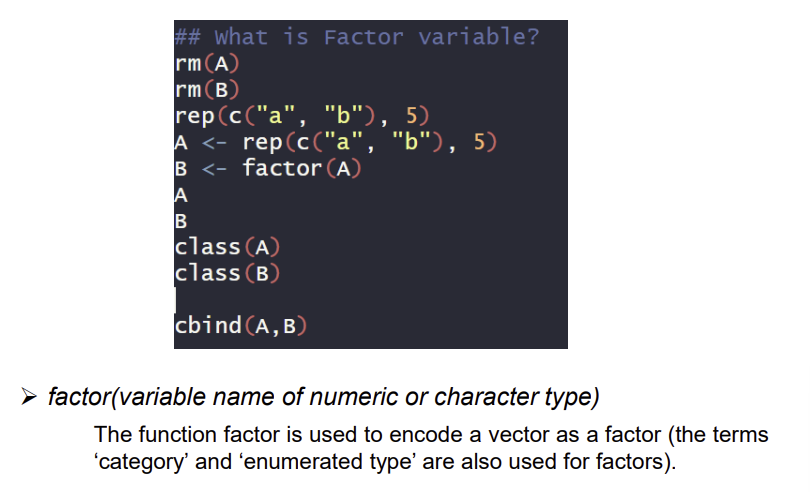
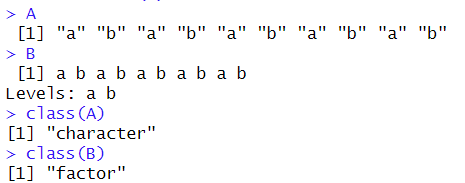
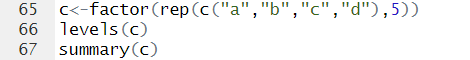
Generating values(5)
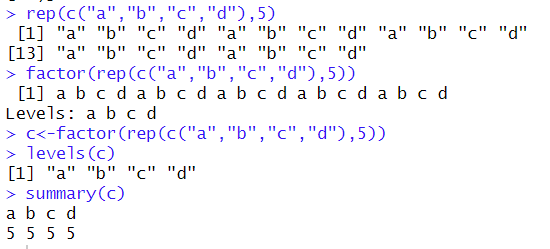
factors
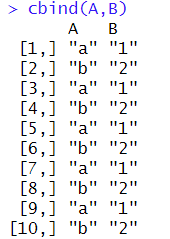
cf.) variable A는 클래스를 보면 'character' 형식임을, variable B는 클래스를 보면 'factor' 형식임을 알 수 있다. 그래서, A는 "a","b" 이런 식으로 character 형식으로 결합된 것을 알 수 있고, B는 그냥 a,b이런식으로 factor 형식으로 결합된 것을 알 수 있다. 또한 A,B를 cbind()하면 A는 문자 그대로 출력되지만, B는 factor로서 숫자가 출력됨을 알 수 있다.(앞에서 설명한 factor 설명 부분 참고)cf.)여기서 levels는 A와 B 두 단계(수준)으로 나눈다는 말이다. 이 level들은 문자열 또는 숫자형 값으로 지정될 수 있다.
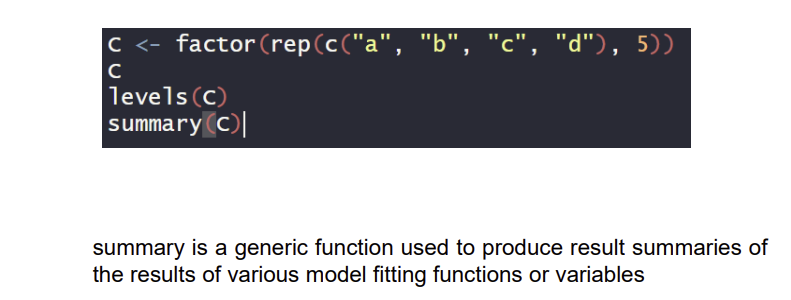
Generating values(6)
factors
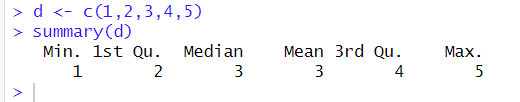
*If you use summary() for 'numeric' variable...
최솟값,첫번째 값,중간값,평균,세번째 값,최댓값에 대한 정보를 알 수 있다.
*If you use summary() for 'factor' variable....
factor에 대한 summary()는 위의 코드 참고
※Data.frame can consider factor variable, but not in data.matrix.

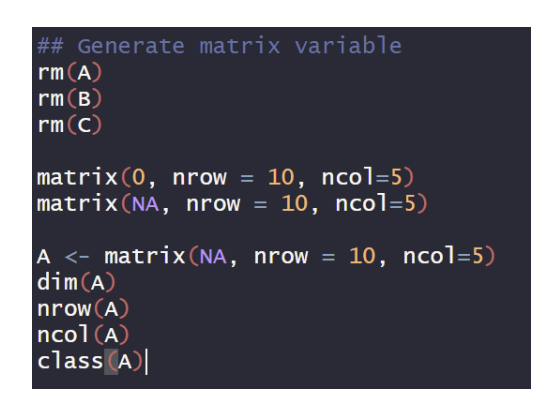
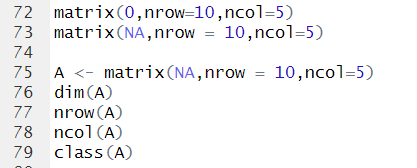
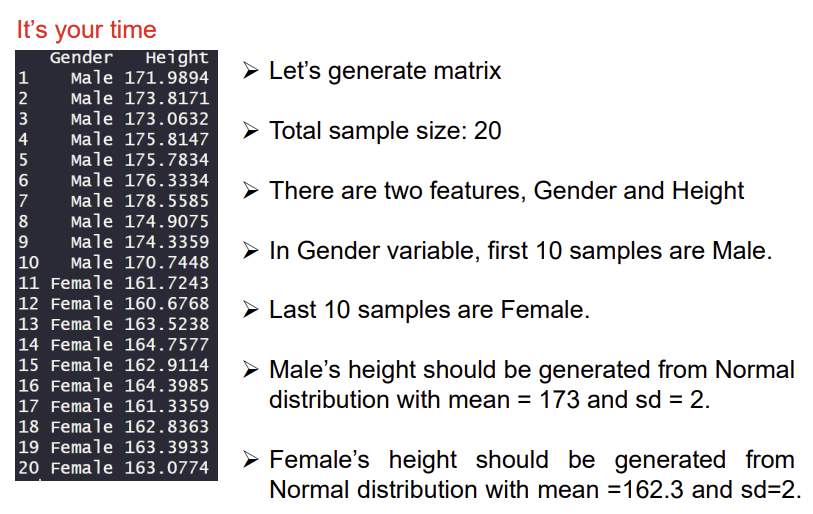
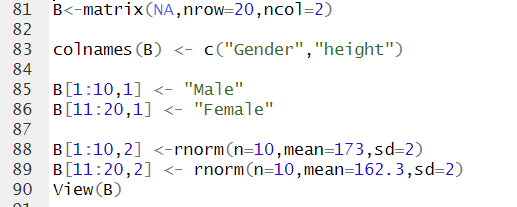
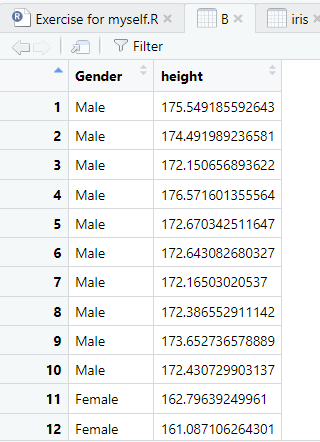
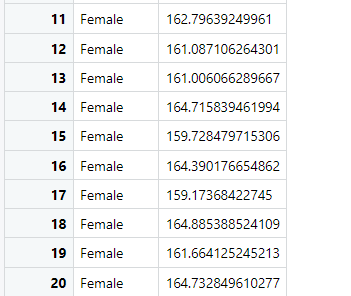
Make matrix variable
Generating data.matrix and data.frame
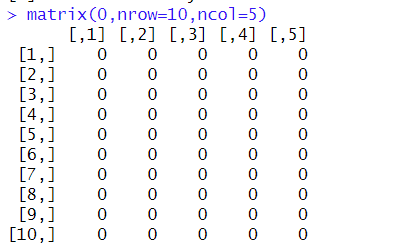
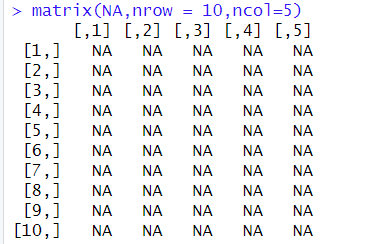
matrix(value,nrow,ncol,byrow)
-> matrix creates a matrix from the given set of values.
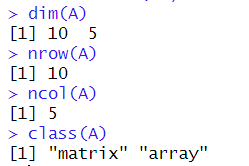
*dim(A): n by m matrix에서 n(행),m(열)에 대한 정보를 알려준다.
*class(A): A에 대한 클래스 정보를 알려준다. matrix와 array임을 알 수 있다.
Quiz to help you understand
*과정 설명: 먼저 모든 값들이 NA인 20 by 2 matrix를 생성한다. colnames()함수는 말 그대로 열의 이름을 붙여주는 함수이다. B[1:10,1]은 1열의 1~10번까지의 행을 Male로 바꾸라는 코드이다. 즉, B[]의 첫번째가 행을, 두번째가 열을 의미한다. 마찬가지로 B[,2]에 rnorm(정규분포)수식을 대입하면, 10개의 랜덤한 값들이 조건에 맞춰서 생성된다.
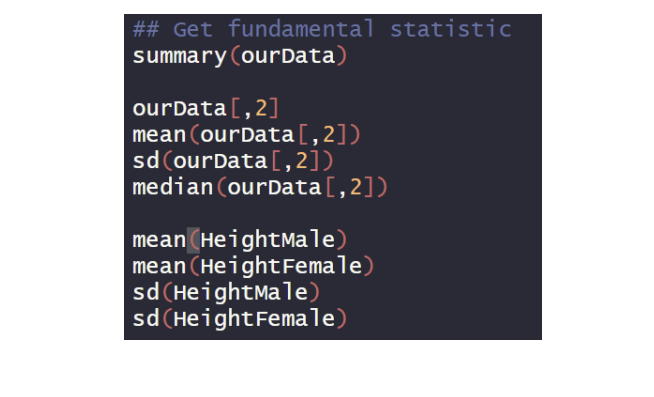
Get Descriptive Statistics
Fundamental Statistic
앞에서 배운 내용들이다. mean은 평균을, sd는 표준편차를, median은 중앙값을 의미한다.
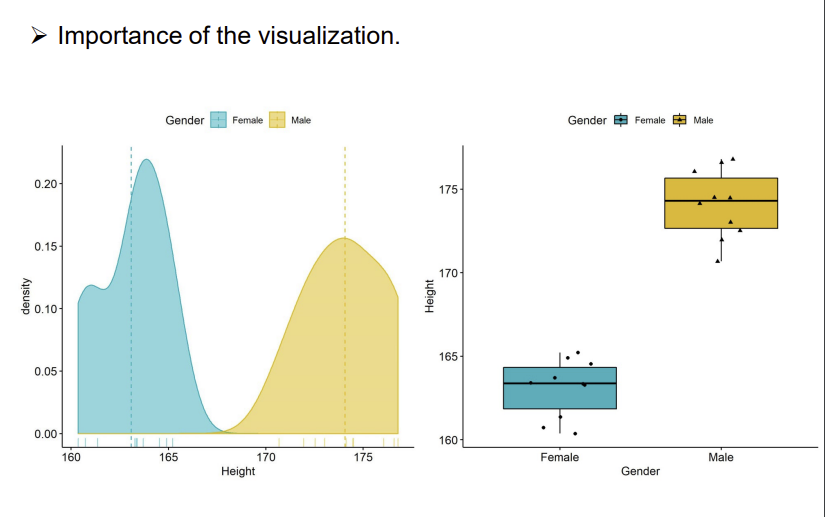
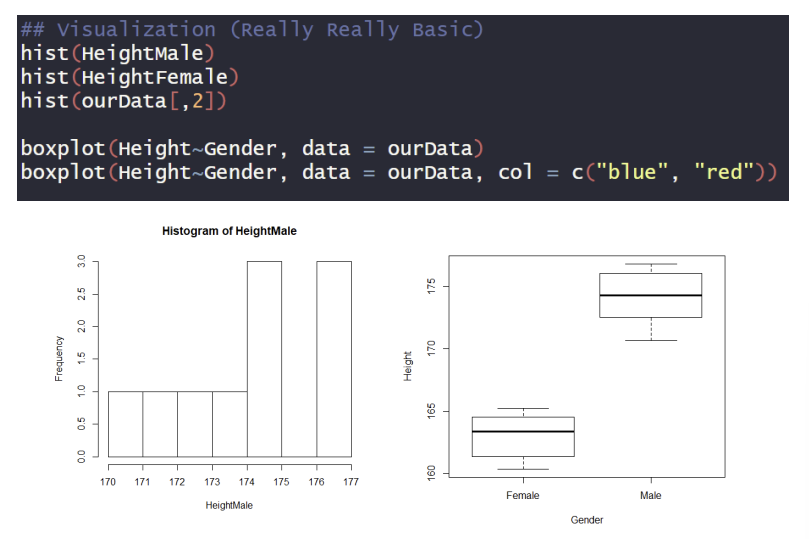
Visualization
Based on the basic function of R
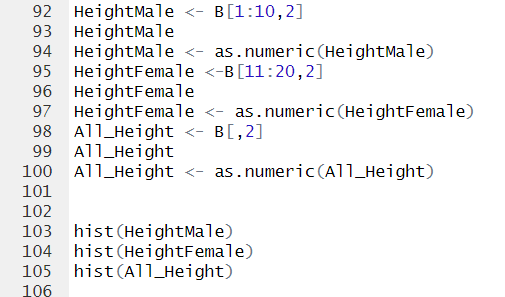
cf.) 왜인지는 모르겠지만, B[,2] 이것을 as.numeric으로 바꾸면 오류가 생긴다.
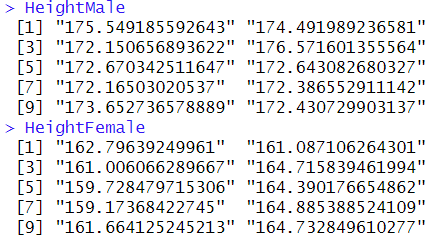
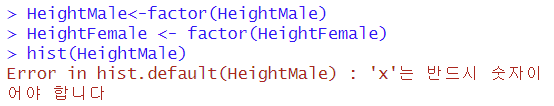
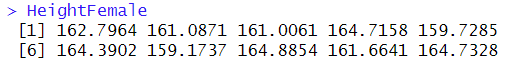
코드 설명: HeightMale이라는 변수에 B[1:10,2]에 대한 정보를 담는다. HeightFemale도 마찬가지이다. 하지만, HeightMale과 HeightFemale을 살펴보면, 이 값들은 문자형이라는 것을 알 수 있다.
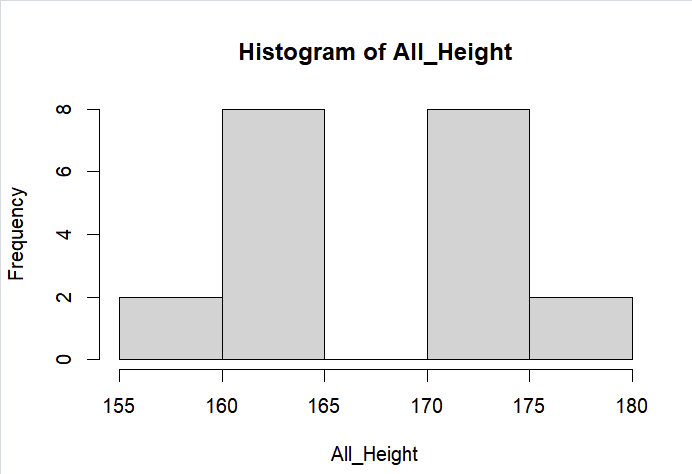
이 상태에서 hist()함수를 쓰면, 오류가 생긴다는 것을 알 수 있다.
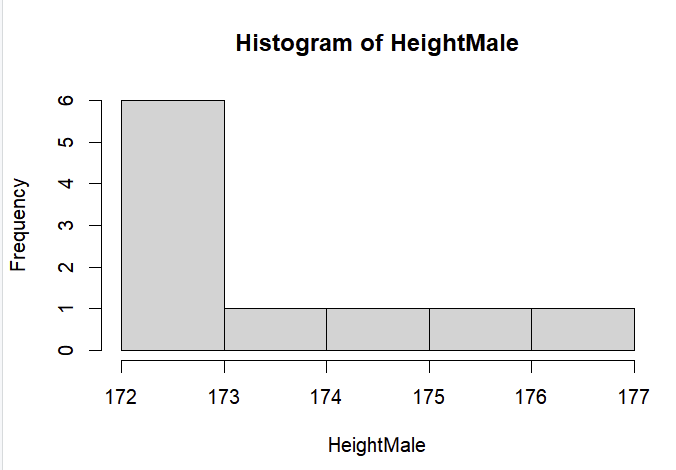
cf.) hist(): 주어진 데이터를 일정 구간으로 나누어 각 구간에 속하는 데이터의 빈도수를 계산하고, 이를 막대그래프로 그리는 함수.
그래서 필자는 이것을 factor로 바꾸어보았다.
여기서 보면 알 수 있듯이, 필자가 착각한게 앞에서 필기한 내용에 따르면 factor()가 숫자로 출력돼서 factor()을 썼었는데, 위와 같은 결과에서도 알 수 있듯이, factor()를 써도 똑같이 에러가 나온다는 것을 알 수 있다.
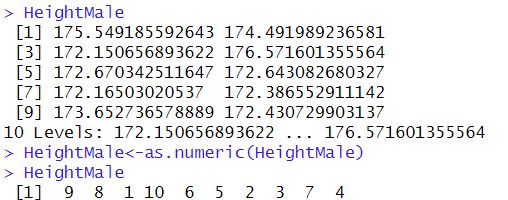
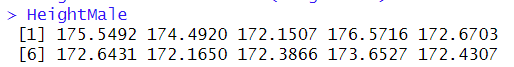
찾아보니, 문자를 숫자로 바꾸는 함수는 as.numeric()이라는 것을 알 수 있다. 여기서 주의할 점은 factor인 상태에서 as.numeric을 한다면, 순위가 나오는 것을 알 수 있다. 따라서, HeightMale 그 자체에서(factor() x) as.numeric()을 해야하며, 이렇게 바꾼다면 문자형이 숫자형으로 바뀌는 것을 알 수 있다.
HeightFemale도 마찬가지이다.
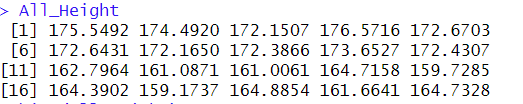
필자는 여기서 새로운 변수를 추가하는 것이 귀찮아 B[,2] 전체를 as.numeric()으로 하였으나, 무슨 이유인지 숫자형으로 바뀌지 않았다. 따라서, 새로운 변수인 All_Height을 새로 만들어 값을 저장했다. 이렇게 하면 장점은 B[,2] 데이터의 원본 형태를 그대로 유지할 수 있다는 장점이 있다.(데이터 클래스 등..)
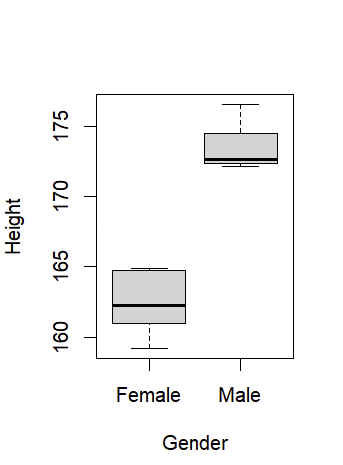
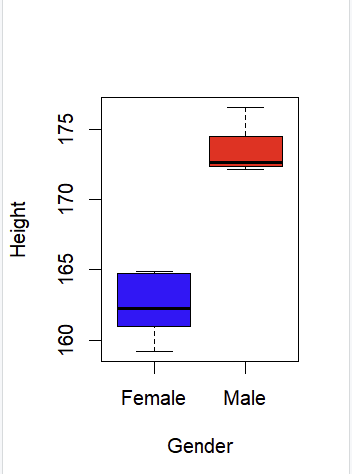
다음은, boxplot에 대해 알아보겠다.
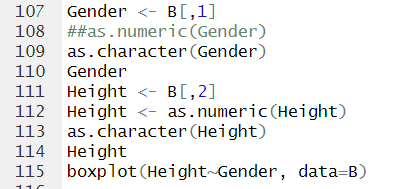
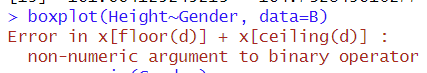
코드를 해석해보도록 하겠다. 각각 Gender,Height 변수를 새롭게 만들고, 각각의 변수는 문자형이 기본임을 알 수 있다. 이 상태로 boxplot을 하면, 오류가 생김을 알 수 있다.
cf.)boxplot(Gender~Height,...)의 의미: 왼쪽변수(Gender)를 오른쪽 변수(Height)로 모델링하겠다라는 의미이다. R에서의 tilde(~)기호이며, formula 연산자(모형 수식을 정의하는데 사용되는 연산자)로 사용된다. 다만, 이 연산자는 변수 간의 종속성을 나타내는 것은 아니다. 단지, Height 변수의 분포가 Gender 변수에 따라 어떻게 달라지는 것인지 보여주는 것이다. 하지만, 이 경우, Gender 변수는 그 자체로 독립적인 변수지만, Height 변수는 Gender에 따라 모델링 되므로 종속 변수이다. 하지만, 이렇다고 해서 종속성을 나타내는 연산자는 아님을 기억하자!
이 에러는 숫자형이 아닌 변수를 binary operator에 적용시킬 수 없다는 에러인데, 즉, 문자형을 숫자형으로 바꾸어야 한다.
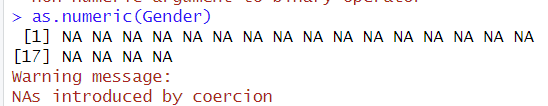
다만, Gender의 문자형까지 숫자형으로 바꾸면, 모두 NA 처리가 되니, 숫자 상태인 문자형만 숫자형으로 바꿔주기만 하면 된다.
cf.) 데이터 클렌징에서 NA 상태는 무조건 제거하는 편이 좋다.
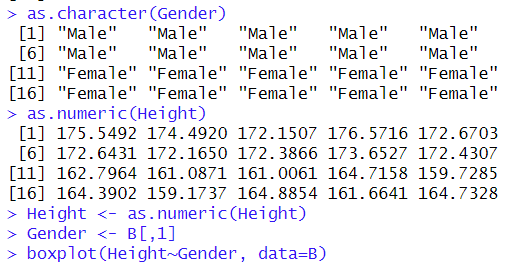
as.character()는 문자형으로 변환시켜주는 함수이고, 아래와 같이 코드를 마무리하면, boxplot이 출력된다.
cf.)만약, Gender가 as.numeric()상태이라면, as.character()로 다시 변환한뒤, Gender <- B[,1]을 하면 된다.
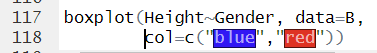
다음은, boxplot에 색깔을 입히는 과정이다. 그냥 코드만 소개해주고 마무리하겠다.
p.s. 충고해주고 싶은 점이 한가지 있다. 필자가 쓴 코드를 무작정 외우는 것이 아닌 과정을 이해하면서 외웠으면 한다. 즉, 왜 이런 결과가 나오는지 과정을 이해하고 일부 코드 부분을 외우면, 나중에 응용할 때 쉬워질 것이다. r 프로그래밍은 비교적 다른 c언어에 비해 매우 직관적이라, 과정을 이해하면 쉽게 접근할 수 있을 것이다.

Advanced Visualization
Based on 3rd party packages(ggplot2 and ggpubr)
이 visualization은 추후에 나오는 chapter에서 자세하게 다룰 것이다.