주유 가격 비교 분석
셀프 주유소가 정말 저렴한지 분석하기 위한 데이터 확보
- https://www.opinet.co.kr/searRgSelect.do
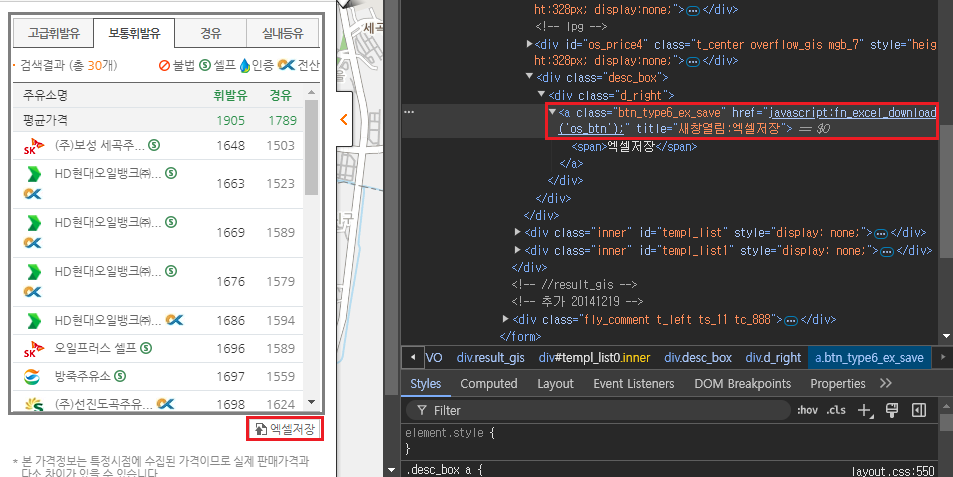
- 사이트 구조 확인
- 목표 데이터
- 브랜드
- 가격
- 셀프 주유 여부
- 위치
01. web crawling with selenium
모듈 import
import numpy as np
import pandas as pd
import json
import folium
import warnings
warnings.simplefilter(action="ignore", category=FutureWarning)

from glob import glob
from bs4 import BeautifulSoup
from selenium import webdriver
from selenium.webdriver.common.by import By
주유 사이트 접속
url = "https://www.opinet.co.kr/searRgSelect.do"
driver = webdriver.Chrome()
driver.get(url)
시/도 선택
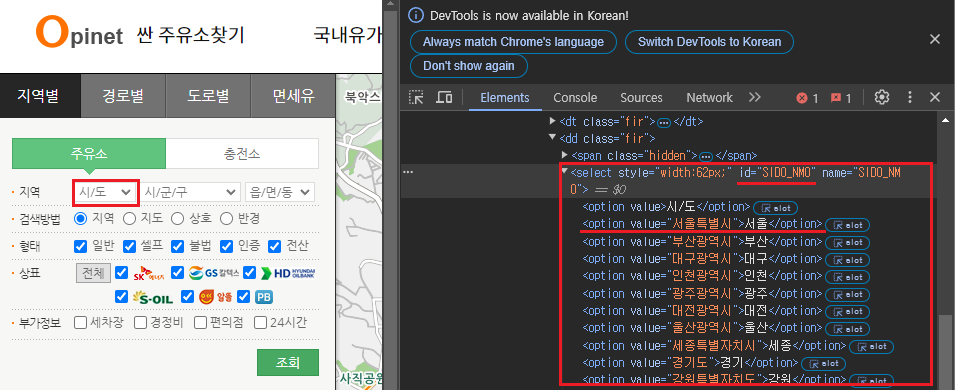
sido_list_raw = driver.find_element(By.ID, "SIDO_NM0")
sido_list = sido_list_raw.find_elements(By.TAG_NAME, "option")

sido_names = [option.get_attribute("value") for option in sido_list]
sido_names = sido_names[1:]

sido_list_raw.send_keys(sido_names[0])
시/군/구 선택
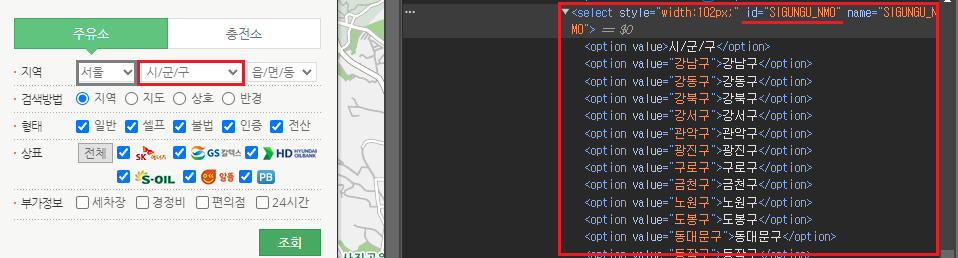
gu_list_raw = driver.find_element(By.ID, "SIGUNGU_NM0")
gu_list = gu_list_raw.find_elements(By.TAG_NAME, "option")

gu_names = [option.get_attribute("value") for option in gu_list]
gu_names = gu_names[1:]
gu_names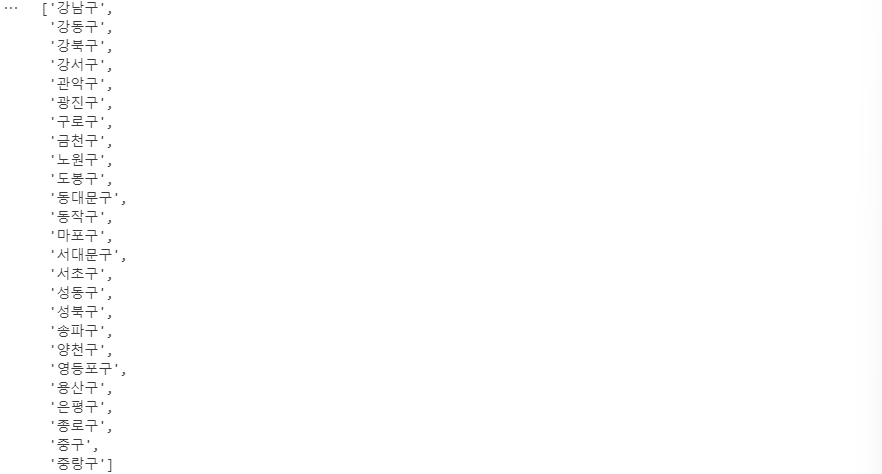
구별 데이터 조회 및 저장
import time
from tqdm import tqdm_notebook

for gu in tqdm_notebook(gu_names):

    # 구별 데이터 조회
    element = driver.find_element(By.ID, "SIGUNGU_NM0")
    element.send_keys(gu)
    time.sleep(3)

    # 엑셀 저장
    element_get_excel = driver.find_element(By.CSS_SELECTOR, "#templ_list0 > div:nth-child(7) > div > a").click()
    time.sleep(3)

driver.close()
02. data preprocessing
구별 데이터 가져오기
파일명의 규칙을 이용하여 파일 목록을 가져옴

stations_files = glob("./data/지역_*.xls")
stations_files[:5]
동일한 형태로 불러오기
불필요한 row제외
동일한 형태 유지

tmp_raw = []

for file_name in stations_files:
    tmp = pd.read_excel(file_name, header=2)
    tmp_raw.append(tmp)
구별 데이터 취합
stations_raw = pd.concat(tmp_raw)
stations_raw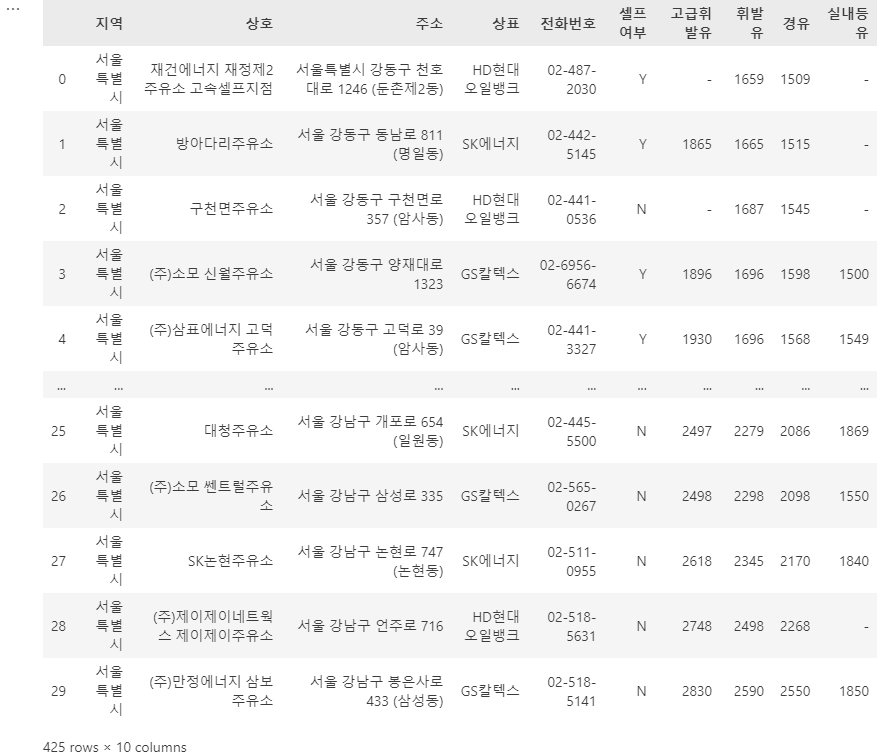
DataFrame 형태로 변환
stations = pd.DataFrame({
    "상호": stations_raw["상호"],
    "주소": stations_raw["주소"],
    "가격": stations_raw["휘발유"],
    "셀프": stations_raw["셀프여부"],
    "상표": stations_raw["상표"]
})
stations.tail()
'구'컬럼 추가
stations["구"] = [eachAddress.split()[1] for eachAddress in stations["주소"]]
stations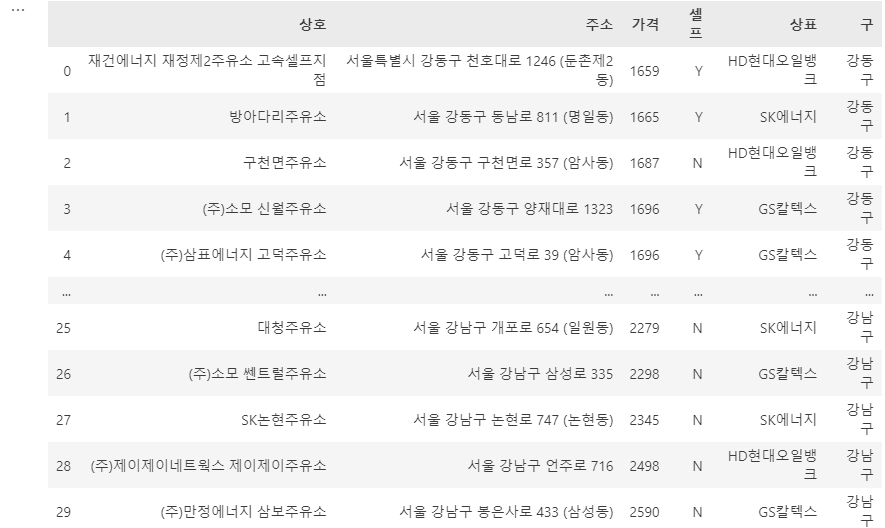
인덱스 재설정
구별 데이터의 인덱스가 그대로 취합되어
새로운 인덱스를 설정하고 구별데이터 삭제
# 인덱스 재정렬
stations.reset_index(inplace=True)
# 인덱스 삭제
del stations["index"]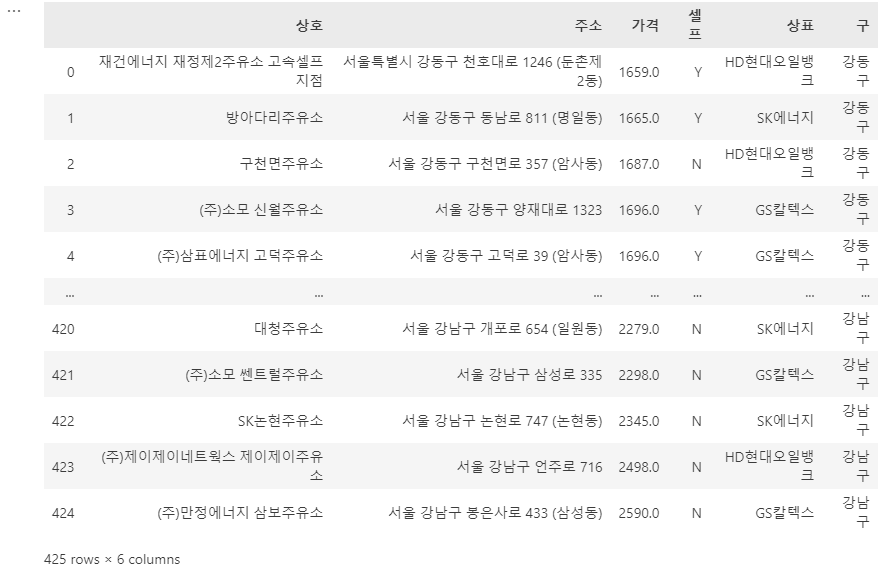
03. 주유 가격 정보 시각화
셀프 여부에 따른 주유 가격
plt.figure(figsize=(12, 8))
sns.boxplot(x="셀프", y="가격", data=stations, palette="Set1")
plt.grid(True)
plt.show()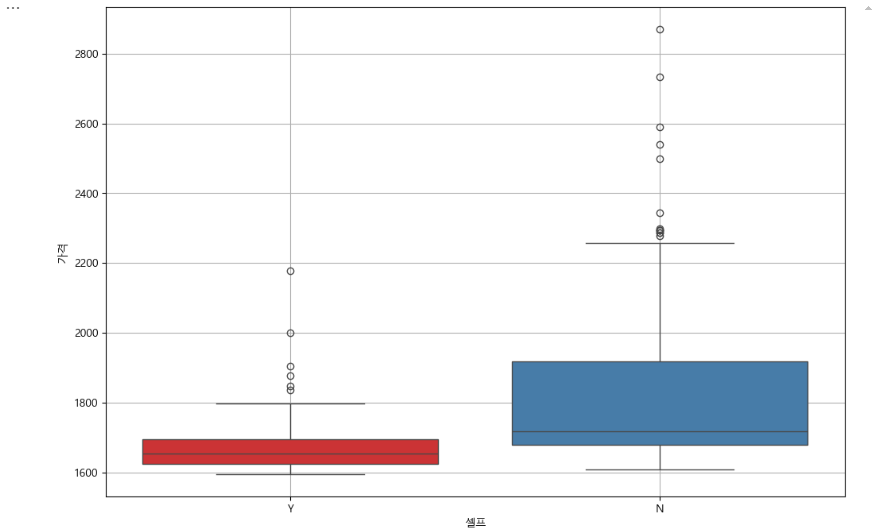
브랜드별 주유 가격
plt.figure(figsize=(12, 8))
sns.boxplot(x="상표", y="가격", hue="셀프", data=stations, palette="Set3")
plt.grid(True)
plt.show()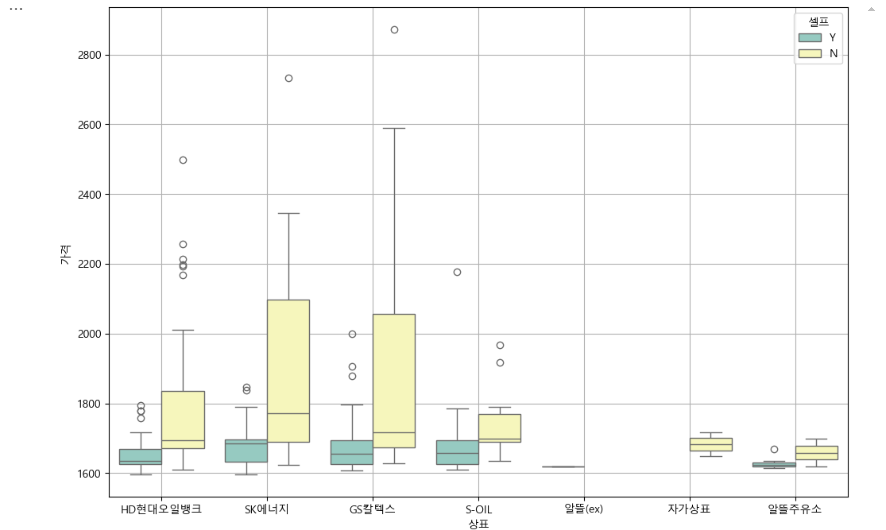
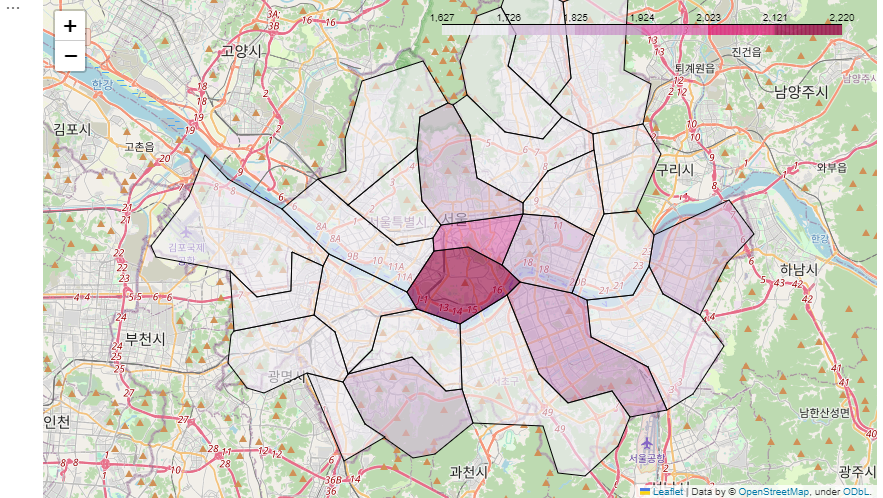
주유 가격의 지도 시각화
geo_path = "../02. Analysis Seoul Crime/data/02. skorea_municipalities_geo_simple.json"
geo_str = json.load(open(geo_path, encoding="utf-8"))

my_map = folium.Map(location=[37.5502, 126.982], zoom_start=10.5)
my_map.choropleth(
    geo_data=geo_str,
    data=gu_data,
    columns=[gu_data.index, "가격"],
    key_on="feature.id",
    fill_color="PuRd"
)
my_map