(Eng) Machine Learning, Linear Algebra, and Data Cleaning
In this post, I explain what machine learning is and why linear algebra is important for it. I also briefly introduce EDA (Exploratory Data Analysis) and summarize common data-cleaning methods.
Linear Algebra
For English readers, a small note about terminology: in Korean math education, what English calls a linear equation is usually taught as a first‑order equation. Because of this mismatch, I did not initially connect the word “linear” with degree‑1 equations or with a linear system. In addition, the Korean translation of “linear algebra” can sound like “algebra about the shape of lines,” which further obscures the meaning. This explains why explanations that seem obvious in English texts (almost like A = A) needed to be spelled out in detail for me.
I looked for linear algebra books used as university textbooks, but most of them started chapter 1 with what a vector is and how to solve problems. I couldn’t find a clear definition. Even in the introductions that appear occasionally, there was a lack of a clear explanation about the definition of linear algebra.
However, what these documents commonly explain is that linear algebra is the discipline that deals with linear equations.
Linear Equations
While digging through more linear algebra books, I found a book that explains linear systems. In the first chapter of Jim Hefferon, Linear Algebra (4th ed.), it begins with “Systems of linear equations are common in science and mathematics.” and it explains how linear equations are used in mathematics and science by giving examples such as how to balance two different objects on a lever and how to find the ratio of ingredients and products in the synthesis method of TNT (bomb raw material).
Finding the mixing ratio for TNT synthesis

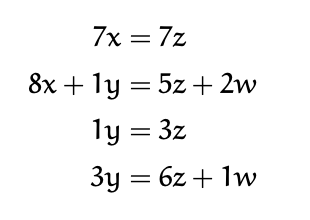
(Source): Jim Hefferon. Linear Algebra (4th ed.). chapter 1
Even looking at it like this, it doesn’t really click. What’s the difference between a linear equation and a general equation?
Personally, I think the name “linear algebra” is ambiguous, so it doesn’t click at once. So I searched “linear” in the Oxford dictionary.
(mathematics) able to be represented by a straight line on a graph
linear equations
Found it. A linear equation is a (straight-)line equation.
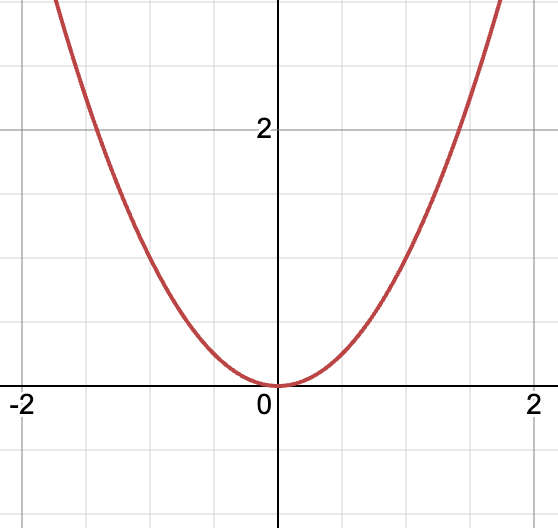
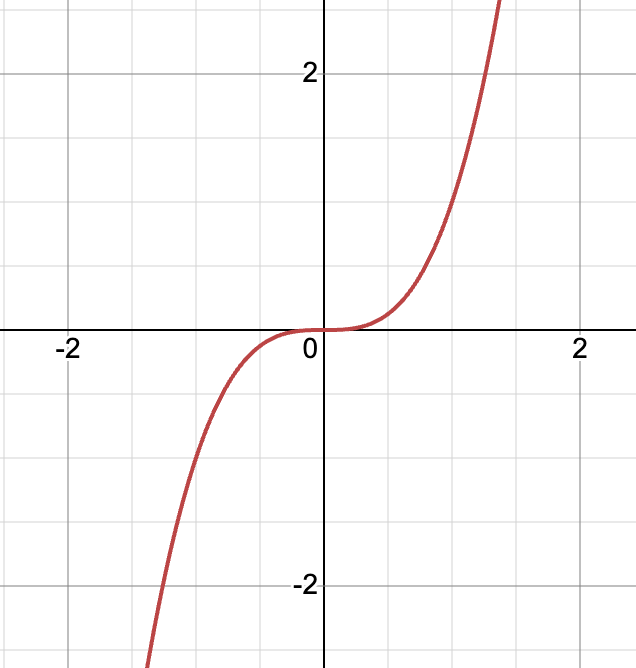
If an equation whose degree is greater than 1 is represented as a graph, the resulting graphs are no longer (straight-)linear.
Additionally, in Korea we refer to them as the “first-degree graph,” “second-degree graph,” and “third-degree graph,” but in English these are literally called the linear equation graph, quadratic equation graph, and cubic equation graph.
Because the expressions and their nuance differ, I had not connected that a “first-degree system of equations” corresponds to a linear system.
Quadratic equation graph (y = x^2)
Cubic equation graph (y = x^3)
Now I think I understand Wikipedia’s definition of linear algebra. Linear algebra is the branch of mathematics concerning linear equations
Why is it needed in machine learning?
Machine learning is the discipline that studies methods of improving the system itself by using experience as a tool called a computer. In computer systems, experience generally exists in the form of data, and therefore the main content that machine learning studies can be said to be learning algorithms, that is, algorithms that create a model from data by using a computer.[^1]
But the shape of data can vary widely. Why do we specifically use the shapes of linear equations—matrices—vectors?
| 구 | 동 | 계약일 | 거래금액(만원) | 전용면적(㎡) | 층 | 건축년도 | 건물유형 |
|---|---|---|---|---|---|---|---|
| 동작구 | 신대방동 | 2025-12-31 | 73,000 | 59.76 | 4 | 1997 | 아파트 |
| 송파구 | 문정동 | 2025-12-31 | 17,050 | 19.74 | 7 | 2016 | 오피스텔 |
| 양천구 | 신정동 | 2025-12-31 | 122,800 | 113.91 | 16 | 2000 | 아파트 |
Isn’t it okay to just store each feature as individual data points like this?
WHEN two or more populations have been measured in several characters, xl, ... , x8, special interest attaches to certain linear functions of the measurements by which the populations are best discriminated.(Fisher, 1936, p. 179)
If we just compare data feature by feature, we might get a good look at things on a column level, but it’s really hard to relate the row context of that specific observation. Once we use linear combinations, though, we can finally compare those measurements while keeping the entire context in view.
When we are working to improve a system through experience, we need two things: the data itself and a clear criterion to classify that data correctly. My conclusion is that linear algebra is essential for machine learning because these linearly combined data sets are the perfect fit for those criteria
EDA(Exploratory Data Analysis)
All in all, I have come to feel that my central interest is in data analysis, which I take to include, among other things: procedures for analyzing data, techniques for interpreting the results of such procedures, ways of planning the gathering of data to make its analysis easier, more precise or more accurate, and all the machinery and results of (mathematical) statistics which apply to analyzing data.(Tukey, 1962, p. 2)
The author breaks down what’s actually packed into 'data analysis':
- Procedures for actually crunching the data.
- Techniques for interpreting results (the essential 'judgment process').
- Strategies for planning data collection to make the analysis easier, more accurate, and more precise right from the start.
- The whole machinery of mathematical statistics and the theoretical frameworks we apply to analyzing data.
But here’s the catch: if your data quality is poor, your analysis results are bound to be inaccurate. Raw data from the real world is messy—full of missing values, outliers, and duplicates. To bump up that data quality, we have to go through various preprocessing (data cleaning) steps first.
Data Preprocessing
Missing Values
Missing Value. When data points are missing or simply not recorded.
Missing data mechanism
| 구분 | MCAR | MAR | MNAR |
|---|---|---|---|
| Term | Missing Completely At Random | Missing At Random | Missing Not At Random |
| Definition | The missingness has absolutely nothing to do with any variables. | The missingness depends on other observed data, but not the missing value itself. | The missingness directly depends on the missing value itself. |
| Predictable | Impassible | Predictable using other variables | Can't predict without knowing the actual missing value. |
| Example | System glitch randomly drops transaction amounts. | March was packed with contracts, causing manual data entry skips. (Contract date explains it). | High-rollers dodging taxes deliberately skip reporting big transaction amounts. |
Here is how you handle missing values:
- Deletion: Toss out the missing chunks.
- Imputation: Fill in the blanks.
Deletion
| Address1 | Address2 | Contract Date | Price(만원) | Floor Area(㎡) | Floor | Year Built | Building Type |
|---|---|---|---|---|---|---|---|
| 동작구 | 신대방동 | 2025-03-17 | NA | 59.76 | 4 | 1997 | 아파트 |
| 송파구 | 문정동 | 2025-12-31 | 17,050 | 19.74 | 7 | 2016 | 오피스텔 |
| 양천구 | 신정동 | 2025-12-31 | 122,800 | 113.91 | 16 | 2000 | 아파트 |
For example, delete first row because price of first row is missing value.
| Address1 | Address2 | Contract Date | Price(만원) | Floor Area(㎡) | Floor | Year Built | Building Type |
|---|---|---|---|---|---|---|---|
| 송파구 | 문정동 | 2025-12-31 | 17,050 | 19.74 | 7 | 2016 | 오피스텔 |
| 양천구 | 신정동 | 2025-12-31 | 122,800 | 113.91 | 16 | 2000 | 아파트 |
Pros
- Simple and straightforward—no complex assumptions needed.
Cons
- Shreds sample size.
- osses out other valuable information packed in same rows.
- If data is missing for a reason (MAR or MNAR), deletion triggers selection bias, completely warping the stats.
Imputation
Single Imputation
- Mean Imputation
- Regression imputation
- Building a regression model to predict and plug in the missing values based on patterns.
- Stochastic regression imputation
- Stepping up the regression approach by adding raw residuals (error terms) to mimic real-world noise.
- These residuals are randomly pulled from the differences between the model's predictions and actual observed data.
- Hot-Deck
- Copying and pasting data from a complete record within the exact same dataset (donor-based imputation)
- Similar Response Pattern : A flavor of Hot-Deck that finds the closest matching profile to clone the missing data point.
- Averaging the Available Items imputation
- Using other feature values from the same respondent to figure out the missing piece.
- This fails if too much data is missing, so it is usually capped at a 30% threshold.
- Works best when features are tightly linked (ex. multi-item scales in depression screening).
- Last Observation Carried Forward
- Dragging the last recorded data point forward to fill the gap.
- Ideal for features that do not change much unless a specific action triggers them.
Maximum Likelihood Estimation
- Building a model based on the distribution of observed data to predict missing spots.
- The Univariate Normal Distribution
- Assume that a single feature follows a normal distribution curve.
- The Sample Likelihood & Log Likelihood
- Grabbing a few samples from the dataset to test how well they fit the assumed model (the probability of these samples popping up in the model).
- To get the overall probability, have to multiply the chances of each independent sample together. But since computers choke on tiny decimal numbers (floating-point underflow), flip the math into a log scale to make the crunching incredibly fast and efficient.
An Illustrative Computer Simulation Study
Running simulation tests to put the models above through the wringer. (Heads up: needs a quick fact-check & more details).
Duplicates
- If rows have clear identifiers (like IDs or primary keys), exact clones of the same record must be deleted. Keeping duplicate samples breaks the core assumption of independence and injects massive bias into predictive models.
- Without unique identifiers, duplicates should be checked weather actual the same entity or different records look identical by pure coincidence.
- Records can still be duplicates even if they don't match word-for-word. Typos, language differences, and flipped date formats (MM/DD/YYYY vs DD/MM/YYYY) can mask duplicates from simple string matches.
- To catch these, calculate a pattern-matching score. This measures whether the similarity is natural for the same object, or just a fluke between two different ones. By setting an acceptable error threshold, you can classify pairs as a definite match (link), a clear miss (non-link), or put them in the "too close to call" pile (possible-link) for manual review.
Outliers
Data points that sit far away from expected observation baseline. These are anomalies that rarely pop up in normal datasets.
- Errors: Caused by glitches in measuring, logging, or calculating. These are pure noise and need to be tossed out immediately.
- Natural extremes: Valid, real-world data points that just happen to have a very low probability of occurring.
anomaly : A broader term for patterns that fail to follow expected behavior. It actually includes outliers under its umbrella. (Note: saving this for a deep dive later, skipping for this post).
reference
- Hefferon, J. (2020). Linear Algebra (4th ed.).
- Fisher, R. A. (1936). The use of multiple measurements in taxonomic problems. Annals of Eugenics, 7(2), 179–188.
- Tukey, J. W. (1962). The future of data analysis. The Annals of Mathematical Statistics, 33(1), 1–67.
- Tukey, J. W. (1977). Exploratory Data Analysis. Reading, MA: Addison-Wesley.
- Enders, C. K. (2010). Applied Missing Data Analysis.
- Fellegi, I. P., & Sunter, A. B. (1969). A theory for record linkage. Journal of the American Statistical Association, 64(328), 1183–1210.
- [^1] 조우쯔화 (2020). 단단한 머신러닝
- Han, J., Kamber, M., & Pei, J. (2011). Data Mining: Concepts and Techniques (3rd ed.).
- Chandola, Banerjee, Kumar (2009) — Anomaly Detection: A Survey
- Barnett, V., & Lewis, T. (1978). Outliers in Statistical Data. London: John Wiley & Sons.