📌 단순회귀분석
독립변수와 종속변수 간의 관계를 나타내는 선형회귀식을 도출하여 변수 간 연관성 분석
- 단순회귀분석 : 1개의 연속형 독립변수를 이용하여 1개의 연속형 종속변수를 예측
- 다중회귀분석 : 2개 이상의 연속형 독립변수를 이용하여 1개의 연속형 종속변수를 에측
- 다항회귀분석 : 1개의 연속형 독립변수를 이용하여 1개의 연속형 종속변수를 예측, n차 다항식으로 모델링
📌 최소자승법
산점도 상에 관측된 각 좌표점과 임의의 직선 사이의 수직거리를 제곱하여 합한 값이 가장 작게 되는 직선의 거리를 찾는 방법이다.
최소자승법에 의해 구해진 직선을 회귀선(regression line)이라고 한다.
y = B_0 + B_1 * x
- y : 종속변수
- X : 독립변수
- B_0 : 절편
- B_1 : 기울기
> library(car)
> str(Prestige)
'data.frame':	102 obs. of  6 variables:
 $ education: num  13.1 12.3 12.8 11.4 14.6 ...
 $ income   : int  12351 25879 9271 8865 8403 11030 8258 14163 11377 11023 ...
 $ women    : num  11.16 4.02 15.7 9.11 11.68 ...
 $ prestige : num  68.8 69.1 63.4 56.8 73.5 77.6 72.6 78.1 73.1 68.8 ...
 $ census   : int  1113 1130 1171 1175 2111 2113 2133 2141 2143 2153 ...
 $ type     : Factor w/ 3 levels "bc","prof","wc": 2 2 2 2 2 2 2 2 2 2 ...

> head(Prestige)
                    education income women prestige census type
gov.administrators      13.11  12351 11.16     68.8   1113 prof
general.managers        12.26  25879  4.02     69.1   1130 prof
accountants             12.77   9271 15.70     63.4   1171 prof
purchasing.officers     11.42   8865  9.11     56.8   1175 prof
chemists                14.62   8403 11.68     73.5   2111 prof
physicists              15.64  11030  5.13     77.6   2113 prof
📌 회귀분석
lm(종속변수~독립변수, data=)
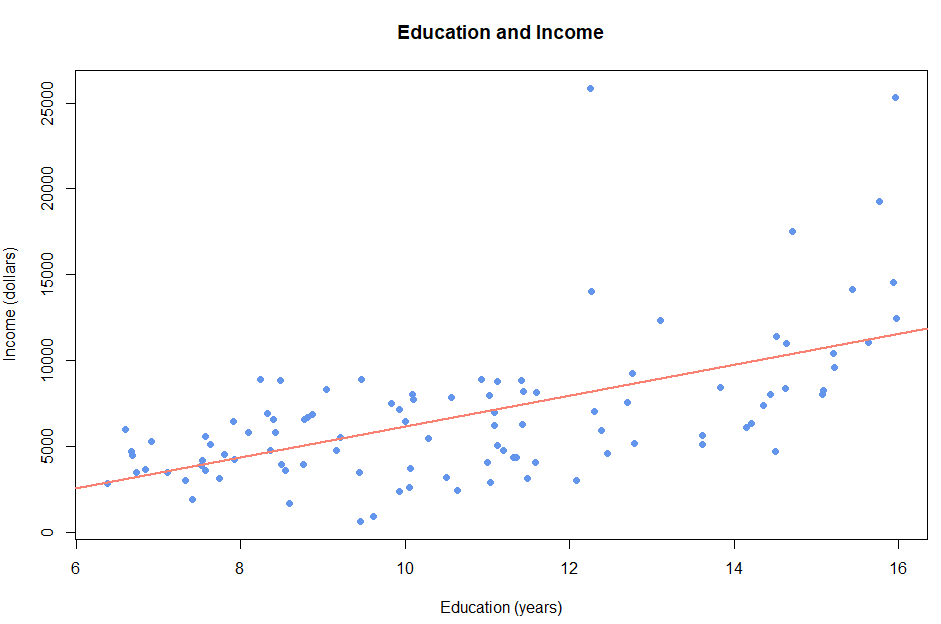
교육기관과 소득 간의 관계 분석
> Prestige.lm <- lm(income ~ education, data=Prestige)
> Prestige.lm

Call:
lm(formula = income ~ education, data = Prestige)

Coefficients:
(Intercept)    education
    -2853.6        898.8
절편 = -2853.6, 기울기 = 898.8
> windows(width=12, height=8)
> plot(Prestige$income ~ Prestige$education,
+      col="cornflowerblue", pch=19,
+      xlab="Education (years)", ylab="Income (dollars)",
+      main="Education and Income")

> abline(Prestige.lm, col="salmon", lwd=2)
교육기관과 소득은 양의 관계를 갖는다.
교육기관이 1년 증가할 때마다 소득은 898.8 달러씩 증가한다.

> summary(Prestige.lm)

Call:
lm(formula = income ~ education, data = Prestige)

Residuals:
    Min      1Q  Median      3Q     Max
-5493.2 -2433.8   -41.9  1491.5 17713.1

Coefficients:
            Estimate Std. Error t value Pr(>|t|)
(Intercept)  -2853.6     1407.0  -2.028   0.0452 *
education      898.8      127.0   7.075 2.08e-10 ***
---
Signif. codes:  0 ‘***’ 0.001 ‘**’ 0.01 ‘*’ 0.05 ‘.’ 0.1 ‘ ’ 1

Residual standard error: 3483 on 100 degrees of freedom
Multiple R-squared:  0.3336,	Adjusted R-squared:  0.3269
F-statistic: 50.06 on 1 and 100 DF,  p-value: 2.079e-10
- Residuals : 잔차의 분포
중위수 = -41.9 이므로 평균 0을 중심으로 왼쪽에 있다.
잔차는 오른쪽으로 긴 꼬리 모양의 분포임을 알 수 있다.
- Coefficients : 회귀계수 추정치 및 회귀계수에 대한 유의성 검정
- education p-value = 2.08e-10이므로 통계적으로 유의미하다.
- Residual standard error (RSE) = 3483 작은 값을 가질수록 모델의 적합도가 좋다.
- Multiple R-squared = 0.3336, 회귀모형의 설명력 33.36%를 설명한다.
- F-statistic = 50.06 : 회귀식 유의성 검정 F통계량
- F-statistic의 p-value = 2.079e-10 : 모형의 유의성 검정
즉 회귀모형은 통계적으로 유의하다.
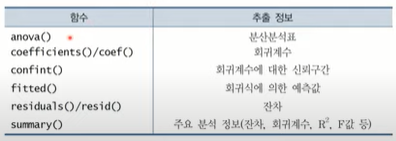
> coef(summary(Prestige.lm))
              Estimate Std. Error   t value     Pr(>|t|)
(Intercept) -2853.5856  1407.0392 -2.028078 4.521163e-02
education     898.8128   127.0354  7.075294 2.079192e-10

> anova(Prestige.lm)
Analysis of Variance Table

Response: income
           Df     Sum Sq   Mean Sq F value    Pr(>F)
education   1  607421386 607421386   50.06 2.079e-10 ***
Residuals 100 1213392025  12133920
---
Signif. codes:  0 ‘***’ 0.001 ‘**’ 0.01 ‘*’ 0.05 ‘.’ 0.1 ‘ ’ 1

> coef(Prestige.lm)  # 절편과 기울기
(Intercept)   education
 -2853.5856    898.8128

> fitted(Prestige.lm)[1:3]
gov.administrators   general.managers        accountants
          8929.851           8165.860           8624.254

> resid(Prestige.lm)[1:3]
gov.administrators   general.managers        accountants
         3421.1492         17713.1401           646.7456

> Prestige$income[1:3]
[1] 12351 25879  9271
📌 새로운 데이터에 대한 예측값 추정
교육기관이 5년 10년 15년일 때의 소득 예측
> Prestigy.new <- data.frame(education=c(5, 10, 15))
> Predict(Prestige.lm, newdata=Prestigy.new)
        1         2         3
 1640.479  6134.543 10628.607

> Predict(Prestige.lm, newdata=Prestigy.new, interval="confidence")
        fit        lwr       upr
1  1640.479   40.57439  3240.383
2  6134.543 5425.42801  6843.658
3 10628.607 9355.00309 11902.211
📌 일부에 대해서만 회귀분석
평균보다 더 많은 교육을 받은 집단과 그렇지 않은 집단 회귀분석
> mean(Prestige$education)
[1] 10.73804

> lm(income ~ education, data=Prestige,
+    subset=(education > mean(Prestige$education)))

Call:
lm(formula = income ~ education, data = Prestige, subset = (education >
    mean(Prestige$education)))

Coefficients:
(Intercept)    education
     -10299         1455

> lm(income ~ education, data=Prestige,
+    subset=(education <= mean(Prestige$education)))

Call:
lm(formula = income ~ education, data = Prestige, subset = (education <=
    mean(Prestige$education)))

Coefficients:
(Intercept)    education
     2546.6        281.8