📌 다항회귀분석(Polynomial regression analysis)
- 단순회귀분석처럼 한 개의 연속형 독립변수를 이용하여 한 개의 연속형 종속변수를 예측한다.
- 단순회귀분석과 달리 선형관계는 독립변수의 n차 다항식으로 모델링한다.
- y = B_0 + B_1 x + B_2 x^2
- 산점도에 관측값을 통과하는 추세선을 그렸을 때 n-1개의 굴절이 관찰되면 일반적으로 이를 n차 다항식으로 모델링
> library(car)
> str(Prestige)
'data.frame':	102 obs. of  6 variables:
 $ education: num  13.1 12.3 12.8 11.4 14.6 ...
 $ income   : int  12351 25879 9271 8865 8403 11030 8258 14163 11377 11023 ...
 $ women    : num  11.16 4.02 15.7 9.11 11.68 ...
 $ prestige : num  68.8 69.1 63.4 56.8 73.5 77.6 72.6 78.1 73.1 68.8 ...
 $ census   : int  1113 1130 1171 1175 2111 2113 2133 2141 2143 2153 ...
 $ type     : Factor w/ 3 levels "bc","prof","wc": 2 2 2 2 2 2 2 2 2 2 ...
📌 교육기관과 소득 간의 관계 분석
단순회귀분석
> Prestige.lm <- lm(income ~ education, data=Prestige)
> summary(Prestige.lm)

Call:
lm(formula = income ~ education, data = Prestige)

Residuals:
    Min      1Q  Median      3Q     Max
-5493.2 -2433.8   -41.9  1491.5 17713.1

Coefficients:
            Estimate Std. Error t value Pr(>|t|)
(Intercept)  -2853.6     1407.0  -2.028   0.0452 *
education      898.8      127.0   7.075 2.08e-10 ***
---
Signif. codes:  0 ‘***’ 0.001 ‘**’ 0.01 ‘*’ 0.05 ‘.’ 0.1 ‘ ’ 1

Residual standard error: 3483 on 100 degrees of freedom
Multiple R-squared:  0.3336,	Adjusted R-squared:  0.3269
F-statistic: 50.06 on 1 and 100 DF,  p-value: 2.079e-10
회귀식 : income = -2853.6 + 898.8 * education
교육기간이 1년 증가할 때 마다 소득은 898.8 달러씩 증가한다.
> windows(width=12, height=8)
> plot(Prestige$income ~ Prestige$education,
+      col="cornflowerblue", pch=19,
+      xlab="Education (years)", ylab="Income (dollars)",
+      main="Education and Income")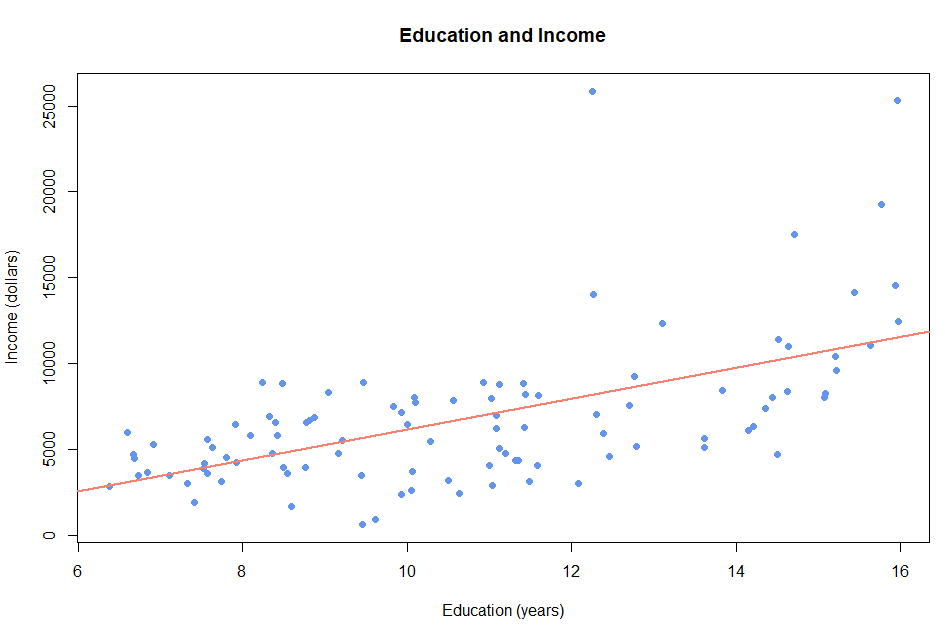
산점도 관측값들을 보면 교육기관이 짧을 때와 길 때 소득에 미치는 영향이 다르다. 교육기관이 길 때는 짧을 때에 비해 한 단위 증가에 따른 소득의 증가폭이 더 크다. 직선이 교육기관과 소득 간의 관계를 잘 표현하는지는 더 생각해볼 필요가 있다.
📌 교육기관이 짧은 집단과 긴 집단으로 나누어 회귀분석
> lm(income ~ education, data=Prestige,
+    subset=(education > mean(Prestige$education)))  # 긴 집단

Call:
lm(formula = income ~ education, data = Prestige, subset = (education >
    mean(Prestige$education)))

Coefficients:
(Intercept)    education
     -10299         1455

> lm(income ~ education, data=Prestige,
+    subset=(education <= mean(Prestige$education)))  # 짧은 집단

Call:
lm(formula = income ~ education, data = Prestige, subset = (education <=
    mean(Prestige$education)))

Coefficients:
(Intercept)    education
     2546.6        281.8
긴 집단 : 독립변수 회귀계수 1455
짧은 집단 : 독립변수 회귀계수 281.8
두 집단에 있어서 회귀선의 기울이가 다르다는 것은 단일 직선의 회귀선 보다는 굴절을 갖는 곡선에 의해서 더 잘 설명될지도 모른다.
> scatterplot(income ~ education, data=Prestige,
+             pch=19, col="orangered", cex=1.2,
+             regLine=list(method=lm, lty=2, lwd=3, col="royalblue"),
+             smooth=list(soother=loessLine, spread=FALSE,
+                         lty.smooth=1, lwd.smooth=3, col.smooth="green3"),
+             xlab="Education (years)", ylab="Income (dollars)",
+             main="Education and Income")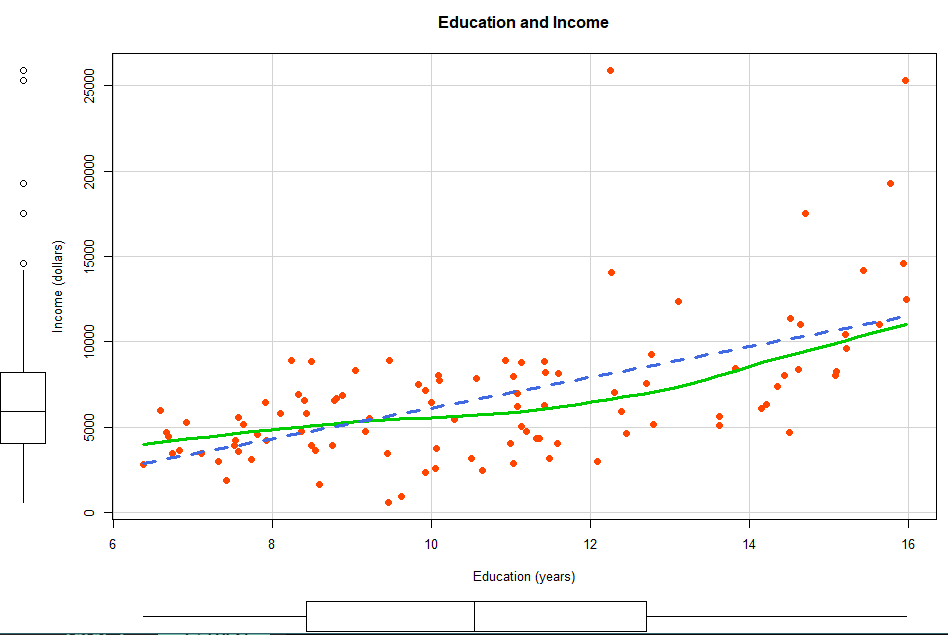
- regLine : 직선
- method=lm : 선형 회귀선
- smooth : 곡선 추세선
- soother=loessLine : 현제 데이터의 구간별 가장 적합한 추세선
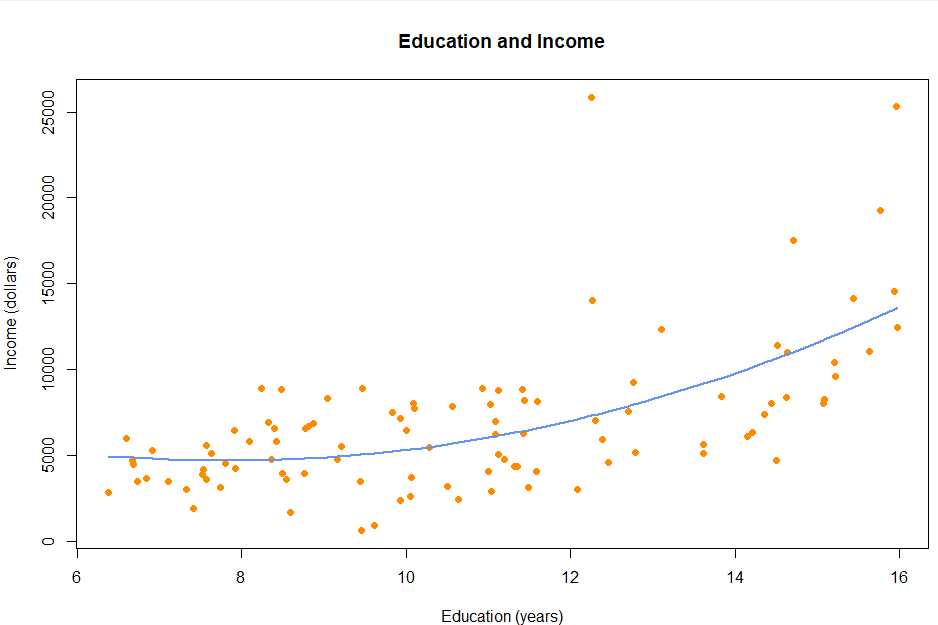
곡선 loess 추세선이 개별 데이터를 더 잘 나타낸다. 따라서 2차항 회귀모델이 더 적합하다.
다항회귀분석
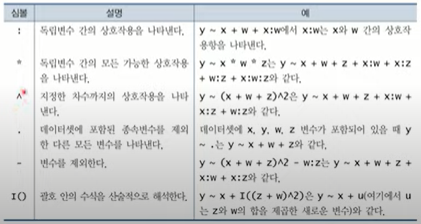
📝 포뮬러 심볼
> summary(prestige.poly)

Call:
lm(formula = income ~ education + I(education^2), data = Prestige)

Residuals:
    Min      1Q  Median      3Q     Max
-5951.4 -2091.1  -358.2  1762.4 18574.2

Coefficients:
               Estimate Std. Error t value Pr(>|t|)
(Intercept)    12918.23    5762.27   2.242  0.02720 *
education      -2102.90    1072.73  -1.960  0.05277 .
I(education^2)   134.18      47.64   2.817  0.00586 **
---
Signif. codes:  0 ‘***’ 0.001 ‘**’ 0.01 ‘*’ 0.05 ‘.’ 0.1 ‘ ’ 1

Residual standard error: 3369 on 99 degrees of freedom
Multiple R-squared:  0.383,	Adjusted R-squared:  0.3706
F-statistic: 30.73 on 2 and 99 DF,  p-value: 4.146e-11
- p-value = 4.146e-11이므로 다항회귀 모델의 회귀식은 통계적으로 유의하다.
- RSE = 3369
- R-squared = 0.383
📌 단순회귀 결과와 비교
> Prestige.lm <- lm(income ~ education, data=Prestige)
> summary(Prestige.lm)

Call:
lm(formula = income ~ education, data = Prestige)

Residuals:
    Min      1Q  Median      3Q     Max
-5493.2 -2433.8   -41.9  1491.5 17713.1

Coefficients:
            Estimate Std. Error t value Pr(>|t|)
(Intercept)  -2853.6     1407.0  -2.028   0.0452 *
education      898.8      127.0   7.075 2.08e-10 ***
---
Signif. codes:  0 ‘***’ 0.001 ‘**’ 0.01 ‘*’ 0.05 ‘.’ 0.1 ‘ ’ 1

Residual standard error: 3483 on 100 degrees of freedom
Multiple R-squared:  0.3336,	Adjusted R-squared:  0.3269
F-statistic: 50.06 on 1 and 100 DF,  p-value: 2.079e-10
- p-value = 2.079e-10이므로 단순회귀 모델의 회귀식은 통계적으로 유의하다.
- RSE = 3483
- R-squared = 0.3336
RSE 값은 작을수록 좋고, R-squared 값은 클수록 좋다.
따라서 다항회귀 모델이 단순회귀 모델에 비해서 더 우수하다.
⭐ 다중공선성 ⭐
- I(education^2)의 p-value = 0.00586 통계적으로 유의하다.
- education의 p-value = 0.05277 통계적으로 유의하지 않다.
두 독립변수 간의 통계적 유의성이 다르게 나타난 이유는 ❓
두 독립변수 간의 강한 상관관계가 이유일 수도 있다. => ⭐다중공선성⭐
다항회귀분석은 다중공선성이 나타날 확률이 크다.
왜 ❓
2차항은 원래의 독립변수를 바탕으로 계산되기 때문에 상관관계가 크다. 다만 회귀식은 통계적으로 유의하기 때문에 예측이 주 목적이라면, 문제가 되지 않는다.
📌 faithful 데이터 셋으로 다항 회귀 분석
> str(faithful)
'data.frame':	272 obs. of  2 variables:
 $ eruptions: num  3.6 1.8 3.33 2.28 4.53 ...
 $ waiting  : num  79 54 74 62 85 55 88 85 51 85 ...

> # 분출 대기시간과 분출 지속시간 간의 관계
> scatterplot(eruptions ~ waiting, data=faithful,
+             pch=19, col="deepskyblue", cex=1.2,
+             regLine=list(method=lm, lty=2, lwd=3, col="blueviolet"),
+             smooth=list(soother=loessLine, spread=FALSE,
+                         lty.smooth=1, lwd.smooth=3, col.smooth="coral"),
+             xlab="waiting (minutes)", ylab="Eruptions (minutes)",
+             main="Waiting Time Between Eruptions and the Duration of the Eruptions")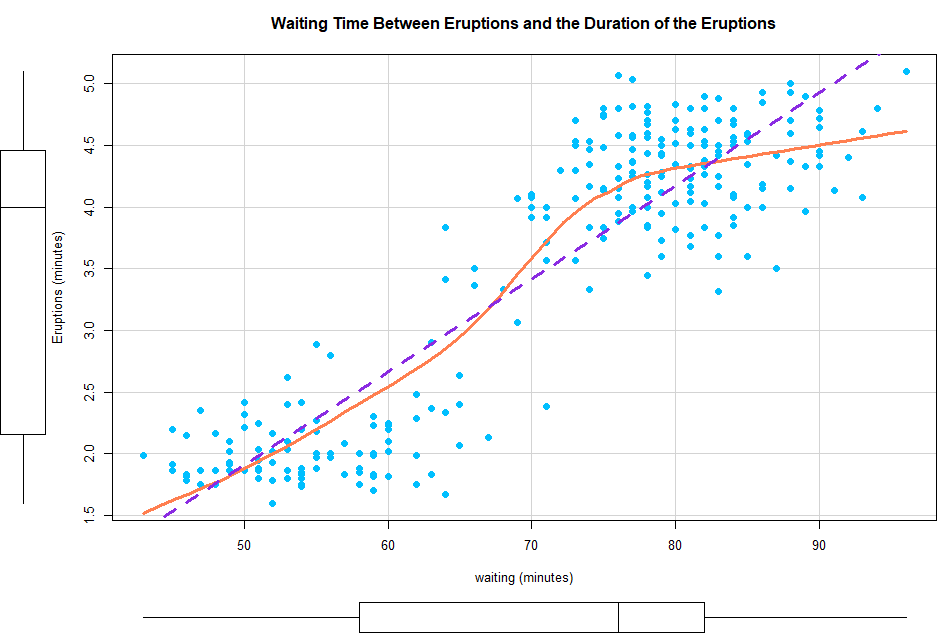
2개의 굴절이 나타나기 때문에 3차 다항식 회귀 모델을 해야 한다.
> faithful.ploy <- lm(eruptions ~ waiting + I(waiting^2) + I(waiting^3), data=faithful)
> summary(faithful.ploy)

Call:
lm(formula = eruptions ~ waiting + I(waiting^2) + I(waiting^3),
    data = faithful)

Residuals:
     Min       1Q   Median       3Q      Max
-1.20224 -0.21761 -0.02508  0.27463  1.28682

Coefficients:
               Estimate Std. Error t value Pr(>|t|)
(Intercept)   3.063e+01  3.722e+00   8.229 8.27e-15 ***
waiting      -1.438e+00  1.672e-01  -8.601 6.74e-16 ***
I(waiting^2)  2.290e-02  2.450e-03   9.346  < 2e-16 ***
I(waiting^3) -1.128e-04  1.176e-05  -9.593  < 2e-16 ***
---
Signif. codes:  0 ‘***’ 0.001 ‘**’ 0.01 ‘*’ 0.05 ‘.’ 0.1 ‘ ’ 1

Residual standard error: 0.4238 on 268 degrees of freedom
Multiple R-squared:  0.8637,	Adjusted R-squared:  0.8622
F-statistic:   566 on 3 and 268 DF,  p-value: < 2.2e-16
- p-value = < 2.2e-16 이므로 다항 회귀모델의 회귀식은 통계적으로 유의하다.
- RSE = 0.4238
- R-squared = 0.8637
📌 단순회귀분석과 비교
faithful.lm <- lm(eruptions ~ waiting, data=faithful)
> summary(faithful.lm)

Call:
lm(formula = eruptions ~ waiting, data = faithful)

Residuals:
     Min       1Q   Median       3Q      Max
-1.29917 -0.37689  0.03508  0.34909  1.19329

Coefficients:
             Estimate Std. Error t value Pr(>|t|)
(Intercept) -1.874016   0.160143  -11.70   <2e-16 ***
waiting      0.075628   0.002219   34.09   <2e-16 ***
---

Signif. codes:  0 ‘***’ 0.001 ‘**’ 0.01 ‘*’ 0.05 ‘.’ 0.1 ‘ ’ 1

Residual standard error: 0.4965 on 270 degrees of freedom
Multiple R-squared:  0.8115,	Adjusted R-squared:  0.8108
F-statistic:  1162 on 1 and 270 DF,  p-value: < 2.2e-16
- p-value = < 2.2e-16
- RSE = 0.4965
- R-squared = 0.8115
따라서 다항 회귀 모델의 성능이 조금 더 뛰어나다.
