📌 독립성 검정(independence test)
두 범주형 변수가 서로 독립인지 검정
독립이라는 것은 두 변수가 서로 관련이 없다는 것을 의미
귀무가설 : 두 변수는 독립이다.
대립가설 : 두 변수는 독립이 아니다.
- Class : 등급 (1등실, 2등실, 3등실, 선원)
- Sex : 성별
- Age : 나이
- Survived : 생존 여부
> str(Titanic)
 'table' num [1:4, 1:2, 1:2, 1:2] 0 0 35 0 0 0 17 0 118 154 ...
 - attr(*, "dimnames")=List of 4
  ..$ Class   : chr [1:4] "1st" "2nd" "3rd" "Crew"
  ..$ Sex     : chr [1:2] "Male" "Female"
  ..$ Age     : chr [1:2] "Child" "Adult"
  ..$ Survived: chr [1:2] "No" "Yes"

> head(Titanic)
, , Age = Child, Survived = No

      Sex
Class  Male Female
  1st     0      0
  2nd     0      0
  3rd    35     17
  Crew    0      0

, , Age = Adult, Survived = No

      Sex
Class  Male Female
  1st   118      4
  2nd   154     13
  3rd   387     89
  Crew  670      3

, , Age = Child, Survived = Yes

      Sex
Class  Male Female
  1st     5      1
  2nd    11     13
  3rd    13     14
  Crew    0      0

, , Age = Adult, Survived = Yes

      Sex
Class  Male Female
  1st    57    140
  2nd    14     80
  3rd    75     76
  Crew  192     20
다차원 테이블
다차원 테이블을 이용해서 독립성 검정을 하기 위해 검정하는 변수로 이루어진 2차원 형태 테이블로 변환하는 과정이 필요하다.
> Titanic.margin <- margin.table(Titanic, c(4, 1))
> Titanic.margin
        Class
Survived 1st 2nd 3rd Crew
     No  122 167 528  673
     Yes 203 118 178  212
열의 비율의 합이 100%가 되도록 만들어준다.
> addmargins(Titanic.margin)
        Class
Survived  1st  2nd  3rd Crew  Sum
     No   122  167  528  673 1490
     Yes  203  118  178  212  711
     Sum  325  285  706  885 2201
> prop.table(addmargins(Titanic.margin, 2), 2)
        Class
Survived       1st       2nd       3rd      Crew       Sum
     No  0.3753846 0.5859649 0.7478754 0.7604520 0.6769650
     Yes 0.6246154 0.4140351 0.2521246 0.2395480 0.3230350

> # 열의 합이 100% 라는 것을 보여줌
> addmargins(prop.table(addmargins(Titanic.margin, 2), 2), 1)
        Class
Survived       1st       2nd       3rd      Crew       Sum
     No  0.3753846 0.5859649 0.7478754 0.7604520 0.6769650
     Yes 0.6246154 0.4140351 0.2521246 0.2395480 0.3230350
     Sum 1.0000000 1.0000000 1.0000000 1.0000000 1.0000000
승객 구분에 따라 생존율에 차이가 있는지 검정해보자.
> chisq.test(Titanic.margin)

	Pearson's Chi-squared test

data:  Titanic.margin
X-squared = 190.4, df = 3, p-value < 2.2e-16
귀무가설을 기각한다. 승객 구분에 따라 생존율에 차이가 있다.
만약 귀무가설을 기각하게 된다면 이들 간의 관련성을 평가할 수 있다.
> library(vcd)
> assocstats(Titanic.margin)
                   X^2 df P(> X^2)
Likelihood Ratio 180.9  3        0
Pearson          190.4  3        0

Phi-Coefficient   : NA
Contingency Coeff.: 0.282
Cramer's V        : 0.294
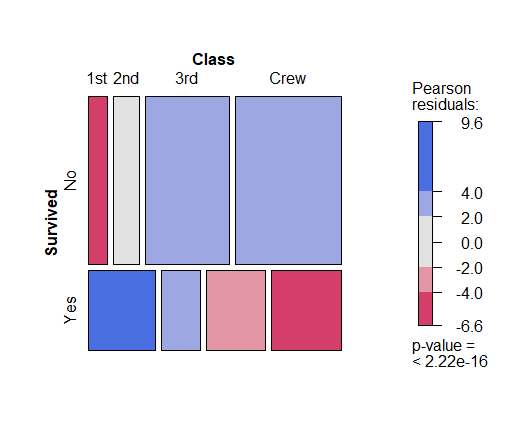
📊 모자이크 도표
shade=TRUE : 귀무가설을 기각하는 데에 있어서 누가 더 큰 기여를 하는 지 색상으로 구분해볼 수 있다.
> mosaic(Titanic.margin, shade=TRUE)
빨간색, 파란색 셀은 귀무가설을 기각하는데 크게 기여한다.
DataFrame
데이터프레임 형태의 데이터셋에서의 독립성 검정
- Sex : 성별
- Fold : 팔짱을 꼈을 때 어느 손이 위에 위치하는지
> str(survey)
'data.frame':	237 obs. of  12 variables:
 $ Sex   : Factor w/ 2 levels "Female","Male": 1 2 2 2 2 1 2 1 2 2 ...
 $ Wr.Hnd: num  18.5 19.5 18 18.8 20 18 17.7 17 20 18.5 ...
 $ NW.Hnd: num  18 20.5 13.3 18.9 20 17.7 17.7 17.3 19.5 18.5 ...
 $ W.Hnd : Factor w/ 2 levels "Left","Right": 2 1 2 2 2 2 2 2 2 2 ...
 $ Fold  : Factor w/ 3 levels "L on R","Neither",..: 3 3 1 3 2 1 1 3 3 3 ...
 $ Pulse : int  92 104 87 NA 35 64 83 74 72 90 ...
 $ Clap  : Factor w/ 3 levels "Left","Neither",..: 1 1 2 2 3 3 3 3 3 3 ...
 $ Exer  : Factor w/ 3 levels "Freq","None",..: 3 2 2 2 3 3 1 1 3 3 ...
 $ Smoke : Factor w/ 4 levels "Heavy","Never",..: 2 4 3 2 2 2 2 2 2 2 ...
 $ Height: num  173 178 NA 160 165 ...
 $ M.I   : Factor w/ 2 levels "Imperial","Metric": 2 1 NA 2 2 1 1 2 2 2 ...
 $ Age   : num  18.2 17.6 16.9 20.3 23.7 ...
두 변수를 이용해 성별에 따라 팔짱을 꼈을 때 손 위치에 차이가 있는지 검정한다.
> chisq.test(survey$Fold, survey$Sex)

	Pearson's Chi-squared test

data:  survey$Fold and survey$Sex
X-squared = 2.5741, df = 2, p-value = 0.2761
귀무가설을 기각하지 못 한다. 손 위치와 성별 간에 관련성이 없다.
