1. 중복값 확인
dataframe.duplicated() 함수를 사용한다.
파라미터:
subset = 중복확인 조건컬럼 선택
keep : 'first', or 'last'
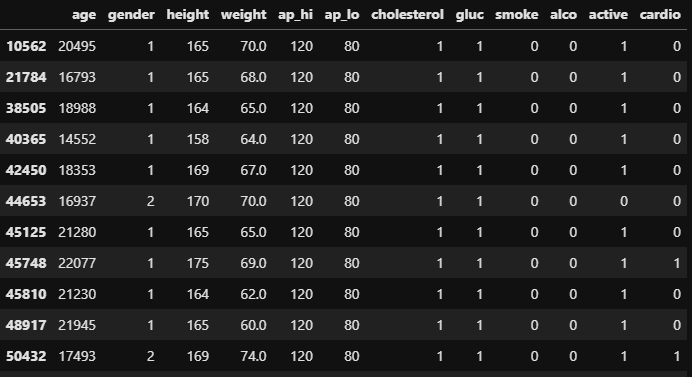
df[df.duplicated()]
📌중복값 제거
df.drop_duplicates(subset=[col_list] or None, keep='first' or 'last')2. Logistic Regression
캐글의 cardiovascular-disease dataset 을 사용함
2-1. 이상치 제거
# 이상치 삭제 함수 정의
def del_outliers(df, col):
    Q1 = df[col].quantile(.25)
    Q3 = df[col].quantile(.75)
    iqr = (Q3 - Q1)
    outlier_limit = iqr * 1.5
    outliers_col = df[(df[col] < Q1 - outlier_limit) | (df[col] > Q3 + outlier_limit)].index
    df = df.drop(outliers_col, axis=0)
    return df
IQR = Q3 - Q1
최대제한선 : Q3 + IQR X 1.5
최소제한선 : Q1 - IQR X 1.5❗ 분석을 위한 컬럼 추가는 따로 기록안함
2-2. 파이프라인을 사용해 데이터 누수를 방지하고, 스케일링을 진행한 후 리그레션을 진행
Target = cardiofrom sklearn.preprocessing import MinMaxScaler, StandardScaler from sklearn.linear_model import LogisticRegression from sklearn.pipeline import make_pipeline # C값 리스트 Cs = [0.001, 0.005, 0.01, 0.05, 0.1, 0.5, 1, 5, 10, 20, 50, 100] # feature, label 나누기 feature = df_cp.drop('cardio', axis=1) label = df_cp['cardio'] # OneHotEncoding 진행 가변수화 된 Gender의 첫번째 컬럼 drop feature = pd.get_dummies(feature, drop_first=True) # Train, test 데이터 나누기 X_train, X_test, y_train, y_test = train_test_split(feature, label, train_size=0.75, random_state=2) # Train validation 데이터 나누기 X_train, X_val, y_train, y_val = train_test_split(X_train, y_train, train_size=0.8, random_state=2) # 최적의 C값 검증데이터로 확인하여 찾아보기 for c in Cs: # 표준화 -> 정규화 -> 로지스틱 회귀 진행 pipe = make_pipeline(StandardScaler(), MinMaxScaler(), LogisticRegression(C=c, max_iter=1000, solver='liblinear', n_jobs=-1)) pipe.fit(X_train, y_train) acc = pipe.score(X_val, y_val) print("C : ", c) print("acc : ", acc) # # # out: # C : 0.001 # acc : 0.6897140418267179 # C : 0.005 # acc : 0.7125480153649167 # C : 0.01 # acc : 0.7193768672641913 # C : 0.05 # acc : 0.7247119078104993 # C : 0.1 # acc : 0.7240717029449424 # C : 0.5 # acc : 0.7228979940247546 # C : 1 # acc : 0.7231113956466069 # C : 5 # acc : 0.7228979940247546 # C : 10 # acc : 0.7227912932138284 # C : 20 # acc : 0.7228979940247546 # C : 50 # acc : 0.7226845924029023 # C : 100 # acc : 0.7226845924029023pipe = make_pipeline(MinMaxScaler(), LogisticRegression(C=50, max_iter=1000, solver='liblinear', n_jobs=-1)) pipe.fit(X_train, y_train) acc = pipe.score(X_test, y_test) print("acc : ", acc) # # out: # acc : 0.7226169899494272-3. RidgeCV를 사용한 최적의 C값 찾기
from sklean.linear_model import RidgeCV

# C값 리스트
Cs = [0.001, 0.005, 0.01, 0.05, 0.1, 0.5, 1, 5, 10, 20, 50, 100]

logregcv = LogisticRegressionCV(Cs=Cs, max_iter=1000, solver='liblinear', n_jobs=-1)

# 데이터의 학습
y_pred = logregcv.fit(X_train, y_train).predict(X_test)

accuracy = accuracy_score(y_test, y_pred)

print('C : ', logregcv.C_)
print("정확도 : ", accuracy)

#
# out:
# C :  [50.]
# 정확도 :  0.7216567441264964
3. 회귀계수 시각화
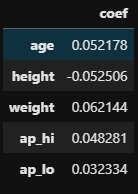
# Feature별 계수 확인
coef = logregcv.coef_
cols = feature.columns
coef_df = pd.DataFrame(index=cols, data=coef[0])
coef_df.columns = ['coef']
coef_df.head()
# 계수의 영향 확인
import seaborn as sns
import matplotlib.pyplot as plt
%matplotlib inline

coef_df = coef_df.sort_values(by='coef', ascending=False)
plt.figure(figsize=(12, 8))

sns.barplot(x=coef_df.coef, y=coef_df.index, palette='deep')
plt.yticks(fontsize=12)
plt.show()
ETC (Scaler)
- StandardScaler
척도간의 스케일을 비슷하게 해주기 위해서 사용함, 모집단이 정규분포를 따르는 경우 많이 씀 - MinMaxScaler
범위가 0 ~ 1, 음수가 있을 경우 -1 ~ 1 사이의 값으로 범위 축소를 하기위해 씀, 특이치에 영향을 크게 받음 - RobustScaler
이상치가 포함되어 있는 데이터를 써야하는 경우 많이 쓰는데 (-3~3) 사이의 값으로 스케일링 해줌


