
중고차 가격 예측 데이터
kaggle Used Cars Price Prediction
1. import package
import pandas as pd
import numpy as np
from sklearn.linear_model import LinearRegression, Ridge
from sklearn.tree import DecisionTreeRegressor
from sklearn.ensemble import RandomForestRegressor
from sklearn.model_selection import train_test_split, cross_val_score, KFold
from sklearn.metrics import mean_squared_error, r2_score
from sklearn.preprocessing import StandardScaler
from sklearn.impute import SimpleImputer
from sklearn.pipeline import Pipeline, make_pipeline
from eli5.sklearn import PermutationImportance
import eli5
from category_encoders import OneHotEncoder, OrdinalEncoder
import seaborn as sns
import matplotlib.pyplot as plt
import warnings
warnings.filterwarnings('ignore')
%matplotlib inline
2. read data
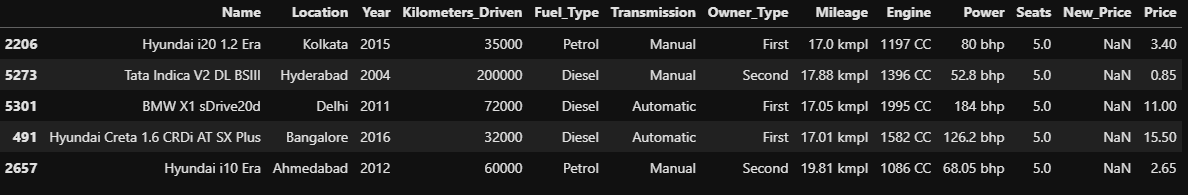
train = pd.read_csv('train-data.csv', index_col=0)
test = pd.read_csv('test-data.csv', index_col=0)
train.head()
2-1. train, validation data split
train, val = train_test_split(train, test_size=0.15, random_state=2)
train.shape, val.shape

#
# ((5116, 13), (903, 13))
3. EDA data
train.head()
3-1. check Data type
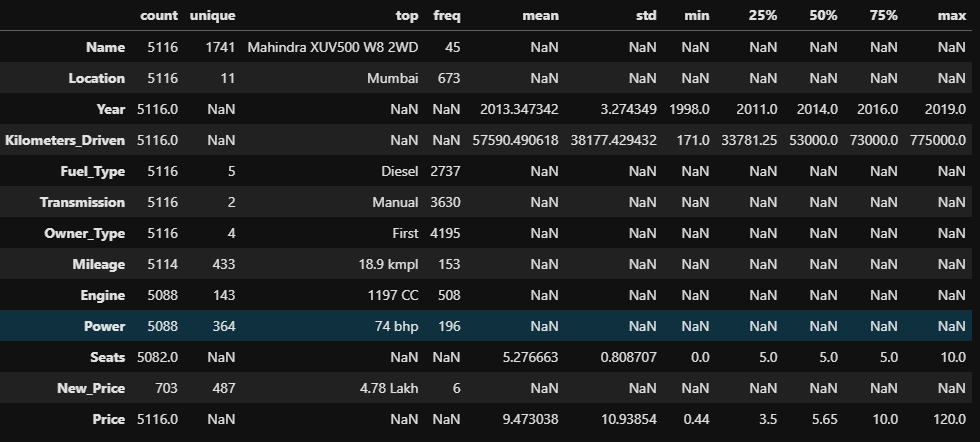
train.dtypes

#
#
# Name                  object
# Location              object
# Year                   int64
# Kilometers_Driven      int64
# Fuel_Type             object
# Transmission          object
# Owner_Type            object
# Mileage               object
# Engine                object
# Power                 object
# Seats                float64
# New_Price             object
# Price                float64
# dtype: object
3-2. check data describe
train.describe(include='all').T
3-3. check NaN
train.isna().sum()

#
# Location               0
# Year                   0
# Kilometers_Driven      0
# Fuel_Type              0
# Transmission           0
# Owner_Type             0
# Mileage                0
# Engine                28
# Power                113
# Seats                  0
# Price                  0
# dtype: int64
4. feature engineering
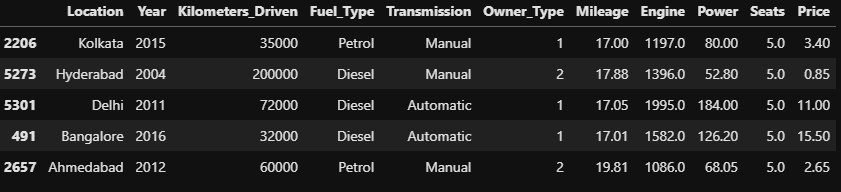
def engineering(df):
    # ignore copy warning
    temp_df = df.copy()
    # Mileage convert km/kg -> kmpl
    try:
        temp_df = temp_df.dropna(subset=['Mileage'])
    except:
        pass
    temp_df['Mileage'] = temp_df['Mileage'].apply(lambda x : x.split(' ')[0])
    temp_df['Mileage'] = temp_df['Mileage'].astype(float)

    # Owner_Type transform Ordinal variable
    filter_map = {'First' : 1, 'Second' : 2, 'Third' : 3, 'Fourth & Above' : 4}
    temp_df['Owner_Type'] = temp_df['Owner_Type'].replace(filter_map).astype(int)

    # Engine delete CC & Power delete bhp and transform type
    temp_df['Engine'] = temp_df['Engine'].apply(lambda x : x.split(' ')[0] if type(x) != float else np.nan)
    temp_df['Engine'] = temp_df['Engine'].astype(float)

    temp_df['Power'] = temp_df['Power'].apply(lambda x : x.split(' ')[0] if type(x) != float and 'null' not in x else np.nan)
    temp_df['Power'] = temp_df['Power'].astype(float)

    # fill nan to typical number of seats in a car
    temp_df['Seats'] = df.Seats.fillna(4)

    # drop New_Price, Name(high cardinality)
    temp_df.drop(['New_Price', 'Name'], axis=1, inplace=True)

    return temp_df

train = engineering(train)
val = engineering(val)
test = engineering(test)
4-1. check data
train.head()
4-2. check label distribution
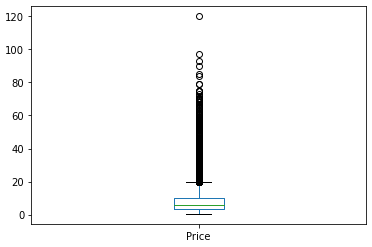
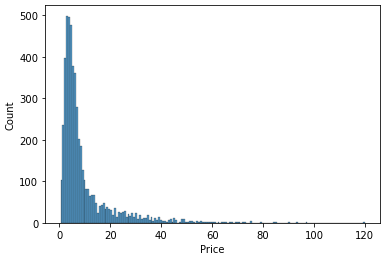
train.Price.describe() # # count 5114.000000 # mean 9.471707 # std 10.940472 # min 0.440000 # 25% 3.500000 # 50% 5.650000 # 75% 10.000000 # max 120.000000 # Name: Price, dtype: float64train.Price.plot.box();
sns.histplot(train.Price);
4-3. drop label outlier
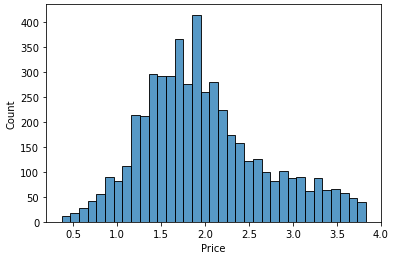
# get outlier index
def get_outlier(df, col):
    outlier_idx = df.loc[df[col] > np.percentile(df[col], 98)].index
    return outlier_idx

# taget log transform
def log_transform(df, col):
    df[col] = df[col].apply(lambda x : np.log1p(x))
    return df
# inverse target
def inverse_target(data):
    return np.expm1(data)
# drop outlier
idx = get_outlier(train, target)
idx
train.drop(idx, axis=0, inplace=True)
idx = get_outlier(val, target)
val.drop(idx, axis=0, inplace=True)

# log transform
train = log_transform(train, target)
val = log_transform(val, target)

# check distribution
sns.histplot(train.Price);
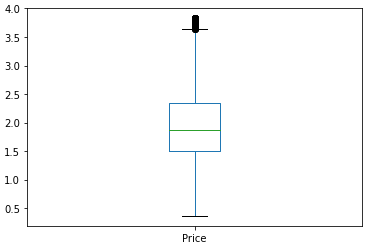
train.Price.plot.box();
5. split feature, target
X_train = train.drop(target, axis=1)
y_train = train[target]
X_val = val.drop(target, axis=1)
y_val = val[target]
X_test = test.copy()
6. cross validation
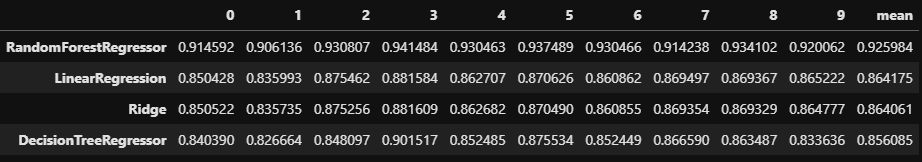
linreg = LinearRegression()
ridge = Ridge()
dtreg = DecisionTreeRegressor()
rtreg = RandomForestRegressor()


scores = {}
models = [linreg, ridge, dtreg, rtreg]
model_names = ['LinearRegression', 'Ridge', 'DecisionTreeRegressor', 'RandomForestRegressor']
for idx, model in enumerate(models):
    if idx <= 1:
        pipe = make_pipeline(OneHotEncoder(use_cat_names=True),
                             SimpleImputer(),
                             StandardScaler(),
                             model)
        pipe.fit(X_train, y_train)
        acc = cross_val_score(pipe, X_train, y_train, scoring='r2', cv=10)
        scores[model_names[idx]] = acc
    if idx > 1:
        pipe = make_pipeline(OrdinalEncoder(),
                             SimpleImputer(),
                             model)
        pipe.fit(X_train, y_train)
        acc = cross_val_score(pipe, X_train, y_train, scoring='r2', cv=10)
        scores[model_names[idx]] = acc
results = pd.DataFrame(scores).T
results
6-1. check models score
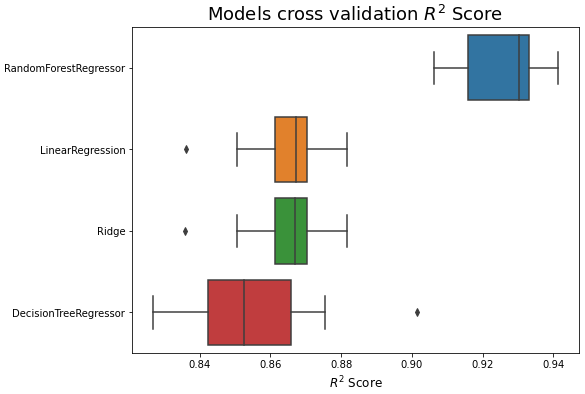
results['mean'] = results.mean(axis=1)
result_df = results.sort_values(by='mean', ascending=False)
result_df
result_df.drop('mean', axis=1, inplace=True)

plt.figure(figsize=(8, 6))
sns.boxplot(data=result_df.T, orient='h')
plt.title('Models cross validation $R^2$ Score', fontsize=18)
plt.xlabel('$R^2$ Score', fontsize=12)
plt.show()
6-2. predict validation data and check score
pipe = make_pipeline(OrdinalEncoder(),
                     SimpleImputer(),
                     RandomForestRegressor())
pipe.fit(X_train, y_train)
y_pred_val = pipe.predict(X_val)
print('validation r2 score : {}'.format(r2_score(y_val, y_pred_val)))

#
# validation r2 score : 0.9116601151239483

7. Feature importance
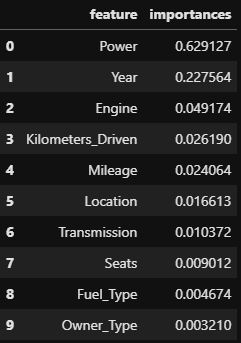
importance = pipe[2].feature_importances_
feature = X_train.columns

importances = pd.DataFrame()
importances['feature'] = feature
importances['importances'] = importance
importances.sort_values('importances', ascending=False, inplace=True)

importances.reset_index(drop=True, inplace=True)
importances
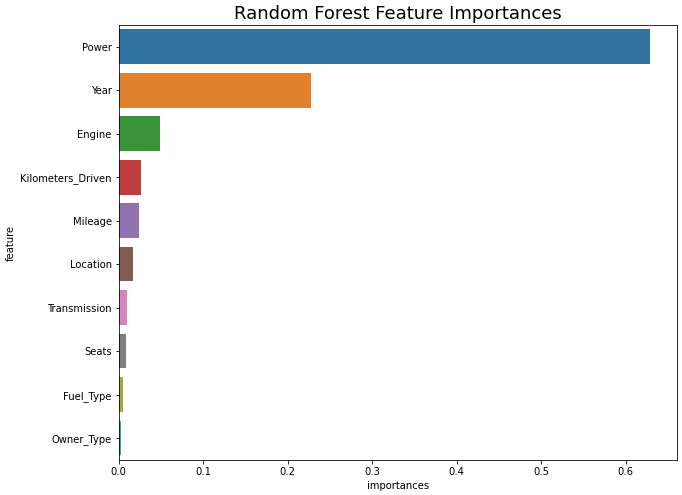
plt.figure(figsize=(10, 8))
sns.barplot(x='importances', y='feature', data=importances)
plt.title('Random Forest Feature Importances', fontsize=18)
plt.show()
7-1. Permutaion Importance
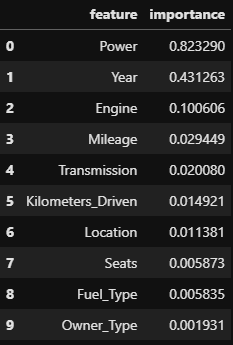
# Permutation Importance
pipe2 = make_pipeline(OrdinalEncoder(),
                      SimpleImputer())

X_train_t = pipe2.fit_transform(X_train)
X_val_t = pipe2.transform(X_val)

rf = RandomForestRegressor().fit(X_train_t, y_train)
perm_imp = PermutationImportance(rf, scoring='r2', random_state=2)
perm_imp.fit(X_val_t, y_val)

perm_imp_df = pd.DataFrame()
perm_imp_df["feature"] = feature
perm_imp_df["importance"] = perm_imp.feature_importances_
perm_imp_df.sort_values(by='importance', ascending=False, inplace=True)
perm_imp_df.reset_index(drop=True, inplace=True)
perm_imp_df
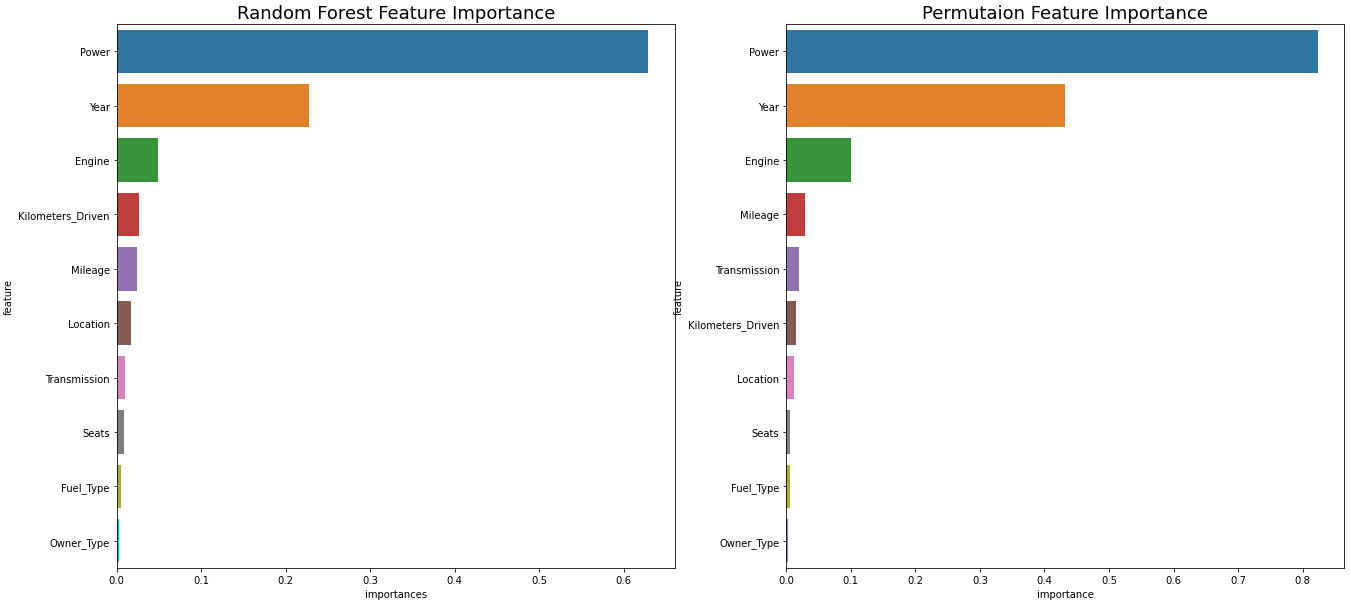
7-2. Radom Forest Feature Importance vs Permutaion Feature Importance
fig, axes = plt.subplots(1, 2, figsize=(22, 10))
plt.rcParams.update({'font.size':10})
sns.barplot(x='importances', y='feature', data=importances, ax=axes[0])
axes[0].set_title('Random Forest Feature Importance', fontsize=18)

sns.barplot(x='importance', y='feature', data=perm_imp_df, ax=axes[1])
axes[1].set_title('Permutaion Feature Importance', fontsize=18)

plt.show()

3개의 댓글

Yes, I also did not have the necessary amount of money to buy a new car. And so I decided to buy a used car in the driveaxis service. These guys advised me to choose a 2018 German BMW and I was not disappointed at all. In the service, I was able to get a loan to buy a car with a low interest rate, and such a loan does not bother me at all, because thanks to a personal car, I can solve my work matters much faster and more productively.

I can say that the situation with the used car prices has changed a lot, and nowadays, it's not a problem to find an affordable offer. But it's important to remember about the car bill of sale in order to avoid problems with the car in the future, even if you're buying a used car, and for me, georgia bill of sale pdf turned out to be actually helpful.
I would like to buy myself a used car at a good price.