
특성 중요도
sklearn의 tree 기반 분류기에서 default로 사용되는 특성중요도는 속도는 빠르지만 결과를 주의해야 한다. 각각 특성을 모든 트리에 대해 평균불순도감소(mean decrease impurity)를 계산한 값이다.
불순도 감소(impurity decrease)
(impurity - right_impurity
left_impurity)
: 전체 관측치 수, : 현재 노드 t에 존재하는 관측치 수
, : 노드 t 왼쪽(L)/오른쪽(R) 자식노드에 존재하는 관측치 수
만약 sample_weight가 주어진다면, , , , 는 가중합을 함.
예제 코드
kaggle의 Used car price data set
필요한 패키지 import
import pandas as pd
import numpy as np
from sklearn.ensemble import RandomForestRegressor
from sklearn.pipeline import Pipeline, make_pipeline
from category_encoders import OrdinalEncoder
from sklearn.impute import SimpleImputer
import eli5
from eli5.sklearn import PermutationImportance
import seaborn as sns
import matplotlib.pyplot as plt
import warnings
warnings.filterwarnings('ignore')
%matplotlib inline
feature engineering 함수
def engineering(df):
    temp_df = df.copy()
    # Mileage convert km/kg -> kmpl
    try:
        temp_df = temp_df.dropna(subset=['Mileage'])
    except:
        pass
    temp_df['Mileage'] = temp_df['Mileage'].apply(lambda x : x.split(' ')[0])
    temp_df['Mileage'] = temp_df['Mileage'].astype(float)

    # Owner_Type Rank type으로 변환
    filter_map = {'First' : 1, 'Second' : 2, 'Third' : 3, 'Fourth & Above' : 4}
    temp_df['Owner_Type'] = temp_df['Owner_Type'].replace(filter_map).astype(int)

    # Engine drop CC & Power drop bhp
    temp_df['Engine'] = temp_df['Engine'].apply(lambda x : x.split(' ')[0] if type(x) != float else np.nan)
    temp_df['Engine'] = temp_df['Engine'].astype(float)

    temp_df['Power'] = temp_df['Power'].apply(lambda x : x.split(' ')[0] if type(x) != float and 'null' not in x else np.nan)
    temp_df['Power'] = temp_df['Power'].astype(float)

    # 평균적인 자동차의 시트수로 채우기
    temp_df['Seats'] = df.Seats.fillna(4)

    # drop New_Price, Name
    temp_df.drop(['New_Price'], axis=1, inplace=True)


    return temp_df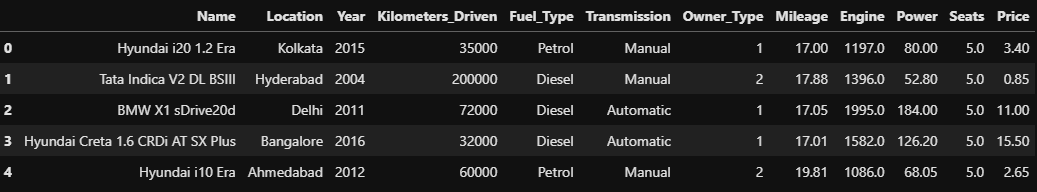
추가로 Name 특성의 범주가 1700개 이상이기 때문에 필요한 정보만 추출해서 새로운 특성을 만들어 주었다.
# 추가 컬럼 만들기
def make_new_feature(df):
    # 브랜드 컬럼 추가
    df['brand'] = df.Name.str.extract('([A-Za-z]+)')
    # 문자에 대문자인 경우도 있고, 소문자인 경우도 있어서 하나로 통일
    df['brand'] = df['brand'].str.upper()

    # Name에서 모델명 추출
    df['model'] = df.Name.str.extract('( [\S\d]+)')
    # 문자에 대문자인 경우도 있고, 소문자인 경우도 있어서 하나로 통일
    df['model'] = df['model'].str.upper()

    # Name 컬럼 삭제
    df.drop('Name', axis=1, inplace=True)

    return df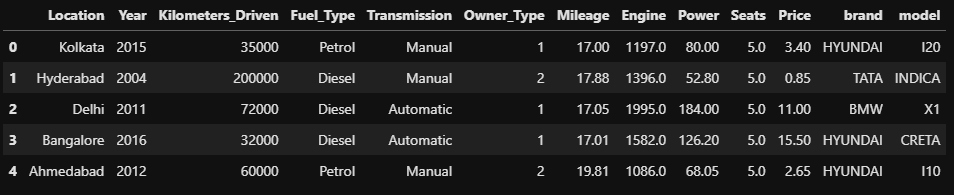
# 특성, 타겟 분류
X_train = train.drop(my_target, axis=1)
y_train = train[my_target]
X_val = val.drop(my_target, axis=1)
y_val = val[my_target]
X_test = test

# 파이프라인 만들기
pipe = make_pipeline(OrdinalEncoder(),
                     SimpleImputer(),
                     RandomForestRegressor())
pipe.fit(X_train, y_train)

# 특성 중요도 데이터 프레임 생성
importance = pipe[2].feature_importances_
feature = X_train.columns
importances = pd.DataFrame()
importances['feature'] = feature
importances['importances'] = importance
importances.sort_values('importances', ascending=False, inplace=True)
importances.reset_index(drop=True, inplace=True)
importances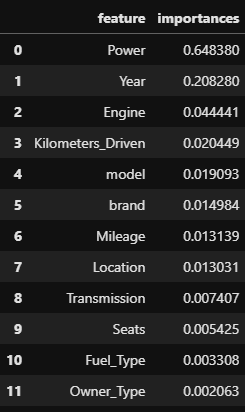
# 특성 중요도 시각화
plt.figure(figsize=(10, 8))
sns.barplot(x='importances', y='feature', data=importances)
plt.title('Random Forest Feature Importances', fontsize=18)
plt.show()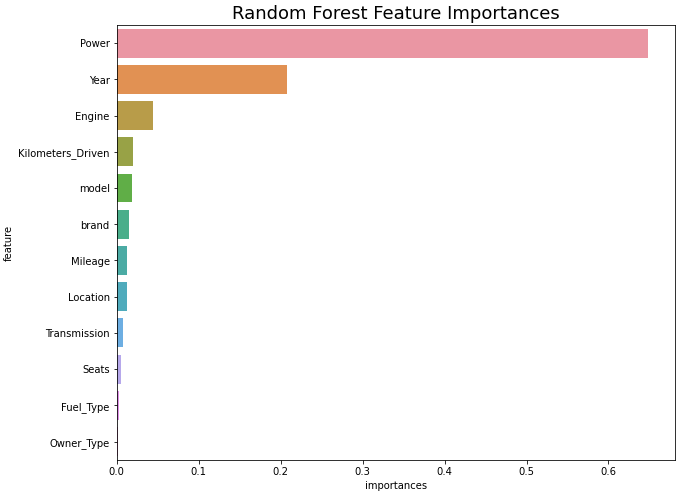
결과값은 모든 중요도의 합이 1이 되는 값이다.
위의 그래프를 보게되면 Power 특성열이 상당히 높은 부분을 차지하고 있는 것을 볼 수 있다. 그만큼 예측에 중요한 특성이라는 것이다.
트리모델의 특성 중요도 산출은 빠르지만 특성 종류에 따라서 부정확한 결과가 나올수도 있다. 그러므로 순열 중요도를 통해서 확인하면 더욱 정확한 계산이 가능하다.
순열 중요도 (Permutation importance)
순열 중요도는 기본 특성 중요도와 Drop-column(하나의 컬럼을 삭제하기 전과 후의 검증 정확도 비교) 중요도 중간에 위치하는 특징을 가진다고 볼 수 있다.
중요도 측정은 관심있는 특성에만 무작위로 노이즈를 주고 예측하였을 때 성능 평가지표가 얼마나 감소하는지를 측정한다.
노이즈를 준다는 것은 기존 정보를 제거하여 특성이 기존에 하던 역할을 하지 못하게 한다는 것이고, 그렇게 된 컬럼을 가지고 성능을 측정한다.
노이즈를 주는 방법은 특성값들을 샘플 내에서 섞는 것(Shuffle, permutaion)이다.
예제 코드
위의 데이터셋을 그대로 사용한다.
# 순서형 인코딩과 결측치 처리
pipe = make_pipeline(OrdinalEncoder(),
                     SimpleImputer())

X_train_t = pipe.fit_transform(X_train)
X_val_t = pipe.transform(X_val)

# 랜덤포레스트 회귀 사용하여 학습
rf = RandomForestRegressor().fit(X_train_t, y_train)
# 결정계수를 평가지표로 선택하여 순열 중요도 확인
perm_imp = PermutationImportance(rf, scoring='r2', random_state=2)
perm_imp.fit(X_val_t, y_val)
# 순열 중요도 데이터 프레임 생성
perm_imp_df = pd.DataFrame()
feature = X_train.columns
perm_imp_df["feature"] = feature
perm_imp_df["importance"] = perm_imp.feature_importances_
perm_imp_df.sort_values(by='importance', ascending=False, inplace=True)
perm_imp_df.reset_index(drop=True, inplace=True)
perm_imp_df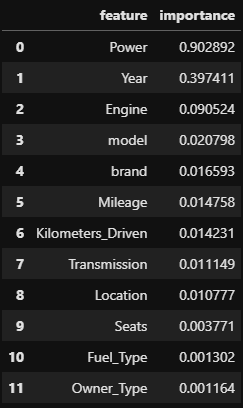
# 순열 중요도 시각화
plt.figure(figsize=(10, 8))

sns.barplot(x='importance', y='feature', data=perm_imp_df)
plt.title('Permutaion Feature Importance (Used Car dataset)', fontsize=18)

plt.show()
# 특성 중요도와 각 특성들의 표준편차 확인
eli5.show_weights(perm_imp, feature_names = list(feature))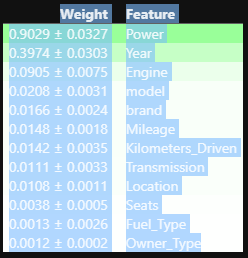
# 안정성이 있는 특성들
X_train.columns[perm_imp.feature_importances_ - perm_imp.feature_importances_std_ > 0]

#
#
# Index(['Location', 'Year', 'Kilometers_Driven', 'Transmission', 'Owner_Type',
#        'Mileage', 'Engine', 'Power', 'Seats', 'brand', 'model'],
#       dtype='object')
랜덤 포레스트와 같이 Power, Year, Engine 특성의 중요도를 보이고 있지만 그보다 적은 중요도를 띈 특성들의 중요도가 변경된 것을 볼 수 있었다.
eli5.show_weights를 사용하여 특성의 중요도와 표준편차를 확인해 볼 수 있다.
특성의 중요도에서 표준편차 값을 빼주었을 때 0이거나 작다면 그 특성은 다른 데이터를 예측했을 때 영향이 없거나 모델의 오차를 늘리게 될 것 이다.
그러므로 제거해주는 것이 모델의 안정성을 높이는 방법일 것이다.