scale이 다른 두 종속변수
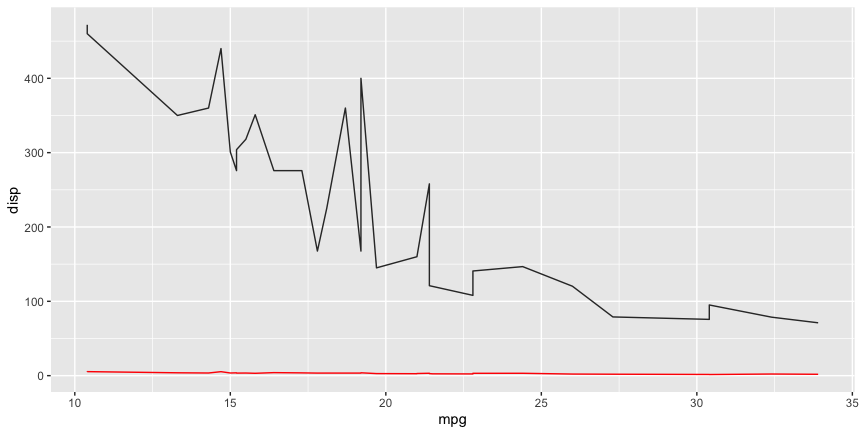
mtcars %>%
  ggplot() +
  geom_line(aes(mpg, disp), color ="grey20") +
  geom_line(aes(mpg, wt), color ="red")
wt value를 secondary axis로 보내기
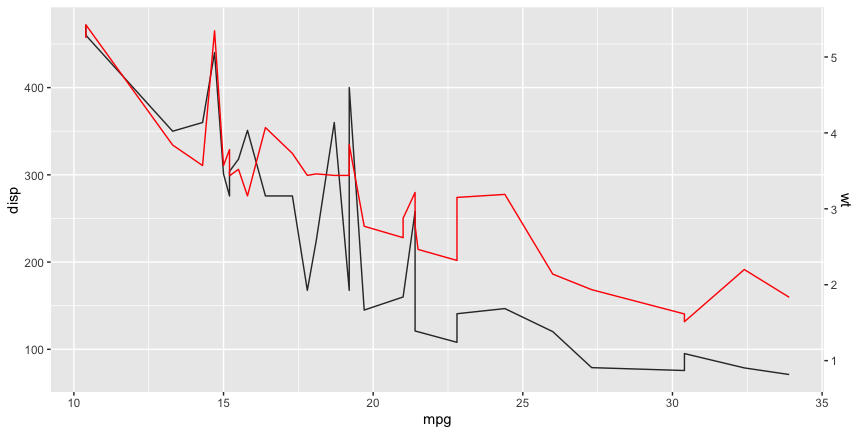
scaleFactor <- max(mtcars$disp, na.rm = T) / max(mtcars$wt, na.rm = T)

mtcars %>%
  ggplot() +
  geom_line(aes(mpg, disp), color ="grey20") +
  geom_line(aes(mpg, wt * scaleFactor), color ="red") +
  scale_y_continuous(
    sec.axis = sec_axis(~./scaleFactor, name="wt")
  )

data scientist