[P] Brayton Cycle
★[학습목표]
Brayton Cycle python code를 이해할 수 있다.
ref) https://thermostate.readthedocs.io/en/stable/air-standard-brayton-cycle-example.html
!pip install thermostate
from thermostate import State, Q_, units
from thermostate.plotting import IdealGas
import numpy as np
%matplotlib inline
import matplotlib.pyplot as plt
substance = "air"
p_1 = Q_(1.0, "bar")
T_1 = Q_(300.0, "K")
T_3 = Q_(1700.0, "K")
p2_p1 = Q_(8.0, "dimensionless")
p_low = Q_(2.0, "dimensionless")
p_high = Q_(50.0, "dimensionless")
st_1 = State(substance, T=T_1, p=p_1)
h_1 = st_1.h.to("kJ/kg")
s_1 = st_1.s.to("kJ/(kg*K)")
s_2 = s_1
p_2 = p_1 * p2_p1
st_2 = State(substance, p=p_2, s=s_2)
h_2 = st_2.h.to("kJ/kg")
T_2 = st_2.T
p_3 = p_2
st_3 = State(substance, p=p_3, T=T_3)
h_3 = st_3.h.to("kJ/kg")
s_3 = st_3.s.to("kJ/(kg*K)")
s_4 = s_3
p_4 = p_1
st_4 = State(substance, p=p_4, s=s_4)
h_4 = st_4.h.to("kJ/kg")
T_4 = st_4.T
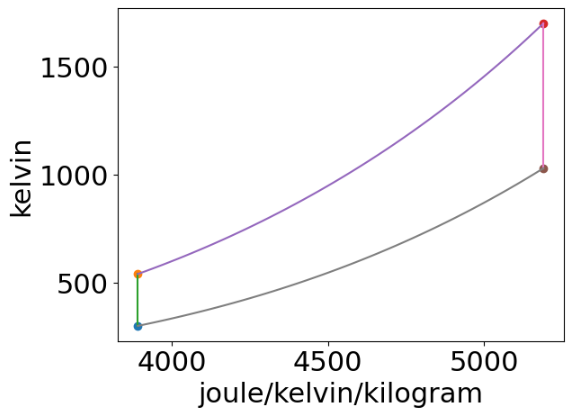
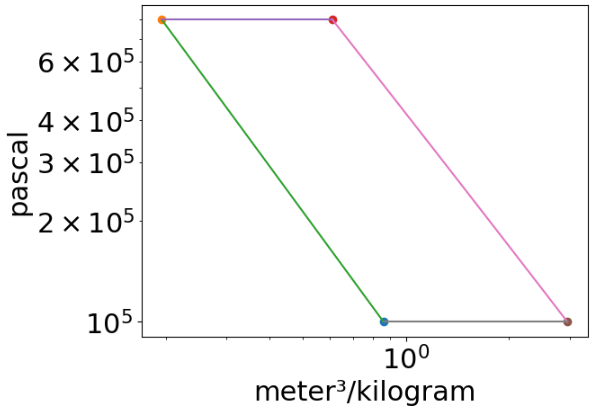
Brayton = IdealGas(substance, ("s", "T"), ("v", "p"))
Brayton.add_process(st_1, st_2, "isentropic")
Brayton.add_process(st_2, st_3, "isobaric")
Brayton.add_process(st_3, st_4, "isentropic")
Brayton.add_process(st_4, st_1, "isobaric")
W_c = h_1 - h_2
W_t = h_3 - h_4
W_net = W_c + W_t
Q_23 = h_3 - h_2
eta = W_net / Q_23
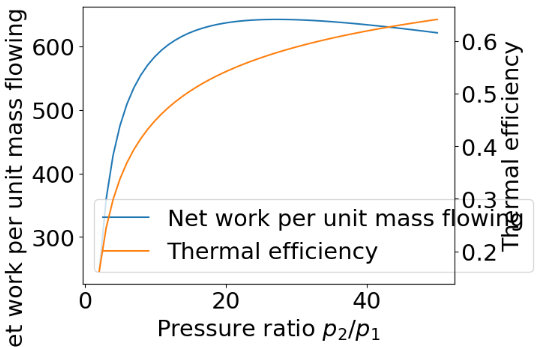
p_range = np.linspace(p_low, p_high, 50)
eta_l = np.zeros(shape=p_range.shape) * units.dimensionless
W_net_l = np.zeros(shape=p_range.shape) * units.kJ / units.kg
for i, p_ratio in enumerate(p_range):
s_2 = s_1
p_2 = p_1 * p_ratio
st_2 = State(substance, p=p_2, s=s_2)
h_2 = st_2.h.to("kJ/kg")
T_2 = st_2.T
p_3 = p_2
st_3 = State(substance, p=p_3, T=T_3)
h_3 = st_3.h.to("kJ/kg")
s_3 = st_3.s.to("kJ/(kg*K)")
s_4 = s_3
p_4 = p_1
st_4 = State(substance, p=p_4, s=s_4)
h_4 = st_4.h.to("kJ/kg")
T_4 = st_4.T
W_c = h_1 - h_2
W_t = h_3 - h_4
W_net = W_c + W_t
W_net_l[i] = W_net
Q_23 = h_3 - h_2
eta = W_net / Q_23
eta_l[i] = eta
fig, work_ax = plt.subplots()
work_ax.plot(p_range, W_net_l, label="Net work per unit mass flowing", color="C0")
eta_ax = work_ax.twinx()
eta_ax.plot(p_range, eta_l, label="Thermal efficiency", color="C1")
work_ax.set_xlabel("Pressure ratio $p_2/p_1$")
work_ax.set_ylabel("Net work per unit mass flowing (kJ/kg)")
eta_ax.set_ylabel("Thermal efficiency")
lines, labels = work_ax.get_legend_handles_labels()
lines2, labels2 = eta_ax.get_legend_handles_labels()
work_ax.legend(lines + lines2, labels + labels2, loc="best");