[ML] Practice Random Forest through python with Iris data in scikit-learn

Random Forest는 머신 러닝 Supervised learning(지도 학습) 알고리즘 중 하나로 데이터를 학습한 모델로 새로운 input data에 대해 예측을 한다.
Random Forest에 대해 알기 위해서는 먼저 Decision Tree(의사결정트리)에 대해 알고 있어야 한다.
Decision Tree?
non-parametric Supervised learning(비모수적 지도 학습) 모델 중 하나로 Classification(분류)과 Regression(회귀)을 모두 할 수 있다.
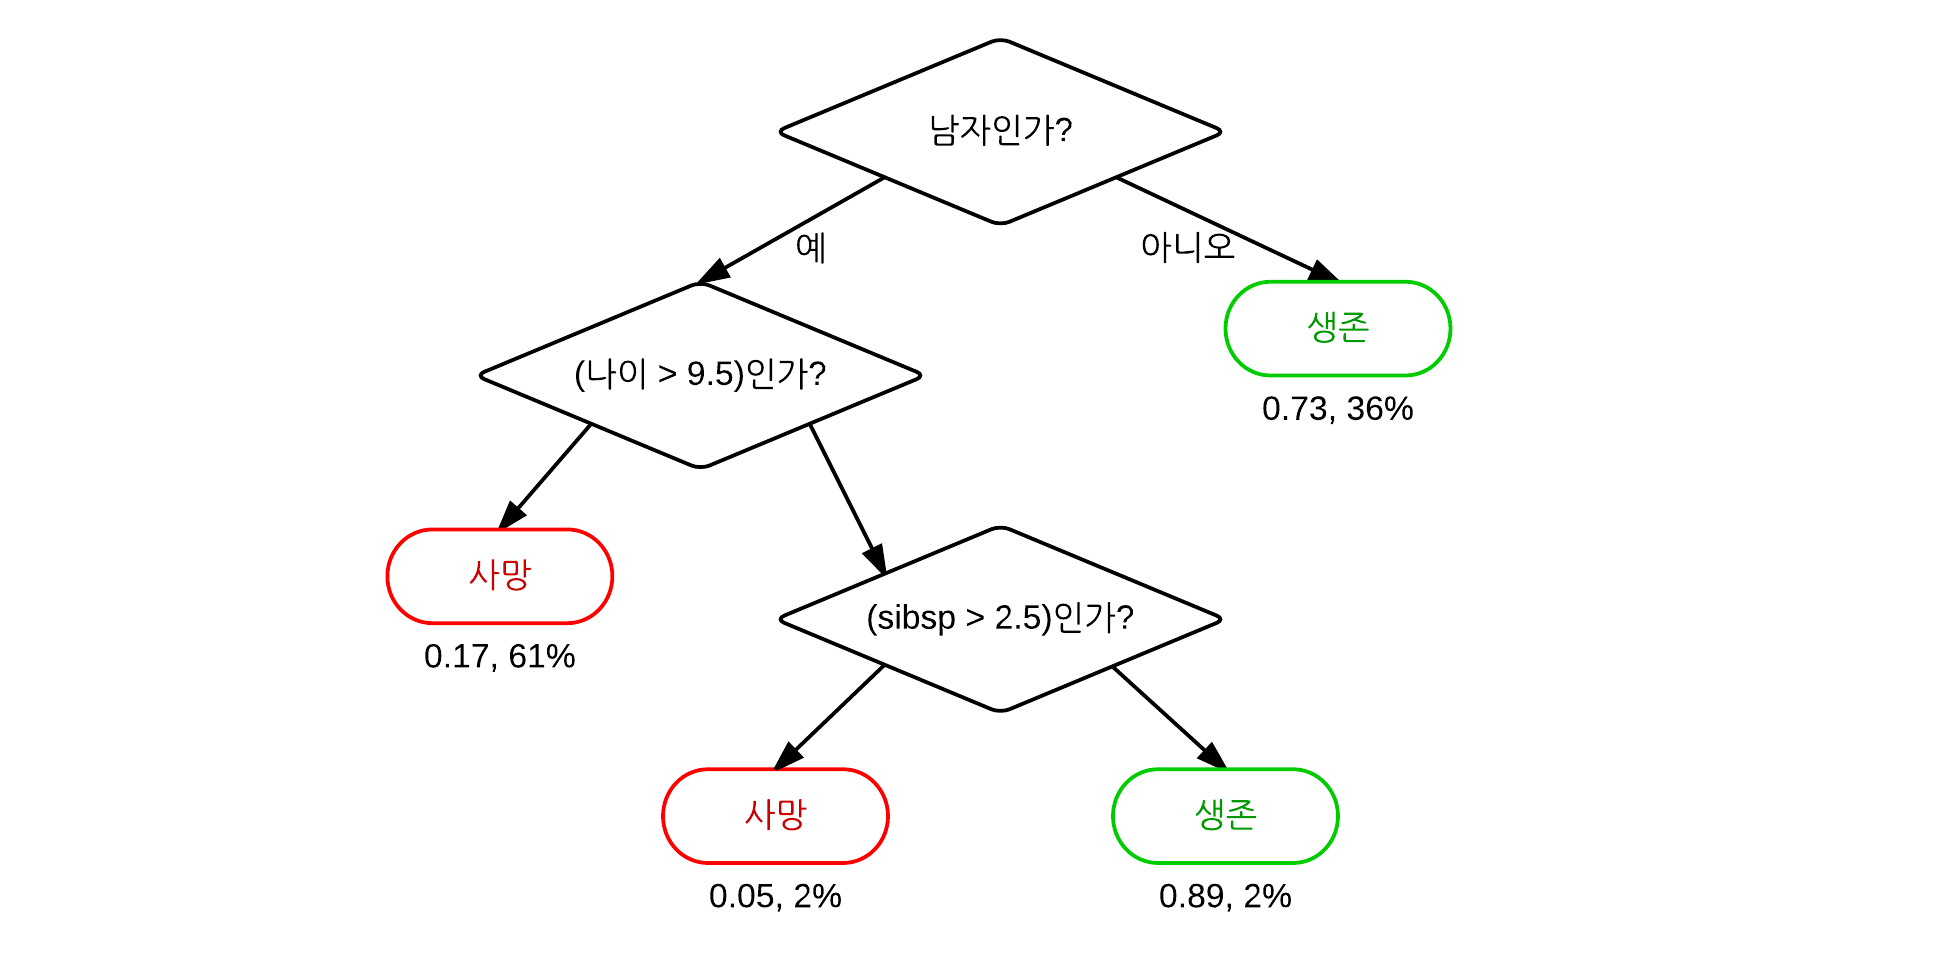
한 단계마다 Decision(결정)을 통해 어떤 방향으로 Tree를 내려갈지 결정하게 되고, Leaf node 도달하면 결과를 얻을 수 있다. 아래 그림을 보면 더 이해하기 쉬울 것이다.

Decision Tree는 규칙을 이해하기 쉽고, 연속형, 범주형 변수 모두 취급 가능하며 outlier에 덜 민감하다는 장점이 있지만 모델을 구축하기 위해 많은 시간이 필요하고 Error가 propagation될 수 있으며 목표 변수의 유형과 트리의 깊이가 예측력에 영향을 많이 준다는 단점도 가지고 있다.
cf. Decision Tree에 대해 더 자세히 알고 싶다면 scikit-learn page에서 설명하고 있는 것을 참고하면 도움이 된다.
이런 문제점들이 개선된 모델이 Random Forest 모델이다.
Random Forest?🌲
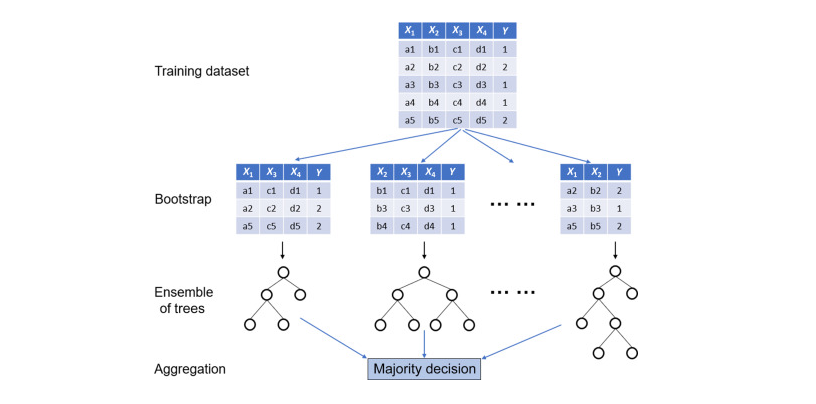
Random Forest는 모델의 분산을 줄이고 정확한 예측을 하기 위해 여러 모델을 만들고 각 모델에서 나온 예측을 vote에 붙여 다수결로 예측값을 결정하는 모델이다. 이런 과정을 Bagging이라고 하는데, Bagging은 Bootstrap AGGregatING를 줄여서 만들어진 단어이다.
cf.Bootstraping: Training Data에서 동일한 크기의 dataset을 중복을 허용해서 Random하게 추출하는 것
이 방법은 Ensemble기법으로 불리는데, 여러 분류 모델에서 얻은 결과를 종합하여 분류의 정확도를 높이는 방법이라서 이다. 이 기법의 아이디어는 여러 weak learner를 합하면 single learner보다 너 나은 성능을 얻을 수 있다는 집단지성에서 나온 것으로 알려져 있다.
아래의 그림을 보면 Random Forest에 대한 이해를 할 수 있을 것이다.

Bootstrap tree들은 전체의 데이터로 만들어진 original tree와는 다른 형태를 띄는데, 그 이유는 물론 dataset도 다르지만 각 트리를 만드는데 사용하는 즉, 학습에 사용되는 feature(분기 조건)에도 변화를 주기 때문이다.
cf. 일반적으로 K개의 feature가 존재하면,√K개의 feature를 선택하고 그 중 가장 information gain이 높은 feature를 사용해 분기를 만드는 과정을 반복한다.
전체 데이터가 아닌 부분 데이터로 모델을 만들어 예측을 하기 때문에 overfitting 문제를 완화할 수 있고 어떤 특정 tree에서 error가 있는 모델이 생성되어도 결과를 voting system으로 결정하기 때문에 error의 영향을 decision tree보다 적게 받아 error propagation을 극복할 수 있다.
간단하면서 강력한 scikit-learn을 사용하면 누구나 쉽게 Random Forest를 구현해 볼 수 있다.
scikit-learn에서는 많은 dataset을 제공하는데, 이번에는 많이 알려진 Iris dataset을 사용한다.
1. Iris dataset
from sklearn.datasets import load_iris

iris = load_iris()
print(iris.target_names)
print(iris.feature_names)
print(len(iris.data))
print(iris.data[:5])
print(iris.target)
Iris data information
- feature(분류 기준): 꽃받침(sepal) 길이, 꽃받침 넓이, 꽃잎(petal) 길이, 꽃잎 넓이
- targets(분류되는 결과): setosa=0, versicolor=1, virginica=2
- 총 150개 데이터
import pandas as pd

table = pd.DataFrame({
    'sepal length':iris.data[:,0],
    'sepal width':iris.data[:,1],
    'petal length':iris.data[:,2],
    'petal width':iris.data[:,3],
    'species':iris.target
})
table.head()
2. Implement Random Forest
scikit learn 공식 페이지에 가면 많은 예제와 코드를 접할 수 있기 때문에 가장 기본적인 사용법만 소개하려고 한다.
🐣 Simple Random Forest Implementation
- Import packages and modules
from sklearn import datasets
from sklearn.ensemble import RandomForestClassifier
sklearn.datasets은 많은 sample dataset을 쉽게 load해서 사용할 수 있도록 도와주는 패키지이다.
- Create RandomForest Classifier model
iris = datasets.load_iris()
x = iris.data
y = iris.target

rfc = RandomForestClassifier(criterion = 'entropy', #default='gini'
			     n_estimators = 8, #number of trees
                             n_jobs = -1) #number of processors to run in parallel('-1' means 'using all')
model = rfc.fit(x,y)- Predict the species of iris with RF model
sample_inputs = [[5,4,3,2],[1,3,2,5]]
model.predict(sample_inputs) #return array([[1],[2]])
🐓 Advances RF model
- Import packages and modules
from sklearn import datasets,metrics
from sklearn.ensemble import RandomForestClassifier
from sklearn.model_selection import train_test_split
import pandas as pd
import matplotlib.pyplot as plt
import seaborn as sns
pandas는 데이터의 분석과 가공하는 것을 도와주는 패키지로 자료구조와 처리 함수들을 제공한다.
matplotlib는 간단히 시각화할 수 있도록 도와주는 라이브러리이고, seaborn은 matplotlib를 기반으로 색상이나 통계 차트와 같은 시각화 기능이 추가된 패키지이다.
학습을 하기 위해서 주어진 모든 데이터를 사용하지 않고 70% 정도의 데이터(training data)로 모델을 만들고 나머지 30% 정도의 데이터(test data)로 만들어진 모델의 예측 정확도를 검사한다.
모델의 예측 정확도는 sklearn.metrics 패키지의 accuracy_score 모듈을 통해 검사할 수 있다.
하드코딩을 통해 직접 training data와 test data를 나눌 수도 있지만 sklearn의 model_slection 패키지에 있는 train_test_split모듈을 사용하면 쉽게 데이터를 나눌 수 있다.
하드코딩을 사용하면 train data와 test data를 아래 코드처럼 나눌 수 있지만 권장하진 않는다.
iris = datasets.load_iris()

x_train_data = iris.data[:-30]
y_train_data = iris.target[:-30]

x_test_data = iris.data[-30:]
y_test_data = iris.target[-30:]
다음의 방법을 권장한다.
iris = datasets.load_iris()

x = iris.data
y = iris.target

# 70% for training data, 30% for testing data
x_train,x_test,y_train,y_test = train_test_split(x,y,test_size=0.3)- Create and Train the RF model
rfc = RandomForestClassifier(criterion = 'entropy', n_estimators = 8, n_jobs = -1)
model = rfc.fit(x_train,y_train)- Predict and Calculate the accuracy of the model
# Calculate the accuracy score with test data
y_pred = model.predict(x_test)
print("Accuracy score:",metrics.accuracy_score(y_test, y_pred))
print(metrics.classification_report(y_test, y_pred, target_names=iris.target_names))

# predict with the sample data
sample_inputs = [[3,5,4,2],[2,3,4,5]]
sample_outputs = model.predict(sample_inputs).tolist()
for o in sample_outputs:
print(iris.target_names[o],end=' ')- Feature Control
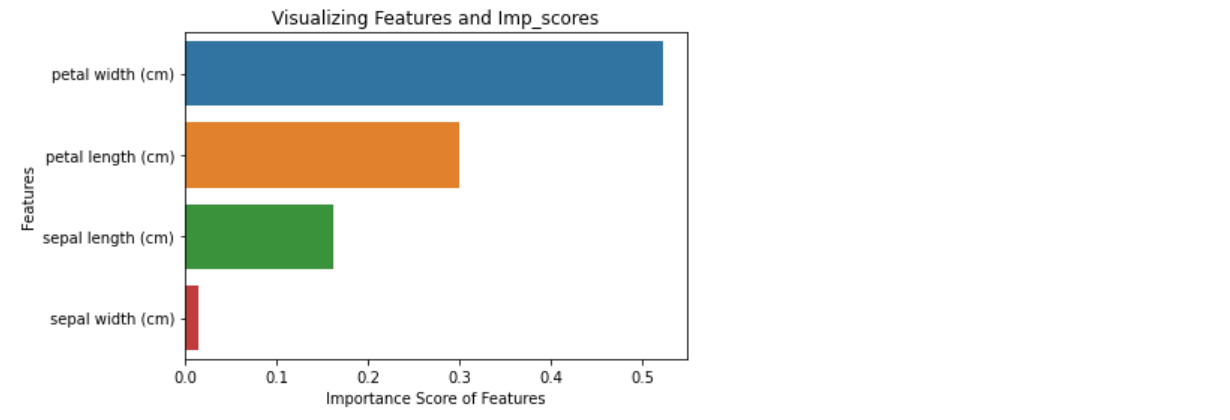
- 중요한 feature 찾기
#Calculate feature importance in descending order
ft_importances = pd.Series(model.feature_importances_,index=iris.feature_names).sort_values(ascending=False)

# Generate a bar plot
sns.barplot(x=ft_importances, y=ft_importances.index)

# Add labels to the graph of features
plt.xlabel('Importance Score of Features')
plt.ylabel('Features')
plt.title("Visualizing Features and Imp_scores")
plt.show()
중요도는 score가 높은 상위 몇개의 feature을 추출하기 쉽도록 주로 내림차순으로 정렬하는데,
필수적인 부분은 아니다.

- selected feature만을 가지고 model만들기
앞에서 구한 importance를 바탕으로 상위 3가지 feature만 가지고 model을 만들어 볼 것이다. 즉, sepal width을 제외한 petal width, petal length, sepal length를 가지고 model을 만드는 것이다.
여기서는 원하는 feature만 추출(column 추출)하기 위해서 앞에서 사용한 x,y를 다른 형태로 수정할 것이다.
iris = datasets.load_iris()
data=pd.DataFrame({
    'sepal length':iris.data[:,0],
    'sepal width':iris.data[:,1],
    'petal length':iris.data[:,2],
    'petal width':iris.data[:,3],
    'species':iris.target
})

x = data[['petal length','petal width','sepal length']]
y = iris.target

... 이어서 모델은 앞에서 설명한 것과 동일하게 만들면 된다.
위의 방법은 사용할 feature를 직접 선언했지만 아래의 방법은 지정한 threshold보다 큰 importance를 가지는 feature만 사용하는 방법이다.
from sklearn.feature_selection import SelectFromModel

# Set the threshold and Extract features(>=threshold)
feature_threshold = SelectFromModel(model,threshold=0.1)

#Extract selected feature values
selected_x = feature_threshold.fit_transform(x,y)

#ReTrain the model with selecte data
changed_model = model.fit(selected_x,y)
3. Full code
4. References
📷 Image Source
- Decision Tree: wikipedia
- Random Forest: SciencsDirect-Random Forest
📋 Referenced sites
- dinhanhthi blog -- Random Forest
- scikit learn official page -- RanfomForestClassifier
- Thiago Vieira's kaggle page -- Simple Random Forest-Iris Dataset
- JFun's blog -- Implemet simple RF with Iris data
⭐
