
📖 2장. SQL 튜닝
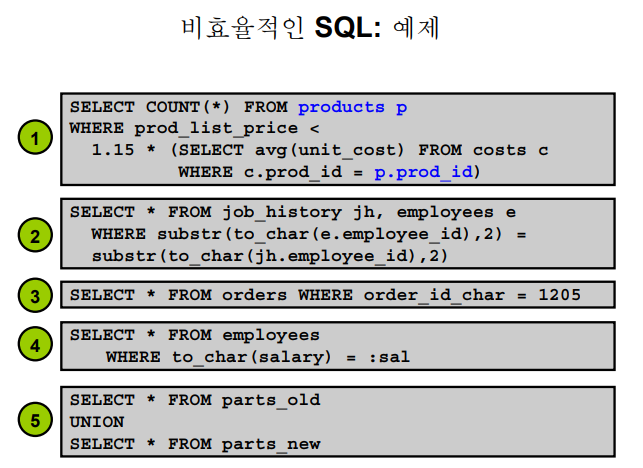
✏️ 비효율적인 SQL 성능 원인

1. 오래되거나 누락된 옵티마이저 통계
- 오래되거나 누락된 옵티마이저 통계
select ename, sal
  from emp
  where sal=1200;
➡️ 서버 프로세서가 위의 SQL을 파싱하고 실행계획을 생성하기 위해 emp 테이블에 대한 정보를 확인하는데 emp 테이블에 대한 정보가 옵티마이저 통계정보이다.
select table_name, last_analyzed
 from user_tables
 where table_name='EMP';

TABLE_NAME                     LAST_ANALYZED
------------------------------ -------------------
EMP                              #비어있다!(누락)
emp테이블에 대한 정보가 있어야 옵티마이저가 좋은 실행계획을 낼 수 있는데
LAST_ANALYZED가 비어있으면 통계정보가 없다는 것. 좋은 실행계획을 낼 수 없다!!
✔️ emp 테이블에 대해 옵티마이저 통계 정보 생성
방법1.analyze table emp compute statistics;
방법2.오라클 권장exec dbms_stats.gather_table_stats('SCOTT', 'EMP');
결과확인SCOTT @ orcl2 > select table_name, last_analyzed from user_tables where table_name='EMP'; 2 3 TABLE_NAME LAST_ANALYZED ------------------------------ ------------------- EMP 2023/11/10:10:37:59
문제 dept테이블에 대해 옵티마이저 통계 정보 수집하고 확인하기
SCOTT @ orcl2 > analyze table dept compute statistics;

SCOTT @ orcl2 > select table_name, last_analyzed
    from user_tables
    where table_name='DEPT';   2    3

TABLE_NAME                     LAST_ANALYZED
------------------------------ -------------------
DEPT                           2023/11/09:16:06:15
2. 누락된 액세스 구조
select ename, sal
from emp
where ename = 'ALLEN';
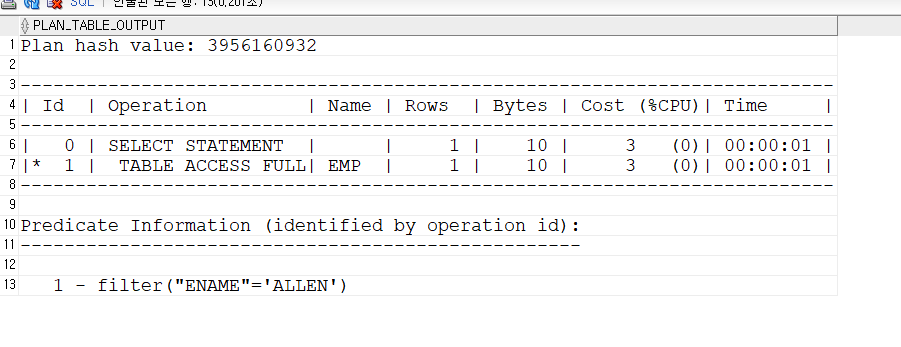
-- 인덱스 없으면 full table scan;
좋은 인덱스 하나가 수십 개의 SQL 튜닝 안해도 되게 만든다. 문제1.
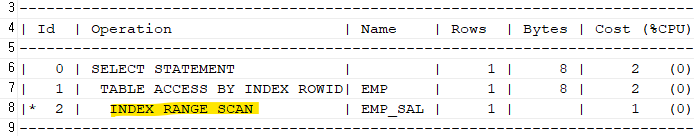
select ename, sal
from emp
where ename='ALLEN';

explain plan for
select ename, sal
from emp
where ename='ALLEN';

select * from table(dbms_xplan.display);
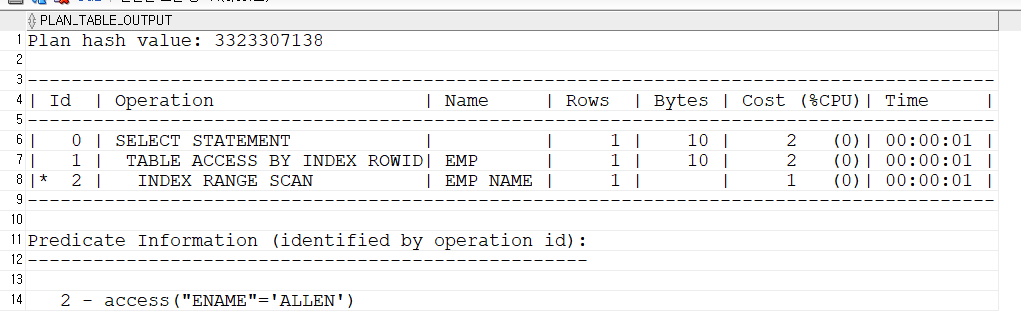
문제2. 아래의 SQL이 인덱스 스캔을 할 수 있도록
select ename, sal
from emp
where ename ='ALLEN';
create index emp_name on emp(ename); explain plan for select ename, sal from emp where ename='ALLEN'; select * from table(dbms_xplan.display); -- 만약 위가 안될 경우 -- explain plan for select /*+ index(emp emp_ename) */ ename,sal from emp where ename='ALLEN'; select * from table(dbms_xplan.display);
3. 최적 상태가 아닌 실행 계획 선택
select ename, sal
from emp
where ename='ALLEN';
➡️ if ename에 인덱스가 존재 -> 서버 프로세스가 위의 SQL 을 파싱하면 옵티마이저가 위의 sql의 실행 계획을
여러 개 생성한다.
1. 인덱스를 엑세스 하는 실행 계획
2. full table scan 하는 실행 계획
- 짧은 시간에 선택을 해야 하므로 좋은 선택을 하지 못하는 경우도 생긴다.
- dba가 힌트를 줘 좋은 실행 계획으로 유도를 할 수 있다.
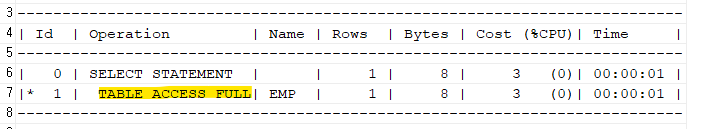
문제1. 아래의 sql의 실행 계획이 full table scan이 되도록 하기
select ename, sal
from emp
where ename='ALLEN';
explain plan for select /*+ full(emp) */ename, sal from emp where ename='ALLEN'; select * from table(dbms_xplan.display);
문제2. full table scan이 아닌 index scan이 되도록 하기
explain plan for
select /*+ index(emp emp_ename) */ ename,sal
from emp
where ename='ALLEN';

select * from table(dbms_xplan.display);
✏️ 비효율 적인 SQL 첫번째 (상호 관련 서브쿼리)
💡 튜닝 TIP : 상호관련 서브쿼리의 성능이 느리면 인라인뷰로 변환해라!
실습 (상호 관련 서브 쿼리) 부서 테이블에서 부서 번호와 부서명을 출력하는데 , 사원이 3명 이상인 부서만 출력되게
select deptno, dname
from dept d
where 3 <= (select count(*) from emp e where e.deptno = d.deptno);
➡️ 상호 관련 서브 쿼리. 메인 쿼리의 컬럼이 서브 쿼리로 들어가서 수행되므로 메인 쿼리문부터 수행이 된다.
➡️ select deptno from dept 를 먼저 조회에 10번이 결과로 나왔다면 where에 대입 (select count(*) from emp where deptno=10;) 후에 20을 넣고 순차적으로 진행
➡️ 메인 쿼리의 data가 많으면 느려진다.
문제1. 사원 테이블에서 사원 이름과 월급 출력하는데 자기가 속한 부서 번호의 평균 월급보다 자신의 월급이 더 높은 사원들만 출력
explain plan for
select ename, sal
from emp e1
where sal > (select avg(sal)
from emp e2
where e2.deptno = e1.deptno);

select * from table(dbms_xplan.display);

ENAME             SAL
---------- ----------
KING             5000
BLAKE            2850
JONES            2975
ALLEN            1600
FORD             3000
SCOTT            3000

PLAN_TABLE_OUTPUT
--------------------------------------------------------------------------------
Plan hash value: 1245077725

--------------------------------------------------------------------------------
| Id  | Operation            | Name    | Rows  | Bytes | Cost (%CPU)| Time     |
--------------------------------------------------------------------------------
|   0 | SELECT STATEMENT     |         |     1 |    39 |     8  (25)| 00:00:01 |
|*  1 |  HASH JOIN           |         |     1 |    39 |     8  (25)| 00:00:01 |
|   2 |   VIEW               | VW_SQ_1 |     3 |    78 |     4  (25)| 00:00:01 |
|   3 |    HASH GROUP BY     |         |     3 |    21 |     4  (25)| 00:00:01 |
|   4 |     TABLE ACCESS FULL| EMP     |    14 |    98 |     3   (0)| 00:00:01 |
|   5 |   TABLE ACCESS FULL  | EMP     |    14 |   182 |     3   (0)| 00:00:01 |
➡️ 상호 관련 서브쿼리는 메인 쿼리에서 액세스 되는 데이터의 건수가 많으면 많을 수록 느려진다. → 사용 X
➡️ 만약 메인 쿼리의 table에 건수가 200만건이면 200만 건 다 넘겨주는 것.
마지막 문제 위 방법 말고 다른 SQL로 위 결과 출력
explain plan for
select *
from
(select ename, sal, round(avg(sal) over(partition by deptno)) avgsal
from emp)
where sal > avgsal;

select * from table(dbms_xplan.display);

PLAN_TABLE_OUTPUT
--------------------------------------------------------------------------------
Plan hash value: 4130734685

----------------------------------------------------------------------------
| Id  | Operation           | Name | Rows  | Bytes | Cost (%CPU)| Time     |
----------------------------------------------------------------------------
|   0 | SELECT STATEMENT    |      |    14 |   462 |     4  (25)| 00:00:01 |
|*  1 |  VIEW               |      |    14 |   462 |     4  (25)| 00:00:01 |
|   2 |   WINDOW SORT       |      |    14 |   182 |     4  (25)| 00:00:01 |
|   3 |    TABLE ACCESS FULL| EMP  |    14 |   182 |     3   (0)| 00:00:01 |
----------------------------------------------------------------------------

explain plan for
select e.ename, e.sal
    from emp e, (select deptno, avg(sal) avgsal from emp group by deptno) emp
  where e.deptno = emp.deptno
   and e.sal > avgsal;

select * from table(dbms_xplan.display);

PLAN_TABLE_OUTPUT
--------------------------------------------------------------------------------
Plan hash value: 269884559

-----------------------------------------------------------------------------
| Id  | Operation            | Name | Rows  | Bytes | Cost (%CPU)| Time     |
-----------------------------------------------------------------------------
|   0 | SELECT STATEMENT     |      |     1 |    39 |     8  (25)| 00:00:01 |
|*  1 |  HASH JOIN           |      |     1 |    39 |     8  (25)| 00:00:01 |
|   2 |   VIEW               |      |     3 |    78 |     4  (25)| 00:00:01 |
|   3 |    HASH GROUP BY     |      |     3 |    21 |     4  (25)| 00:00:01 |
|   4 |     TABLE ACCESS FULL| EMP  |    14 |    98 |     3   (0)| 00:00:01 |
|   5 |   TABLE ACCESS FULL  | EMP  |    14 |   182 |     3   (0)| 00:00:01 |

explain plan for
select e1.ename, e1.sal
from emp e1, (
select deptno, avg(sal) as avgsal
from emp
group by deptno
) e2
where e1.deptno = e2.deptno and e1.sal > e2.avgsal;

select * from table(dbms_xplan.display);
➡️ 인라인뷰 안에 쿼리문이 실행되어서 500만건의 emp 테이블이 5건으로 줄어들게 되면(부서번호가 5개여서) 조인하는 데이터 양이 줄어드므로 좋은 성능으로 결과를 볼 수 있다.
- sql 튜닝 초급 : 힌트
- sql 많이 해본 사람 : sql문 바꿔버리기.
💡 튜닝 tip. 상호 관련 서브 쿼리의 성능이 느리면 인라인 뷰로 변환.
✏️ 비효율적인 SQL 두번째 (조인 연결고리 가공)
💡 tip : 조인할 때 조인 연결고리를 가공하지 말아라!
💡 꼭 조인 연결고리를 가공해야만 할 때에는, 함수 기반 인덱스로 해결할 수 있다.
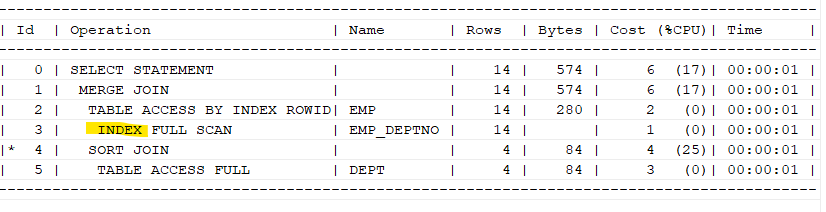
create index emp_deptno on emp(deptno);
create index dept_deptno on dept(deptno);

explain plan for
select e.ename, d.loc
 from emp e, dept d
 where e.deptno = d.deptno;

select * from table(dbms_xplan.display);
➡️ 인덱스 스캔을 하는 실행 계획이 나오면, 옵티마이저가 좋은 실행계획을 만든 것이다.❗ Join 연결고리를 가공한 예시
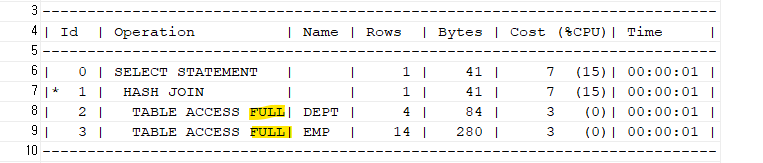
explain plan for
select e.ename, d.loc
 from emp e, dept d
 where substr(to_char(e.deptno),1,2) = substr(to_char(d.deptno),1,2);

select * from table(dbms_xplan.display);
➡️ 위와 같이 조인 연결고리 컬럼을 함수로 가공하게 되면, 인덱스를 사용하지 못하고 full table scan을 할 수 밖에 없게된다.
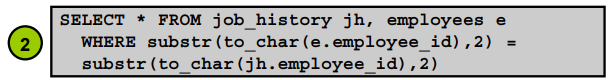
문제1. 아래의 sql의 실행계획을 확인하기
select *
 from job_history jh, employees e
 where substr(to_char(e.employee_id),2) = substr(to_char(jh.employee_id),2) ;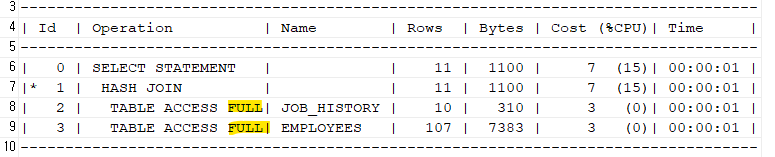
문제2. 아래의 SQL을 튜닝하기
select *
 from job_history jh, employees e
 where substr(to_char(e.employee_id),2) = substr(to_char(jh.employee_id),2) ;

select *
 from job_history jh, employees e
 where e.employee_id = jh.employee_id ;
➡️ 위의 경우 결과가 다르게 나온다.
⭐ 튜닝 후 : 다음과 같이 함수 기반 인덱스를 생성합니다.
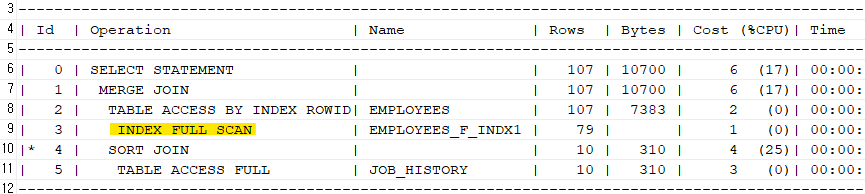
-- job_history쪽
create index job_history_f_indx1
  on job_history(substr(to_char(employee_id),2));

-- employees쪽
create index employees_f_indx1
  on employees(substr(to_char(employee_id),2));

-- 위처럼 인덱스 만들고 다시 악성 SQL 수행해보기
explain plan for
select *
 from job_history jh, employees e
 where substr(to_char(e.employee_id),2) = substr(to_char(jh.employee_id),2) ;

select * from table(dbms_xplan.display);
➡️ 위처럼 어쩔 수 없이 조인 연결고리를 가공해야만 할 때는, 함수 기반 인덱스를 생성하자!
✏️ 비효율적인 SQL 세번째 (암시적 형변환)
💡 tip : 암시적 형변환으로 인해 인덱스 엑세스를 못하는 것에 주의하기!

create table emp_chr
as
 select empno, ename, job,tochar(sal) as sal, ,comm, mgr, hiredate, deptno from emp;

select * from emp_chr;
desc emp_chr;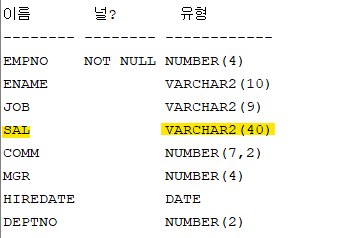
➡️ sal을 문자형으로 만들었다.
select ename, sal
  from emp_chr
  where sal='3000';
       문자형   문자형

select ename, sal
  from emp_chr
  where sal=3000;
       문자형   숫자형
➡️ 위처럼 숫자형으로 조회해도 결과는 잘 나온다. (오라클이 그렇다)
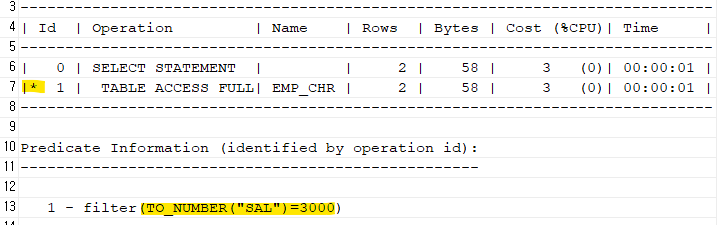
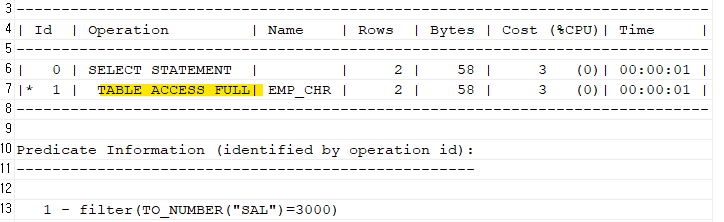
암시적 형 변환이 일어났는지 실행계획을 확인해보자explain plan for select ename, sal from emp_chr where sal=3000; select * from table(dbms_xplan.display);
➡️ 암시적 형변환이 발생했다! 숫자가 우선순위가 높아서 숫자로 바꿨다.1 - filter(TO_NUMBER("SAL")=3000)
❓ 암시적 형변환이 발생하면 좋은것인가? 아니다 !!
다음과 같은 경우의 케이스에서는 좋지 않다.
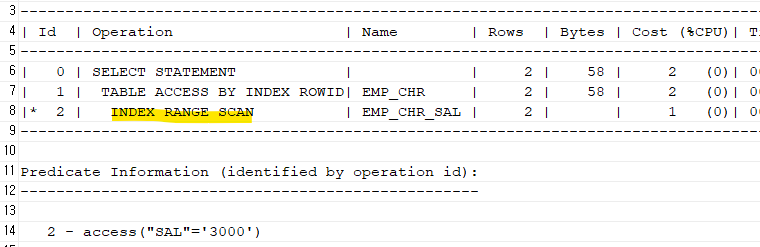
create index emp_chr_sal
  on emp_chr(sal);
위처럼 인덱스를 만들고 아래의 SQL 실행결과를 비교해보자.
#1. 문자형 - 문자형 일 때
explain plan for
select ename, sal
  from emp_chr
  where sal='3000';

select * from table(dbms_xplan.display);
#2. 문자형 - 숫자형 일 때
explain plan for
select ename, sal
  from emp_chr
  where sal=3000;

select * from table(dbms_xplan.display);
➡️ 문자형 - 숫자형은 풀스캔을 한다.1 - filter(TO_NUMBER("SAL")=3000)보면 to_number(sal)로 SQL을 옵티마이져가 변경하면서 SAL인덱스 컬럼이 가공되어버렸다. 가공이 되면 인덱스 스캔을 하지 못하고 full table scan을 한다.
💡 튜닝 tip
인덱스가 있는데도 불구하고, 인덱스 엑세스를 못한다면 암시적 형변환이 발생한것은 아닌지 실행계획을 확인하자!
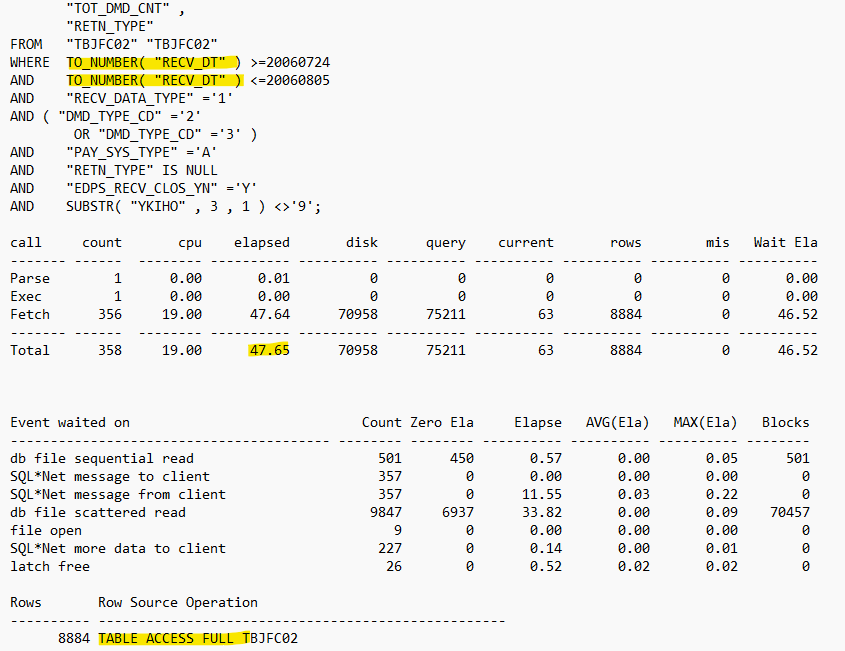
암시적 형변환 튜닝 실무 사례
✔️ 튜닝 전
✔️ 튜닝 후
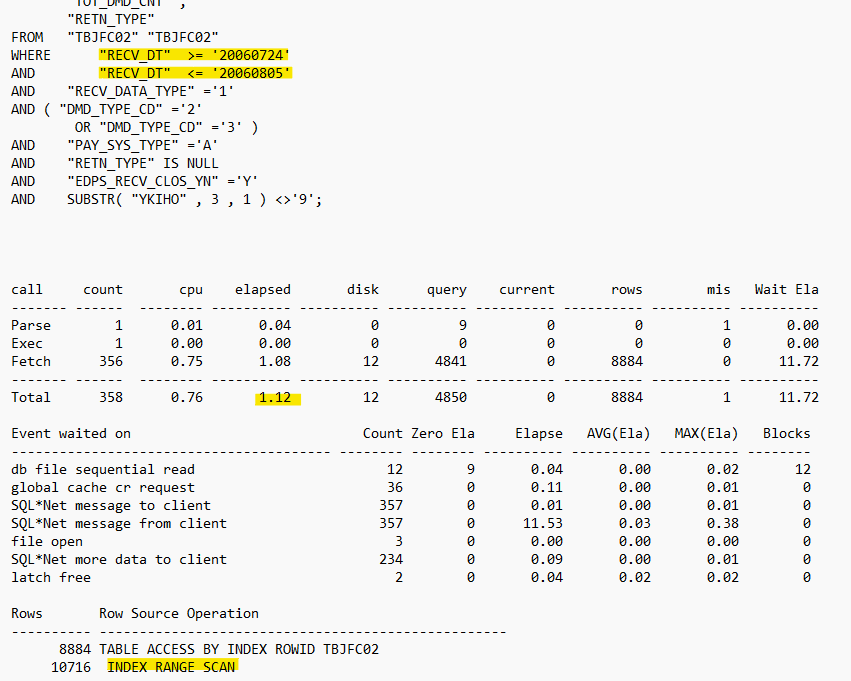
➡️ 위와같이 인덱스가 있는데도 불구하고 풀테이블 스캔을 한다면 인덱스 컬럼을 함수로 가공하지 않았는지 살펴보면 된다.
문제1. 아래의 oe.orders 테이블을 가지고 orders_chr을 만들기
create table orders_chr
as
 select to_char(order_id) as order_id_chr, od.*
 from oe.orders od;

select * from orders_chr;
➡️ oe.ordes를 가져와서 별칭을 od로 만들었다. order_id를 문자형으로 만들고(order_id_chr), od.*은 모든 컬럼들을 다 가져오는 것이다.
order_id_chr은 문자형이고order_id은 기존에 있던 숫자형이다.✔️ 인덱스를 생성해보자
create index orders_chr_idx1
 on orders_chr(order_id_chr);
문제2. 아래의 SQL의 실행계획을 확인하고 튜닝하기 (order_id_chr는 문자형인데 숫자로 검색)
explain plan for
select *
 from orders_chr
 where order_id_chr = 2457;

select * from table(dbms_xplan.display);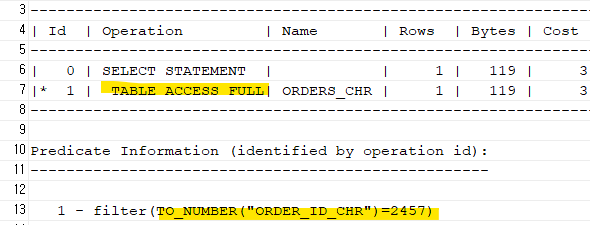
➡️ 아까 인덱스를 만들었는데도 불구하고 Full table scan을 한다. 1 - filter(TO_NUMBER("ORDER_ID_CHR")=2457)
✏️ 비효율적인 SQL 네번째 (인덱스 컬럼 가공)
💡 tip: 인덱스 컬럼을 가공하지 마라! 인덱스 컬럼을 함수를 사용해서 가공하면 풀테이블 스캔을 한다.

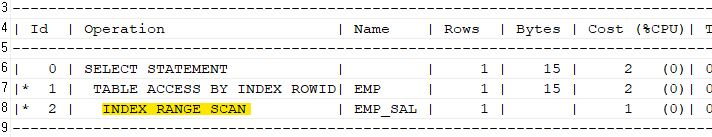
create index emp_sal
 on emp(sal);

explain plan for
select ename, sal
  from emp
  where sal=3000;

select * from table(dbms_xplan.display);
➡️ 인덱스를 잘 액세스 한다!
❗다음과 같이 실행explain plan for select ename, sal from emp where to_char(sal)=3000; select * from table(dbms_xplan.display);
문제1. 사원 테이블에 job에 인덱스를 생성하시오
create index emp_job
 on emp(job);
문제2. 아래의 SQL을 튜닝하시오!
-- 가공된 SQL
select ename, job
  from emp
  where substr(job,1,5)='SALES';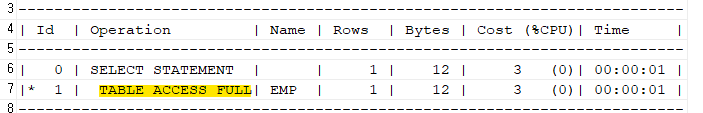
-- 튜닝된 SQL
explain plan for
select ename, job
  from emp
  where job like 'SALES%';

select * from table(dbms_xplan.display);
문제3. 아래의 SQL을 튜닝하기
-- 튜닝전 SQL
select ename, sal, job
  from emp
  where job || sal='ANALYST3000';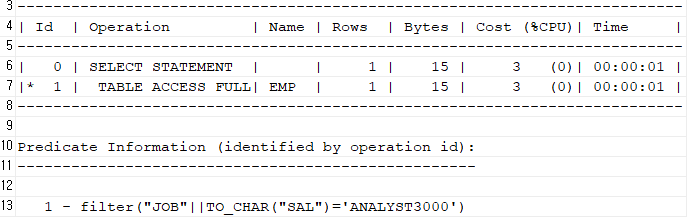
-- 튜닝 후 SQL
select ename, sal, job
  from emp
  where job = 'ANALYST'
  and sal=3000;
➡️ 위와 같이 job에도 인덱스가 있고 sall에도 인덱스가 있는 상태에서 2개중에 어느 하나의 인덱스를 선택해야 하는 경우라면 옵티마이저는 어떤 인덱스를 탈까?
1. 액세스가 되는 건수가 작은 컬럼
select count(*) from emp where job = 'ANALYST' ;
select count(*) from emp where sal = 3000;
2. 둘다 건수가 같으면 즉 선택도가 같으면 뒤쪽에 있는 조건의 인덱스를 엑세스한다.
select ename, sal, job
  from emp
  where job = 'ANALYST'
  and sal=3000;
💡 from 절, where절, select절! 순서인데 where절에 뒤쪽에 sal이 있으니까 sal인덱스를 액세스 한 것이다.
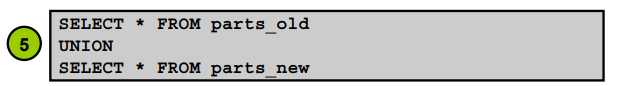
✏️ 비효율적인 SQL 다섯번째
💡 tip: 유니온은 정렬작업을 일으키니 장렬작업 없이 SQL 2개의 결과**를 합치고 싶다면 union all을 사용하기!
✔️ 집합 연산자 4가지
1. union all 합집합
2. union 합집합 + 정렬
3. intersect 교집합 + 정렬
4. minus 차집합 + 정렬
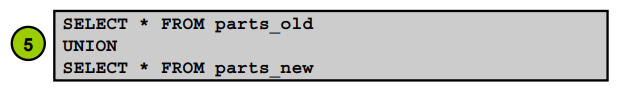
-- 튜닝전
select  * from emp where deptno = 10
union
select * from emp where deptno = 20;
-- 튜닝후
select  * from emp where deptno = 10
union all
select * from emp where deptno = 20;
문제 위의 튜닝전 SQL과 튜닝후 SQL의 실행계획을 확인하기
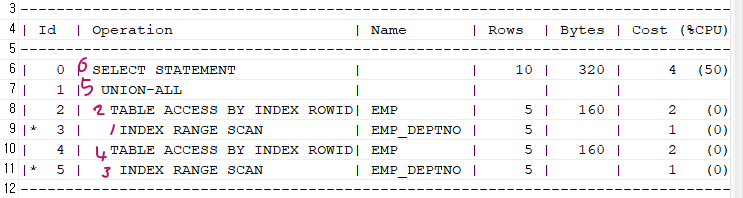
1. union의 실행계획
explain plan for
select  * from emp where deptno = 10
union
select * from emp where deptno = 20;

select * from table(dbms_xplan.display);
2. union all의 실행계획
explain plan for
select  * from emp where deptno = 10
union all
select * from emp where deptno = 20;

select * from table(dbms_xplan.display);
➡️ 실행 계획에SORT UNIQUE와 같이SORT라는 말이 들어가있으면 PGA 영역와 temporary tablespace에서 정렬작업이 발생하는 것이므로, 그만큼 SQL이 느려진다 라는 뜻이다. 정렬작업을 안할 수 있으면 안하는게 좋다.
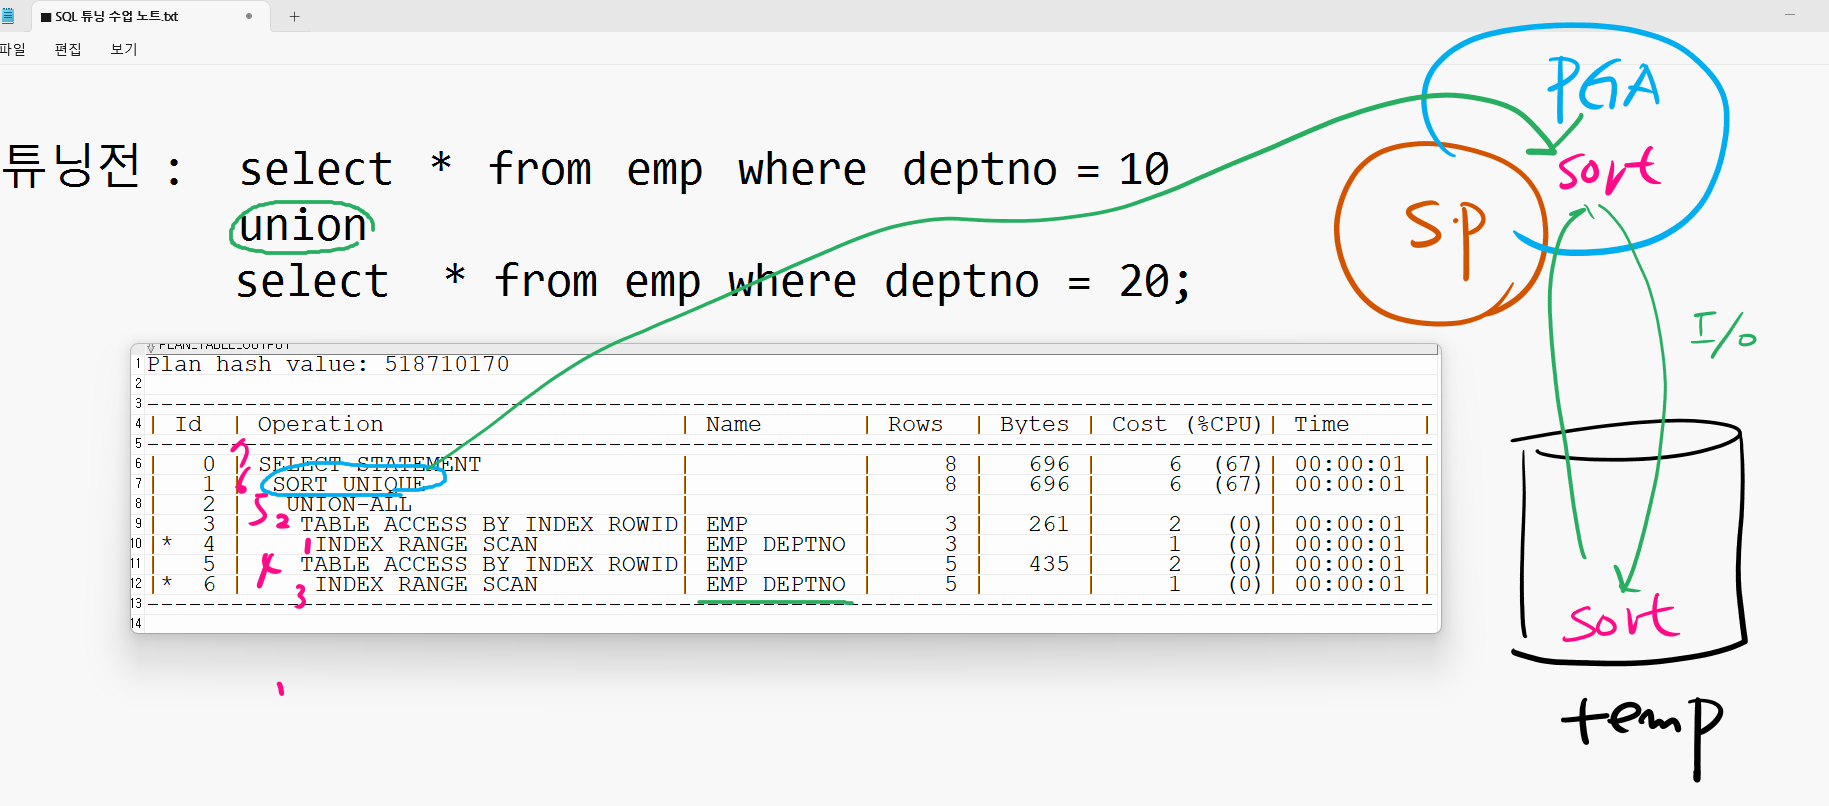
⭐ 우리 지금 11g로 실습했는데, 19c에서도 해보았음. 똑같이 정렬 함! 어느 버전에서 정렬을 하지 않는다.
explain plan for
select  * from emp where deptno = 10
union
select * from emp where deptno = 20;

select * from table(dbms_xplan.display); 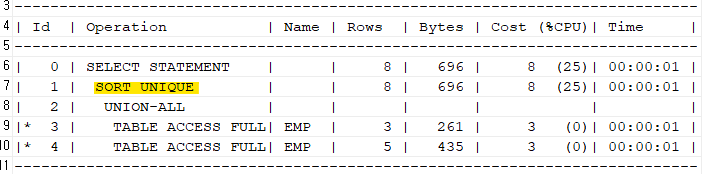
💡 정렬 작업을 일으키는 SQL들과 튜닝방법
order by-> 인덱스를 이용한 힌트 사용으로 튜닝union-> union all로 사용intersect-> exists 사용minus-> not exists 사용distinct(버전마디 차이) -> 히든 파라미터(아래 나옴)로 조정sort merge join-> hash join으로 유도하기create index(인덱스 생성) -> 정렬작업이 불가피 해서 인덱스 생성 작업이 빨리 수행될 수 있도록 parallel 옵션 사용create index emp_sal on emp(sal) parallel 4;
✅ distinct가 정렬 작업을 일으키는지 확인
select distinct deptno
 from emp;

-- 안일으킨다.
30
20
10
select /*+ opt_param('_gby_hash_aggregation_enabled', 'false') */ distinct deptno from emp; DEPTNO -------------- 10 20 30➡️ 히든 파라미터인
opt_param힌트를 사용하면 SQL level로 파라미터 값을 지정할 수 있다.
'false'면 정렬 되고'true'면 정렬이 안된 결과를 볼 수 있다.
distinct로 인해 어쩔 수 없이 정렬된 결과가 나왔을 때 정렬을 일으키기 싫다면/*+ opt_param('_gby_hash_aggregation_enabled', 'true') */로 사용하면 된다.
✏️ 성능 모니터링 솔루션의 큰 그림
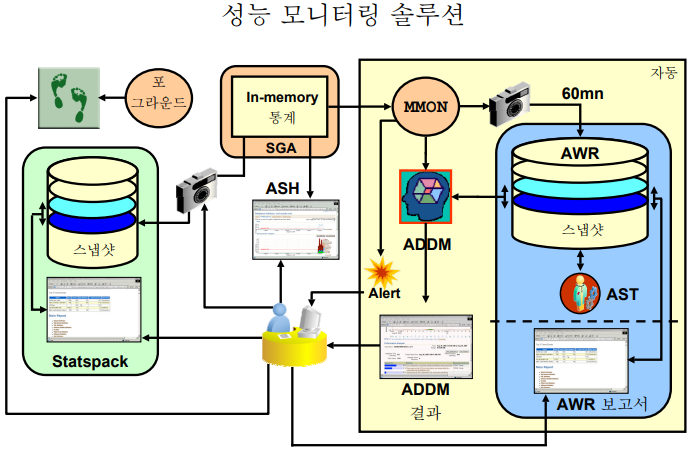
✔️ 오라클 성능 진단하는 툴
- dba_outstanding_alert
- awr report (@?/rdbms/admin/awrpt.sql)
MMON이 사진을 찍고 awr에 적어놓는다. MMON은 항상 자동으로 찍지만, 수동으로 찍고싶다면
exec dbms_workload_repository.create_snapshot; <- 이렇게 찍을 수 있음!!
- addm report (@?/rdbms/admin/addmrpt.sql)
- ash report (@?/rdbms/admin/ashrpt.sql)
- awr 비교 레포트 (@?/rdbms/admin/awrddrpt.sql)
➡️
ash는 가까운 현재에 무슨일이 생겼는지 확인
awr,addm은 과거에 있는 성능정보를 볼 때
💡 오라클 메모리의 성능 정보를 1시간에 한번씩 자동으로 수집하는 오라클 백그라운드 프로세서는 MMON이다! (Memory Monitor)
✏️ 오라클에 있는 모든 성능 모니터링 툴들 소개
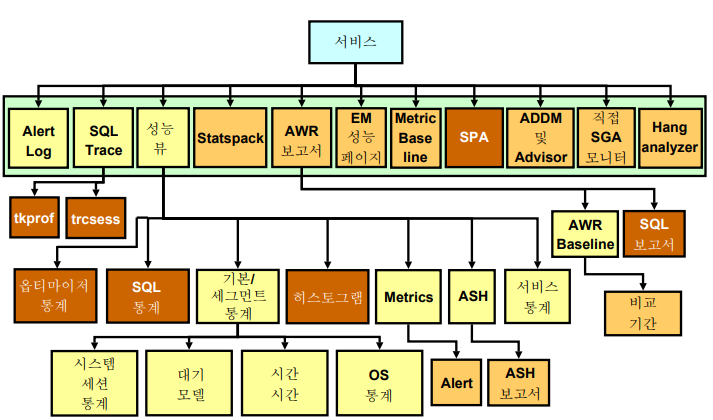
⭐ SQL Trace는 SQL 튜닝할 때 중요하다. AWR 보고서, ADDM및 어드바이저 잘 알고있기!
✏️ 오라클에 있는 모든 성능 모니터링 툴 소개
SQL 트레이스 생성하기
✅ 자신의 세션을 트레이스 하기
✔️ 1. 시간 정보가 SQL 트레이스에 포함될 수 있도록 설정alter session set timed_statistics = true;
- 생성되는 trace file의 제한을 주지 않게 설정
alter session set max_dump_file_size = unlimited;
- 10046 트레이스 이벤트를 활성화 한다.(오라클 7.3 이상)
alter session set events '10046 trace name context forever, level 8';➡️ level을 16까지 줄 수 있다. 8보다 더 많은 정보가 출력된다.
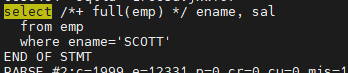
- 튜닝이 필요한 SQL을 실행한다.
select /*+ full(emp) */ ename, sal
  from emp
  where ename='SCOTT';
- 트레이스를 중단한다
alter session set events '10046 trace name context off';
- 트레이스 설정이후 생성된 트레이스 확인하는 방법
트레이스파일을 찾기 가장 쉬운 방법은, 트레이스가 완료된 직후에 해당 디렉토리 (UDUMP 또는 BDUMP) 에서
시간의 역순으로 파일들의 리스트를 확인하는 것이다 [역주:Unix Command: ls ?rlt  를 이용한다]
가장 최근에 생성된 파일이 찾고자 하는 파일일 가능성이 높은데, 파일 내용을 살펴보고 확인할 수 있다.
show parameter user_dump_dest; or select * from v$parameter where name='user_dump_dest'; /u01/app/oracle/diag/rdbms/orcl2/orcl2/trace $ cd /u01/app/oracle/diag/rdbms/orcl2/orcl2/trace $ ls -rlt -rw-r----- 1 oracle dba 3430 11월 10 15:02 orcl2_ora_15106.trc vi orcl2_ora_15106.trc
- 관련 트레이스 파일을 보기쉽게 보는 방법
$ tkprof explain=scott/tiger sys=no

    trace= orcl2_ora_15106.trc
    result= result01.txt
8. vi result01.txt 열어보기call count cpu elapsed disk query current rows ------- ------ -------- ---------- ---------- ---------- ---------- ---------- Parse 1 0.00 0.01 0 0 0 0 Execute 1 0.00 0.00 0 0 0 0 Fetch 1 0.00 0.00 0 7 0 1 ------- ------ -------- ---------- ---------- ---------- ---------- ---------- total 3 0.00 0.01 0 7 0 1 Misses in library cache during parse: 1 Optimizer mode: ALL_ROWS Parsing user id: 84 (SCOTT) Rows Row Source Operation ------- --------------------------------------------------- 1 TABLE ACCESS FULL EMP (cr=7 pr=0 pw=0 time=0 us cost=3 size=8 card=1) Rows Execution Plan ------- --------------------------------------------------- 0 SELECT STATEMENT MODE: ALL_ROWS 1 TABLE ACCESS MODE: ANALYZED (FULL) OF 'EMP' (TABLE) Elapsed times include waiting on following events: Event waited on Times Max. Wait Total Waited ---------------------------------------- Waited ---------- ------------ SQL*Net message to client 1 0.00 0.00 SQL*Net message from client 1 62.28 62.28 ********************************************************************************
스크립트 수행
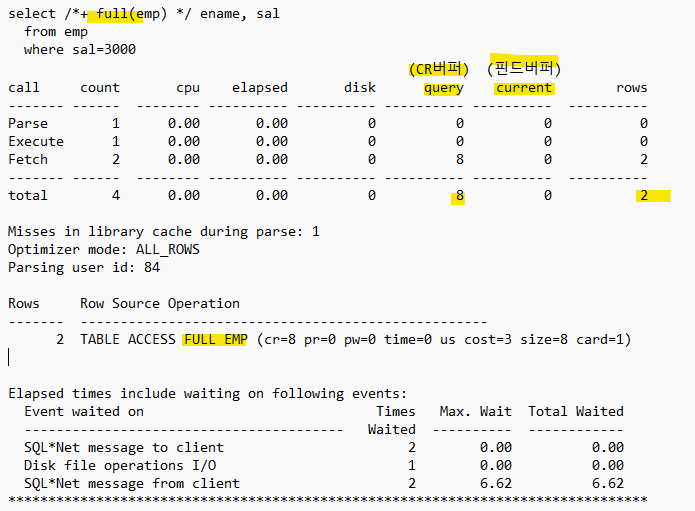
SCOTT @ orcl2 > ed trace_on.sql
SCOTT @ orcl2 > ed trace_off.sql
SCOTT @ orcl2 > ed trace_file.sql
SCOTT @ orcl2 > ed tkprof.sql
SCOTT @ orcl2 > @trace_on --악성SQL 수행 select /*+ full(emp) */ ename, sal from emp where sal=3000; SCOTT @ orcl2 > @trace_off SCOTT @ orcl2 > @trace_file TRACE_FILE_NAME -------------------------------------------------------------------------------- /u01/app/oracle/diag/rdbms/orcl2/orcl2/trace/orcl2_ora_22609.trc SCOTT @ orcl2 > @tkprof.sql Enter value for trace_file: /u01/app/oracle/diag/rdbms/orcl2/orcl2/trace/orcl2_ora_22609.trc Enter value for 1: output = report02.txt TKPROF: Release 11.2.0.1.0 - Development on Fri Nov 10 15:20:15 2023 Copyright (c) 1982, 2009, Oracle and/or its affiliates. All rights reserved.
문제1. 아래의 SQL을 SQL trace를 생성하기! 레포트 이름은 report07.txt
-- 튜닝 후 SQL
select /*+ index(emp emp_sal) */ ename, sal
  from emp
  where sal = 3000;
#1. SCOTT @ orcl2 > @trace_on #2. 위 SQL 수행 #3. SCOTT @ orcl2 > @trace_off #4. SCOTT @ orcl2 > @trace_file TRACE_FILE_NAME -------------------------------------------------------------------------------- /u01/app/oracle/diag/rdbms/orcl2/orcl2/trace/orcl2_ora_22609.trc #5. SCOTT @ orcl2 > @tkprof Enter value for trace_file: /u01/app/oracle/diag/rdbms/orcl2/orcl2/trace/orcl2_ora_22609.trc Enter value for 1: output = report07.txt
✏️ SQL 튜닝 툴중에 SQL tuning advisor 사용법
실습순서
- scott으로 test 테이블 생성
SQL> connect scott/tiger
SQL> create table test (n number );

SQL> declare
begin
for  i  in  1 .. 10000  loop
insert into test values(i);
commit;
end loop;
end;
/

SQL> select count(*) from test;
- 인덱스 생성
SQL> create index test_idx on test(n);
- test 테이블 통계정보 분석
SQL> analyze table test estimate statistics;
- NO_INDEX 힌트를 주어 풀테이블 스캔으로 수행되는 SQL확인
SQL> set autot traceonly explain -- 이명령어를 수행시 다음 SQL의 실행계획만 출력되게 한다.

SQL> select /*+ NO_INDEX(test test_idx) */ *  from test  where n = 1 ;

Execution Plan
----------------------------------------------------------
Plan hash value: 1357081020

--------------------------------------------------------------------------
| Id  | Operation         | Name | Rows  | Bytes | Cost (%CPU)| Time     |
--------------------------------------------------------------------------
|   0 | SELECT STATEMENT  |      |     1 |     3 |     7   (0)| 00:00:01 |
|*  1 |  TABLE ACCESS FULL| TEST |     1 |     3 |     7   (0)| 00:00:01 |
--------------------------------------------------------------------------

Predicate Information (identified by operation id):
---------------------------------------------------

   1 - filter("N"=1)
- 튜닝 TASK생성 후, SQL Tuning Advisor를 실행
SQL> connect / as sysdba

SQL> declare
my_task_name VARCHAR2(30);
my_sqltext CLOB;
begin
my_sqltext := 'select /*+ no_index(test test_idx) */ *
from test where n = 1';
my_task_name := DBMS_SQLTUNE.CREATE_TUNING_TASK (
sql_text => my_sqltext,
user_name => 'SCOTT',
scope => 'COMPREHENSIVE',
time_limit => 60,
task_name => 'my_sql_tuning_task_1',
description => 'Task to tune a query on a specified table' );
end;
/


SQL> begin
DBMS_SQLTUNE.EXECUTE_TUNING_TASK (
task_name => 'my_sql_tuning_task_1' );
      end;
      /
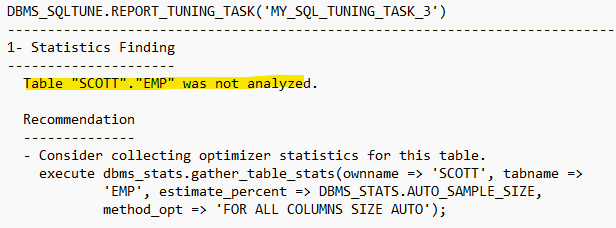
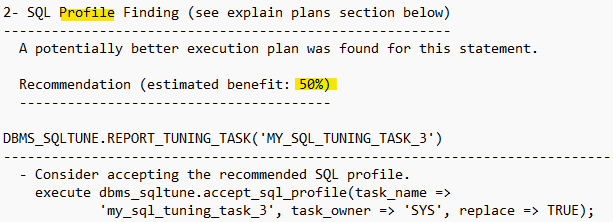
DBMS_SQLTUNE.CREATE_TUNING_TASK가 튜닝해주는 Advisor!my_sqltext := 'select /*+ no_index(test test_idx) */ * from test where n = 1';안에 튜닝하고 싶은 내용을 쓴다.6. SQL Tuning Advisor을 통해 얻은 결과(튜닝 레포트)를 확인하고 SQL Profile을 적용
SQL> SET LONG 70000
SQL> SET LONGCHUNKSIZE 1000
SQL> SET LINESIZE 100

SQL> select DBMS_SQLTUNE.REPORT_TUNING_TASK( 'my_sql_tuning_task_1') from DUAL;

SQL> DECLARE
my_sqlprofile_name VARCHAR2(30);
BEGIN
my_sqlprofile_name := DBMS_SQLTUNE.ACCEPT_SQL_PROFILE ( task_name => 'my_sql_tuning_task_1', name => 'my_sql_profile' );
END;
/
- 위에서 실행한 악성 SQL의 실행계획을 확인 (scott에서)
SQL> conn scott/tiger

SQL> set autot traceonly explain
SQL> select /*+ NO_INDEX(test test_idx) */ * from test where n = 1;

Execution Plan
----------------------------------------------------------
Plan hash value: 2882402178

-----------------------------------------------------------------------------
| Id  | Operation        | Name     | Rows  | Bytes | Cost (%CPU)| Time     |
-----------------------------------------------------------------------------
|   0 | SELECT STATEMENT |          |     1 |     3 |     1   (0)| 00:00:01 |
|*  1 |  INDEX RANGE SCAN| TEST_IDX |     1 |     3 |     1   (0)| 00:00:01 |
-----------------------------------------------------------------------------

Predicate Information (identified by operation id):
---------------------------------------------------

   1 - access("N"=1)

Note
-----
   - SQL profile "my_sql_profile" used for this statement
문제 아래의 튜닝전 SQL의 실행계획을 확인하기
set autot off
@demo
- 인덱스 만들기
create index emp_sal on emp(sal);
- 튜닝 전SQL 수행
explain plan for
select /*+ no_index(emp emp_sal) */ ename, sal
  from emp
  where sal=3000;

select * from table(dbms_xplan.display);

--------------------------------------------------------------------------
| Id  | Operation         | Name | Rows  | Bytes | Cost (%CPU)| Time     |
--------------------------------------------------------------------------
|   0 | SELECT STATEMENT  |      |     2 |    40 |     2   (0)| 00:00:01 |
|*  1 |  TABLE ACCESS FULL| EMP  |     2 |    40 |     2   (0)| 00:00:01 |
--------------------------------------------------------------------------
문제 아래의 SQL을 SQL 튜닝 어드바이저에게 넣어서 튜닝시키기
select /*+ no_index(emp emp_sal) */ ename, sal
  from emp
  where sal=3000;
- 튜닝 TASK생성 후, SQL Tuning Advisor를 실행
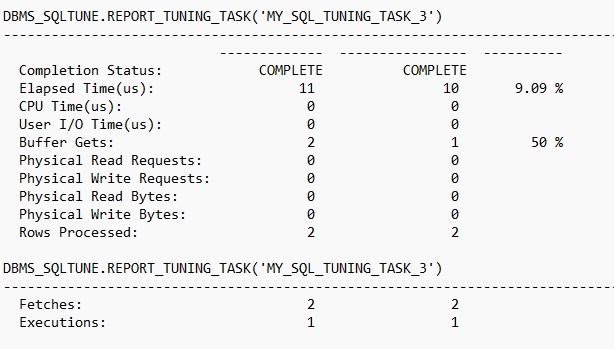
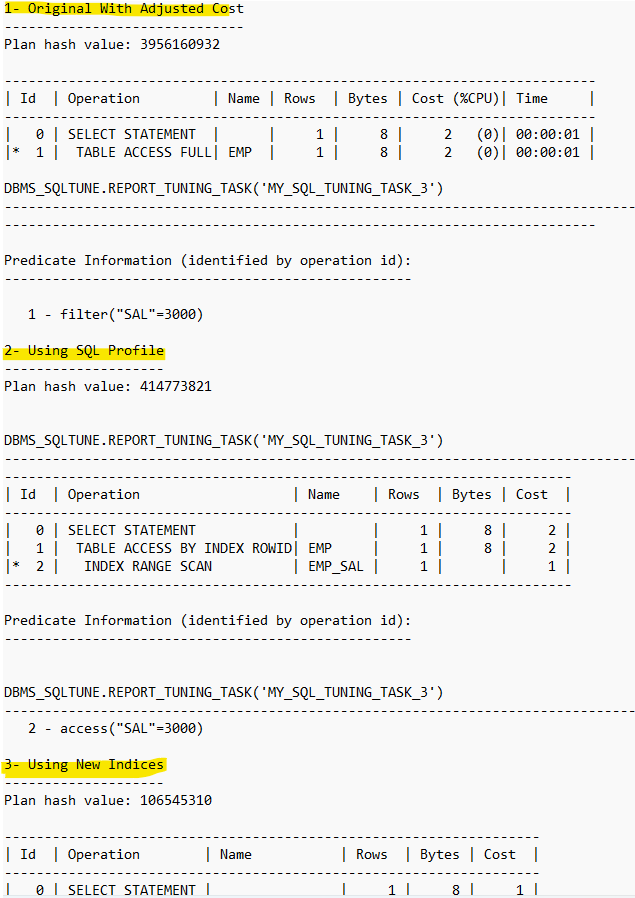
SQL> connect / as sysdba
SQL> declare
my_task_name VARCHAR2(30);
my_sqltext CLOB;
begin
my_sqltext := 'select /*+ no_index(emp emp_sal) */ ename, sal
  from emp
  where sal=3000';
my_task_name := DBMS_SQLTUNE.CREATE_TUNING_TASK (
sql_text => my_sqltext,
user_name => 'SCOTT',
scope => 'COMPREHENSIVE',
time_limit => 60,
task_name => 'my_sql_tuning_task_3',
description => 'Task to tune a query on a specified table' );
end;
/


SQL>
begin
DBMS_SQLTUNE.EXECUTE_TUNING_TASK (
task_name => 'my_sql_tuning_task_3' );
end;
/
2. SQL Tuning Advisor을 통해 얻은 결과(튜닝 레포트)를 확인하고 SQL Profile을 적용
SQL> SET LONG 70000
SQL> SET LONGCHUNKSIZE 1000
SQL> SET LINESIZE 100

-- 결과 보기! 복사해서 메모장에 복붙함
SQL> select DBMS_SQLTUNE.REPORT_TUNING_TASK( 'my_sql_tuning_task_3') from DUAL;

SQL> DECLARE
my_sqlprofile_name VARCHAR2(30);
BEGIN
my_sqlprofile_name := DBMS_SQLTUNE.ACCEPT_SQL_PROFILE ( task_name => 'my_sql_tuning_task_2', name => 'my_sql_profile' );
END;
/
3. SQL profile 적용SQL> DECLARE my_sqlprofile_name VARCHAR2(30); BEGIN my_sqlprofile_name := DBMS_SQLTUNE.ACCEPT_SQL_PROFILE ( task_name => 'my_sql_tuning_task_3', name => 'my_sql_profile1' ); END; /
- 확인해보기
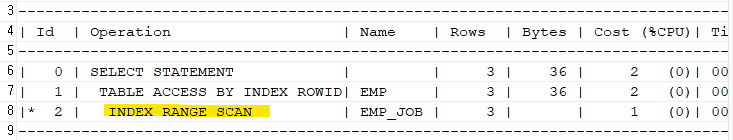
explain plan for
select /*+ no_index(emp emp_sal) */ ename, sal
  from emp
  where sal=3000;

select * from table(dbms_xplan.display);
----------------------------------------------------------------------- | Id | Operation | Name | Rows | Bytes | Cost | ----------------------------------------------------------------------- | 0 | SELECT STATEMENT | | 1 | 8 | 2 | | 1 | TABLE ACCESS BY INDEX ROWID| EMP | 1 | 8 | 2 | |* 2 | INDEX RANGE SCAN | EMP_SAL | 1 | | 1 | ----------------------------------------------------------------------- Predicate Information (identified by operation id): PLAN_TABLE_OUTPUT ---------------------------------------------------------------------------------------------------- --------------------------------------------------- 2 - access("SAL"=3000) Note ----- - cpu costing is off (consider enabling it) - SQL profile "my_sql_profile1" used for this statement➡️ Index를 잘 탔다 !!
SQL profile "my_sql_profile1" used for this statement이것도 잘 되었다고 나옴.
문제 사원 테이블에 empno에 인덱스 생성하기
SCOTT> create index emp_empno on emp(empno);문제 아래 SQL의 실행 계획 확인하기
explain plan for
select /*+ no_index(emp emp_empno) */ empno, ename, sal
  from emp
  where empno=7788;

select * from table(dbms_xplan.display);

--------------------------------------------------------------------------
| Id  | Operation         | Name | Rows  | Bytes | Cost (%CPU)| Time     |
--------------------------------------------------------------------------
|   0 | SELECT STATEMENT  |      |     1 |    33 |     2   (0)| 00:00:01 |
|*  1 |  TABLE ACCESS FULL| EMP  |     1 |    33 |     2   (0)| 00:00:01 |
--------------------------------------------------------------------------
오늘의 마지막 문제 위 SQL을 SQL 튜닝 어드바이저에게 문의해서 보다 나은 실행계획으로 SQL profile을 생성하고 적용해서 실행계획이 바뀌는지 확인하기!
- 튜닝 TASK생성 후, SQL Tuning Advisor를 실행
SQL> connect / as sysdba
SQL> declare
my_task_name VARCHAR2(30);
my_sqltext CLOB;
begin
my_sqltext := 'select /*+ no_index(emp emp_empno) */ empno, ename, sal
  from emp
  where empno=7788';
my_task_name := DBMS_SQLTUNE.CREATE_TUNING_TASK (
sql_text => my_sqltext,
user_name => 'SCOTT',
scope => 'COMPREHENSIVE',
time_limit => 60,
task_name => 'my_sql_tuning_task_4',
description => 'Task to tune a query on a specified table' );
end;
/


SQL>
begin
DBMS_SQLTUNE.EXECUTE_TUNING_TASK (
task_name => 'my_sql_tuning_task_4' );
end;
/
2. SQL Tuning Advisor을 통해 얻은 결과(튜닝 레포트)를 확인하고 SQL Profile을 적용
SQL> SET LONG 70000
SQL> SET LONGCHUNKSIZE 1000
SQL> SET LINESIZE 100

-- 결과 보기! -> 메모장
SQL> select DBMS_SQLTUNE.REPORT_TUNING_TASK( 'my_sql_tuning_task_4') from DUAL;
- SQL profile 적용
SQL> DECLARE
my_sqlprofile_name VARCHAR2(30);
BEGIN
my_sqlprofile_name := DBMS_SQLTUNE.ACCEPT_SQL_PROFILE ( task_name => 'my_sql_tuning_task_4', name => 'my_sql_profile2' );
END;
/
- 확인해보기
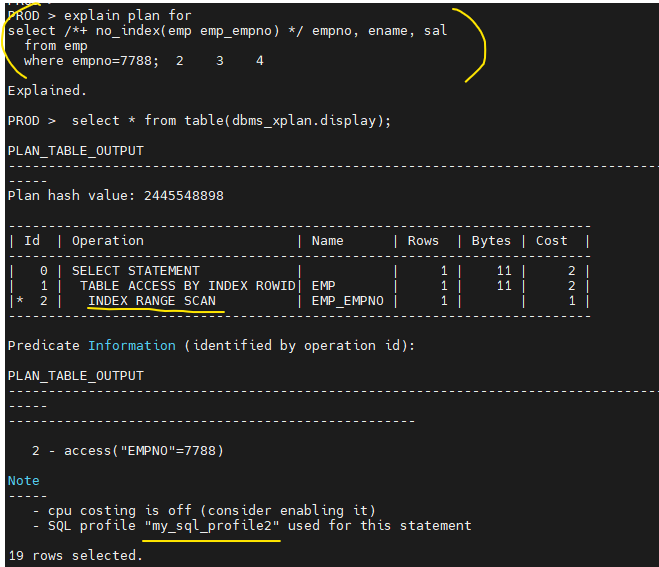
explain plan for
select /*+ no_index(emp emp_empno) */ empno, ename, sal
  from emp
  where empno=7788;

select * from table(dbms_xplan.display);
