Chart
소스코드
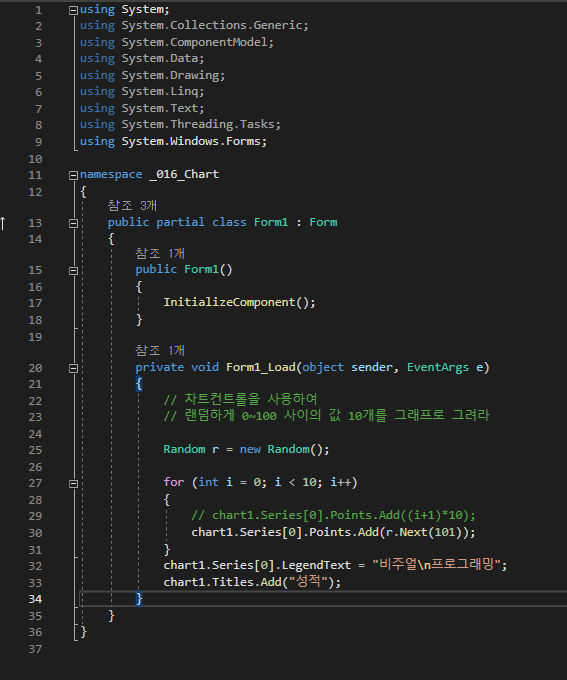
using System;
using System.Collections.Generic;
using System.ComponentModel;
using System.Data;
using System.Drawing;
using System.Linq;
using System.Text;
using System.Threading.Tasks;
using System.Windows.Forms;
namespace _016_Chart
{
public partial class Form1 : Form
{
public Form1()
{
InitializeComponent();
}
private void Form1_Load(object sender, EventArgs e)
{
// 차트컨트롤을 사용하여
// 랜덤하게 0~100 사이의 값 10개를 그래프로 그려라
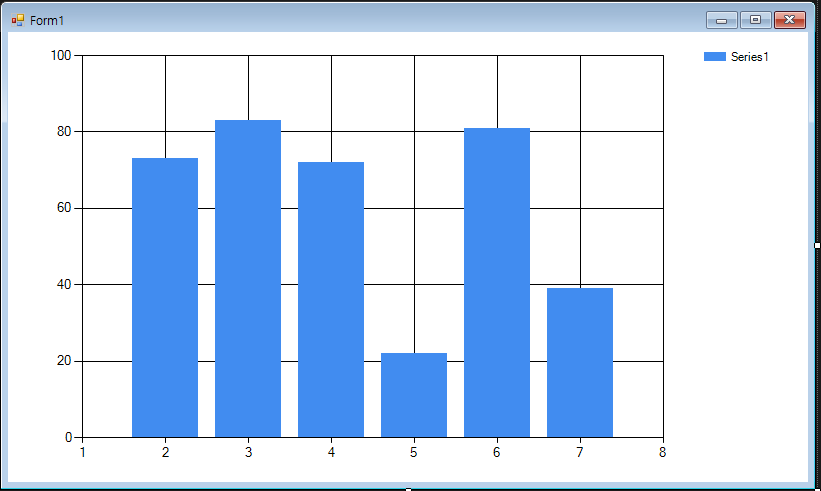
Random r = new Random();
for (int i = 0; i < 10; i++)
{
// chart1.Series[0].Points.Add((i+1)*10);
chart1.Series[0].Points.Add(r.Next(101));
}
chart1.Series[0].LegendText = "비주얼\n프로그래밍";
chart1.Titles.Add("성적");
}
}
}
실행결과
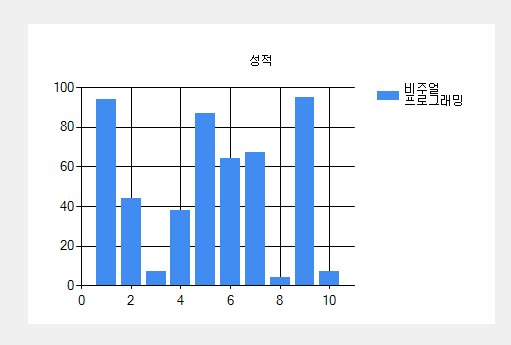
chart1.Series[0].LegendText = "비주얼\n프로그래밍"; 로 실행되면서
LegendText의 값이 변경된다.
chart1.Titles.Add("성적"); 로 차트의 타이틀이 추가된다.
twoCharts
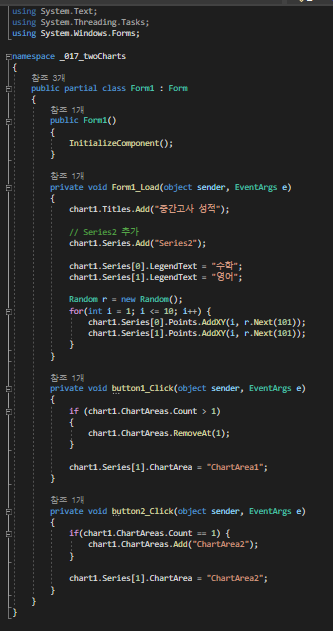
소스코드
using System;
using System.Collections.Generic;
using System.ComponentModel;
using System.Data;
using System.Drawing;
using System.Linq;
using System.Text;
using System.Threading.Tasks;
using System.Windows.Forms;

namespace _017_twoCharts
{
    public partial class Form1 : Form
    {
        public Form1()
        {
            InitializeComponent();
        }

        private void Form1_Load(object sender, EventArgs e)
        {
            chart1.Titles.Add("중간고사 성적");

            // Series2 추가
            chart1.Series.Add("Series2");

            chart1.Series[0].LegendText = "수학";
            chart1.Series[1].LegendText = "영어";

            Random r = new Random();
            for(int i = 1; i <= 10; i++) {
                chart1.Series[0].Points.AddXY(i, r.Next(101));
                chart1.Series[1].Points.AddXY(i, r.Next(101));
            }
        }

        private void button1_Click(object sender, EventArgs e)
        {
            if (chart1.ChartAreas.Count > 1)
            {
                chart1.ChartAreas.RemoveAt(1);
            }

            chart1.Series[1].ChartArea = "ChartArea1";
        }

        private void button2_Click(object sender, EventArgs e)
        {
            if(chart1.ChartAreas.Count == 1) {
                chart1.ChartAreas.Add("ChartArea2");
            }

            chart1.Series[1].ChartArea = "ChartArea2";
        }
    }
}
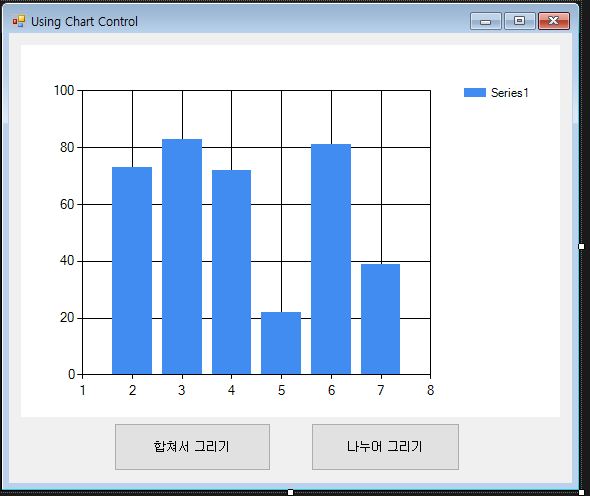
실행결과
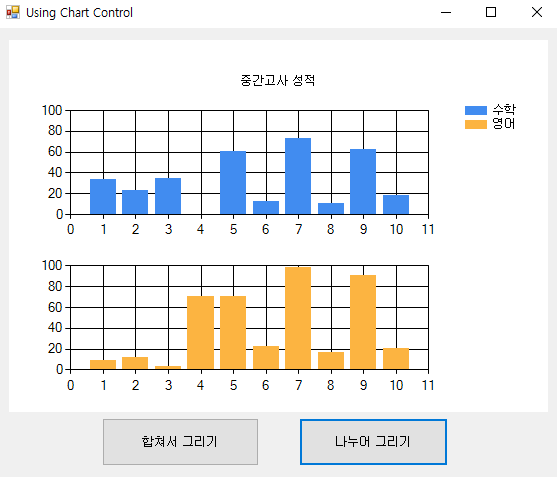
나누어 그리기를 누르면 private void button2_Click(object sender, EventArgs e) 함수가 실행되면서 Series의 ChartArea가 바뀐다.
mathGraph
소스코드
using System;
using System.Collections.Generic;
using System.ComponentModel;
using System.Data;
using System.Drawing;
using System.Linq;
using System.Text;
using System.Threading.Tasks;
using System.Windows.Forms;
using System.Windows.Forms.DataVisualization.Charting;
namespace _020_mathGraph
{
public partial class Form1 : Form
{
public Form1()
{
InitializeComponent();
}
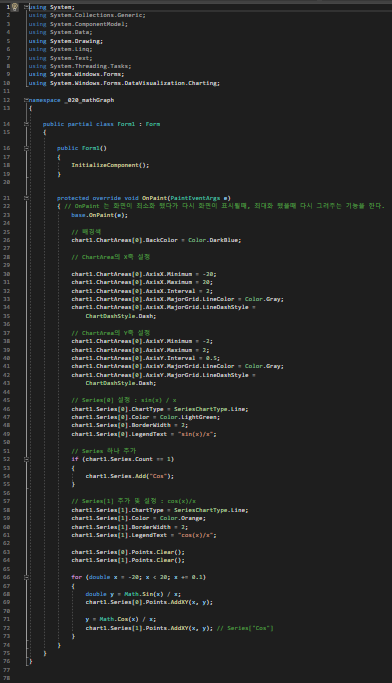
protected override void OnPaint(PaintEventArgs e)
{ // OnPaint 는 화면이 최소화 됐다가 다시 화면이 표시될때, 최대화 됐을때 다시 그려주는 기능을 한다.
base.OnPaint(e);
// 배경색
chart1.ChartAreas[0].BackColor = Color.DarkBlue;
// ChartArea의 X축 설정
chart1.ChartAreas[0].AxisX.Minimum = -20;
chart1.ChartAreas[0].AxisX.Maximum = 20;
chart1.ChartAreas[0].AxisX.Interval = 2;
chart1.ChartAreas[0].AxisX.MajorGrid.LineColor = Color.Gray;
chart1.ChartAreas[0].AxisX.MajorGrid.LineDashStyle =
ChartDashStyle.Dash;
// ChartArea의 Y축 설정
chart1.ChartAreas[0].AxisY.Minimum = -2;
chart1.ChartAreas[0].AxisY.Maximum = 2;
chart1.ChartAreas[0].AxisY.Interval = 0.5;
chart1.ChartAreas[0].AxisY.MajorGrid.LineColor = Color.Gray;
chart1.ChartAreas[0].AxisY.MajorGrid.LineDashStyle =
ChartDashStyle.Dash;
// Series[0] 설정 : sin(x) / x
chart1.Series[0].ChartType = SeriesChartType.Line;
chart1.Series[0].Color = Color.LightGreen;
chart1.Series[0].BorderWidth = 2;
chart1.Series[0].LegendText = "sin(x)/x";
// Series 하나 추가
if (chart1.Series.Count == 1)
{
chart1.Series.Add("Cos");
}
// Series[1] 추가 및 설정 : cos(x)/x
chart1.Series[1].ChartType = SeriesChartType.Line;
chart1.Series[1].Color = Color.Orange;
chart1.Series[1].BorderWidth = 2;
chart1.Series[1].LegendText = "cos(x)/x";
chart1.Series[0].Points.Clear();
chart1.Series[1].Points.Clear();
for (double x = -20; x < 20; x += 0.1)
{
double y = Math.Sin(x) / x;
chart1.Series[0].Points.AddXY(x, y);
y = Math.Cos(x) / x;
chart1.Series[1].Points.AddXY(x, y); // Series["Cos"]
}
}
}
}
실행결과
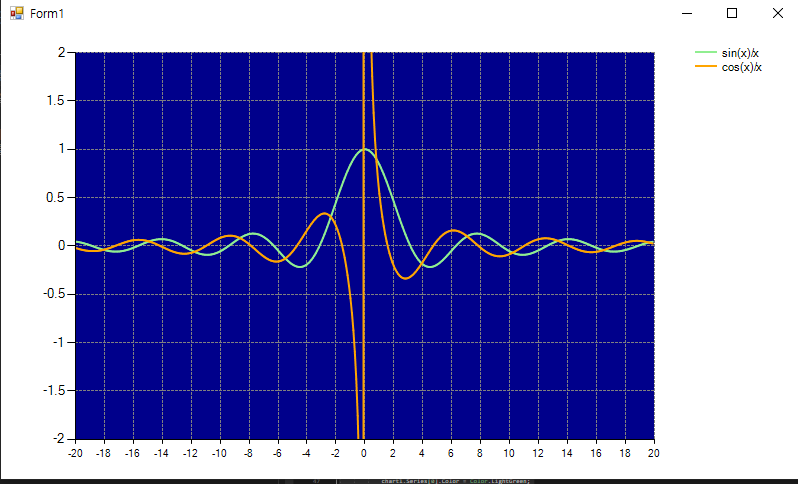
chart1.Series[0].Points.Clear();
chart1.Series[1].Points.Clear(); 를 통해 그래프가 정상적으로 그려질 수 있도록 한다.
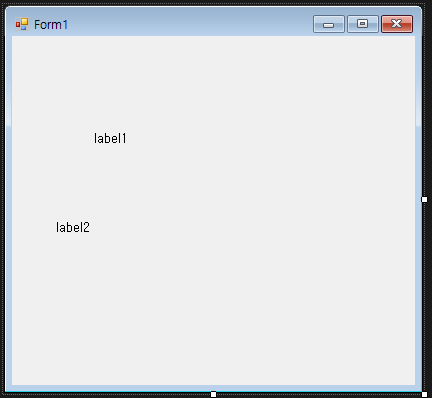
DigitalClock
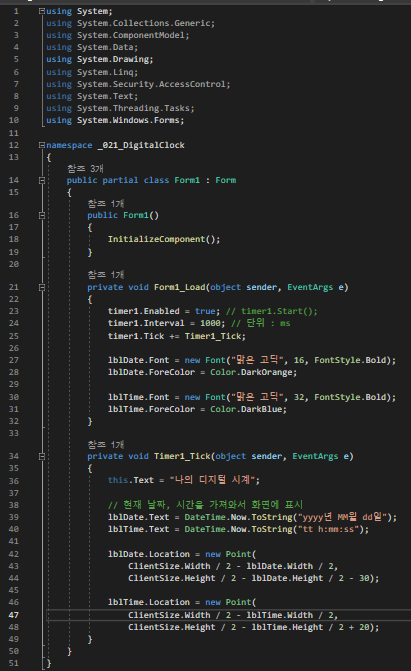
소스코드
using System;
using System.Collections.Generic;
using System.ComponentModel;
using System.Data;
using System.Drawing;
using System.Linq;
using System.Security.AccessControl;
using System.Text;
using System.Threading.Tasks;
using System.Windows.Forms;

namespace _021_DigitalClock
{
    public partial class Form1 : Form
    {
        public Form1()
        {
            InitializeComponent();
        }

        private void Form1_Load(object sender, EventArgs e)
        {
            timer1.Enabled = true; // timer1.Start();
            timer1.Interval = 1000; // 단위 : ms
            timer1.Tick += Timer1_Tick;

            lblDate.Font = new Font("맑은 고딕", 16, FontStyle.Bold);
            lblDate.ForeColor = Color.DarkOrange;

            lblTime.Font = new Font("맑은 고딕", 32, FontStyle.Bold);
            lblTime.ForeColor = Color.DarkBlue;
        }

        private void Timer1_Tick(object sender, EventArgs e)
        {
            this.Text = "나의 디지털 시계";

            // 현재 날짜, 시간을 가져와서 화면에 표시
            lblDate.Text = DateTime.Now.ToString("yyyy년 MM월 dd일");
            lblTime.Text = DateTime.Now.ToString("tt h:mm:ss");

            lblDate.Location = new Point(
                ClientSize.Width / 2 - lblDate.Width / 2,
                ClientSize.Height / 2 - lblDate.Height / 2 - 30);

            lblTime.Location = new Point(
                ClientSize.Width / 2 - lblTime.Width / 2,
                ClientSize.Height / 2 - lblTime.Height / 2 + 20);
        }
    }
}
실행결과
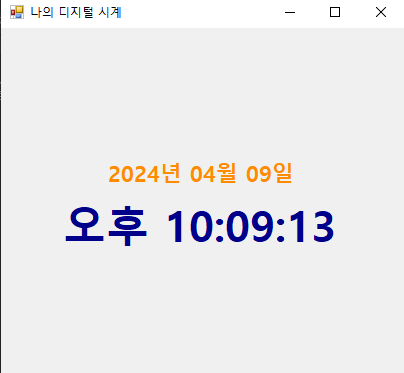
new Font("맑은 고딕", 16, FontStyle.Bold);를 통해 코드로 폰트를 지정할 수 있다.
lblDate.ForeColor = Color.DarkOrange;
Label.ForeColor로 직접 Color를 지정할 수 있다.
DateTime.Now.ToString("yyyy년 MM월 dd일"); 은 현재 시간을 불러올 수 있게 한다.
yyyy는 연도, MM은 월, dd는 일을 보여준다.
        lblDate.Location = new Point(
            ClientSize.Width / 2 - lblDate.Width / 2,
            ClientSize.Height / 2 - lblDate.Height / 2 - 30);

        lblTime.Location = new Point(
            ClientSize.Width / 2 - lblTime.Width / 2,
            ClientSize.Height / 2 - lblTime.Height / 2 + 20);

          // 이 부분에서 두 레이블의 위치가 겹치면
          // 하나는 올바르게 출력되지 않을 수 있기 때문에 유의해서 위치를 지정해야함.