교육 정보
- 교육 명: 경기미래기술학교 AI 교육
- 교육 기간: 2023.05.08 ~ 2023.10.31
- 오늘의 커리큘럼: 빅데이터 기초 활용 역량 강화 (5/10~6/9) - 데이터 분석
- 강사: 조미정 강사님 (빅데이터, 머신러닝, 인공지능)
- 강의 계획:
1. 파이썬 언어 기초 프로그래밍
2. 크롤링 - 데이터 분석을 위한 데이터 수집(파이썬으로 진행)
3. 탐색적 데이터 분석, 분석 실습
- 분석은 파이썬만으로는 할 수 없으므로 분석 라이브러리/시각화 라이브러리를 통해 분석
4. 통계기반 데이터 분석
5. 미니프로젝트
1. Pandas
1.1 Pandas의 개념
- 파이썬 데이터 처리에서 가장 인기 있는 라이브러리
- 2차원 데이터를 효율적으로 가공/처리 할 수 있는 기능들을 제공
- 주요 개념들
- index : RDBMS의 PK처럼 개별 데이터를 고유하게 식별하는 key값
- Serise : 칼럼이 하나뿐인 구조체
- DataFrame : 2차원 데이터 구조체, 여러개의 Serise 로 이루어져있음
1.2 Pandas 기본 문법
https://pandas.pydata.org/pandas-docs/stable/user_guide/10min.html
공식에서 제공하는 유저 가이드✏️ import
import pandas as pd
# 일반적으로 pd로 많이 불러옴
✏️ 파일 읽어오기
titanic_df = pd.read_csv("/content/titanic.csv")
# 경로를 지정하여 파일을 읽어와서 변수에 저장
✏️ 시리즈 생성
- series = index + value
s= pd.Series(['a','b','c'])
print(s)
#
# 결과
0    a
1    b
2    c
dtype: object
✏️ 데이터 프레임 생성
- DataFrame = index + value + "columns"
df1 = pd.DataFrame([1,2,3,4])
print(df1)
#
# 결과
   0
0  1
1  2
2  3
3  4
- 다중리스트 사용
lista = [[1,2,3],[4,5,6]]
df2 = pd.DataFrame(lista)
print(df2)
df3 = pd.DataFrame(lista, columns = ['col1', 'col2', 'col3'])
print(df3)
#
# 결과
   0  1  2
0  1  2  3
1  4  5  6
   col1  col2  col3
0     1     2     3
1     4     5     6
- 딕셔너리 사용
dict1 = {'col1':[1,2,3,4,5],'col2':[5,6,7,8,9]}
df4 = pd.DataFrame(dict1)
print(df4)
#
# 결과
col1	col2
0	1	5
1	2	6
2	3	7
3	4	8
4	5	9
✏️ Column
- 열 추출: df[컬럼명]
- 열 생성: df[새로 만들 컬럼명] = Value
- 열 수정: df[수정할 컬럼명] = 수정할 Value
titanic_df[["Pclass","Survived"]]
#열 추출
titanic_df['Age_0']=0
#열 생성
titanic_df['Age_0'] = titanic_df['Age']*10
#열 수정
✏️ 데이터 삭제
# 데이터프레임.drop('컬럼명', axis = 0)
axis 옵션이 0이면 행, 1이면 열(default = 0) -> 애가 행인지 열인지 구분을 못해서 지정해줘야 함
print(titanic_df.shape)
titanic_df.drop("Age_0", axis=1)
# 해당 데이터를 삭제한 데이터 프레임을 리턴하지만 원본에서 삭제하는것은 아님
# →칼럼을 원본 데이터 프레임에서 삭제 하는 방법
# 1. inplace 옵션을 True로 줌
titanic_df.drop("Age_0", axis = 1, inplace=True)
# 2. 원본 데이터프레임에 재 할당
titanic_df = titanic_df.drop("Age_0", axis = 1)
✏️ 데이터 선택(iloc) - 위치기반
- iloc[행인덱스, 열인덱스] 연산자 (함수가 아니라 연산자임, 대괄호 사용)
- 위치 기반 인덱싱만 허용
- 행과 열 값으로 integer형만 허용
titanic_df.iloc[0:5]
#인덱스의 value를 참조하지 않고 위치로 참조한것
titanic_df.iloc[0:5, 1]
#하나만 할거면 이렇게도 되고
titanic_df.iloc[0:5, 0:3]
#두개이상 할거면 슬라이싱
titanic_df.iloc[[1,2,3,6], [1,3,5]]
#이어져있지 않은 여러개의 행 혹은 열을 조회하고 싶을때는 하나의 데이터로 (리스트로)만들어서 넣어주면 됨
✏️ 데이터 선택(loc) - 인덱스값(이름) 기반
- loc[행조건, 열조건] ❗️하나만 넣으면 행조건이 기본
- 명칭 기반 데이터 추출 (위치기반인 iloc이랑 다름)
- 행 위치에는 DataFrame index 값을, 열 위치에는 컬럼명을 입력
titanic_df.loc[4]
# 인덱스 값이 4인 행 출력
titanic_df.loc[0:11, ['Age','Name']]
# 인덱스 0~11, column 지정
titanic_df.loc[5,'Name']
# 행 인덱스가 5이고 열 인덱스는 'Name'인 값을 출력
✏️ 데이터선택 - 조건
# 승객 중 나이(Age)가 65세 이상인 데이터를 추출
titanic_df['Age']>=65
# 내가 건 조건에 대해 True False 리턴
titanic_df[titanic_df['Age']>=65]
# 내가 건 조건에 대해 True인 **값**을 리턴
titanic_df.loc[titanic_df['Age']>=65,["Name","Age"]]
# 내가 건 조건에 대해 True인 행에서 'Name', 'Age'값을 리턴
- 여러 조건을 가지는 경우
여러 조건을 가지는 경우 조건은 ()안에 작성
titanic_df[(titanic_df['Age']>=60) & (titanic_df['Sex']=='female') & (titanic_df['Pclass']==1)]
# 혹은 조건들을 변수에 할당
con1=titanic_df['Age']>=60
con2=titanic_df['Sex']=='female'
con3=titanic_df['Pclass']==1
titanic_df[con1 & con2 & con3]
- 특정 값을 지정하고 싶은 경우 isin()
print(titanic_df[titanic_df['Embarked'].isin(["S", "C"])])
# 값이 S, C인 항목 출력
✏️ sort_values
titanic_df.sort_values("Fare",ascending = False)
# Fare 컬럼을 참조하여 정렬
titanic_df.sort_values(["Pclass", "Name"], ascending =[True, False])
# 여러개의 컬럼을 참조하여 정렬
✏️ Aggregation 함수 적용
- min(), max(), sum(), count()
titanic_df.count()
# 모든 컬럼의 카운트 (None 제외)
titanic_df["Age"].count()
# 컬럼 지정하여 카운트
titanic_df[['Age','Fare']].mean()
# 컬럼의 평균을 출력.
titanic_df[["Age","Fare"]].median()
# 중간값 출력
titanic_df["Embarked"].unique()
# 중복제거한 값 출력
✏️ groupby() 적용
titanic_grouped = titanic_df.groupby("Pclass") # 반환된 결과에 aggregation 함수를 호출하면 다른 모든 칼럼에 aggregation 함수 적용titanic_df.groupby("Pclass").count() # 특정 칼럼만 적용하려면 DataFrameGroupBy 객체에 해당 칼럼을 필터링한 뒤 aggregation함수 적용 titanic_df.groupby("Pclass")[["Age", "Name"]].count()# 여러 aggregation 함수를 사용할 경우 # DataFrameGroupBy 객체에 agg() 를 적용해 동일하게 구현 titanic_df.groupby('Pclass').agg("count") # titanic_df.groupby("Pclass").count() 이 코드와 동일!# 컬럼 지정도 가능 titanic_df.groupby('Pclass')[["Age", "Fare"]].agg("count") titanic_df.groupby('Pclass').agg("count") titanic_df.groupby("Pclass").count()# 위 두 코드가 같으면 agg는 왜 쓰는가? #적용하고자 하는 함수가 여러개일떄 리스트로 여러개의 함수를 적용 할 수 있다. titanic_df.groupby('Pclass')["Age"].agg(['count','min', 'max', 'mean']) # agg() 내에 입력값으로 딕셔너리 형태로 aggregation이 적용될 칼럼들과 함수 입력 # -> 각각의 함수를 어디 컬럼에 적용할지 지정 하겠다 agg_format = {'Age':'max', 'SibSp':'sum', 'Fare':'mean'} titanic_df.groupby('Pclass').agg(agg_format)# 여러 aggregation 함수를 사용할 경우 #'Pclass'로 그룹하고 'Age'컬럼에 대해서 'max','min','mean','sum'을 모두 구합니다 #agg(['max','min','mean','sum']) titanic_df.groupby("Pclass")["Age"].agg(['max','min','mean','sum'])✏️ 결손데이터 처리
- 결손데이터는 칼럼에 값이 없는, 즉 NULL 인 경우를 의미, 넘파이의 NaN으로 표시
- 머신러닝하기전에 결손데이터는 대체를 하던지 사용을 포기하던지 처리해줘야 함
- isna() 로 NaN 여부 확인, isnull()
# 9-1 isna()사용
titanic_df.info()
titanic_df.isna() # 모든 값에 대해서 NA인지 아닌지 bool값으로 출력해줌
titanic_df.isnull() # 이것도 가능
titanic_df.isnull().sum() # 값을 더해서 볼수도 있음
- 결손데이터 대체하기 fillna("채워줄 값")
titanic_df["Embarked"].value_counts()
# 갯수 세어보니까 s가 가장 많으니까 이값일 확률이 크다고 판단-> 이걸로 fill 해주기
titanic_df['Embarked'] = titanic_df['Embarked'].fillna("S")
titanic_df['Embarked'].fillna("S",inplace=True)
# NA를 S로 채워주고 원본 업데이트
titanic_df['Embarked'].isna().sum()
# 다시 NA값 세보면 없음
- NaN이 있는 행 제거하기 dropna()
titanic_df.dropna(subset="Age", inplace = True)✏️ apply lambda 식으로 데이터 가공
- df.apply(lambda x : x) 이용
titanic_df["Name"].apply(lambda x:len(x))
#lambda사용해서 이름 길이 구하기
titanic_df["Name_len"] = titanic_df["Name"].apply(lambda x:len(x))
#lambda사용해서 이름 길이 구하여 새로운 컬럼에 넣기
# 나이에 따라 세분화된 분류를 수행하는 함수 생성
def get_category(age):
    cat = ''
    if age <= 5 : cat = 'Baby'
    elif age <= 12 : cat = 'Child'
    elif age <= 18 : cat = 'Teenager'
    elif age <= 25 : cat = 'Student'
    else : cat = 'Adult'
# get_category값이 적용된  'Age_cat'컬럼을 생성.
titanic_df["Age_cat"] = titanic_df["Age"].apply(lambda x : get_category(x))
✏️ pivot_table
- excel의 피벗테이블과 비슷한 기능
- 행인덱스, 열인덱스, 데이터값, 데이터집계함수
- 데이터프레임.pivot_table(index=행인덱스,columns= 열인덱스, values= 데이터값,aggfunc=집계함수)
# 행: pclass, 열 : sex , age 평균값
pt1 = pd.pivot_table(titanic_df,
               index="Pclass",
               columns="Sex",
               values="Age",
               aggfunc="mean")
# 행: pclass, 열 : sex , Survived 비율-> mean
pt2 = pd.pivot_table(titanic_df,
               index="Pclass",
               columns="Sex",
               values="Survived",
               aggfunc=["mean", 'count','sum'])
✏️ 합치기
- concat
- pd.concat([데이터프레임1, 데이터프레임2])
- pd.concat([데이터프레임1, 데이터프레임2],axis=1)
→ 잘 사용하지 않음# 단순합치기. concat df_1 = pd.DataFrame({ '고객번호' : [100,101,102,103,104,105,106], '이름' : ['재석','봉선','하하','미주','준하','진주','이경'] }) df_2 = pd.DataFrame({ '고객번호' : [111,112,113,114], '이름' : ['현주','창식','해인','미정'], '금액' : [10000,20000,15000,5000] })
- merge
- pd.merge(left, right, on=컬럼명,how=)
- 예시 데이터
cust = pd.DataFrame({
     '고객번호' : [1001,1002,1003,1004,1005,1006,1007],
     '이름' : ['재석','봉선','하하','미주','준하','진주','이경']
     })
order = pd.DataFrame({
    '고객번호' : [1001,1001,1005,1006,1008,1001],
    '금액' : [10000,20000,15000,5000,100000,30000]
    })
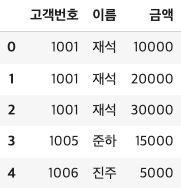
- 두개의 데이터에 모두 존재하는 고객번호를 기준으로 merge
df_merge = pd.merge(cust, order, on="고객번호")
# 두 데이터 프레임에 모두 값이 있을때만 리턴 → 교집합
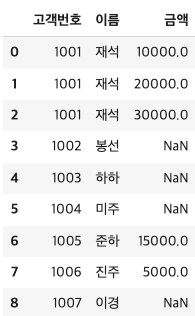
- 왼쪽 데이터 프레임의 값이 다 나오게 하고싶을 때
df_merge2 = pd.merge(cust, order, on = "고객번호",how = "left")
# 왼쪽 테이블인cust를 전체 다 나오게 함
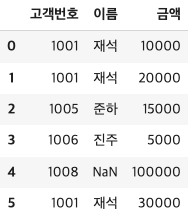
- 오른쪽 데이터 프레임의 값이 다 나오게 하고싶을 때
df_merge3 = pd.merge(cust, order, on = "고객번호",how = "right")
# 오른쪽 테이블인 order를 전체 다 나오게 함

:D