🏆 학습 목표
- 퍼셉트론(Perceptron)을 이해하고 python으로 구현할 수 있다.
- 신경망(Neural Network)의 원리를 이해하고 기본적인 구조 그림을 바탕으로 신경망을 설명할 수 있다.
- 신경망이 학습된다는 개념을 이해하고 프레임워크(keras)를 활용하여 아주 기본적인 신경망을 만들 수 있다.
퍼셉트론(Perceptron)

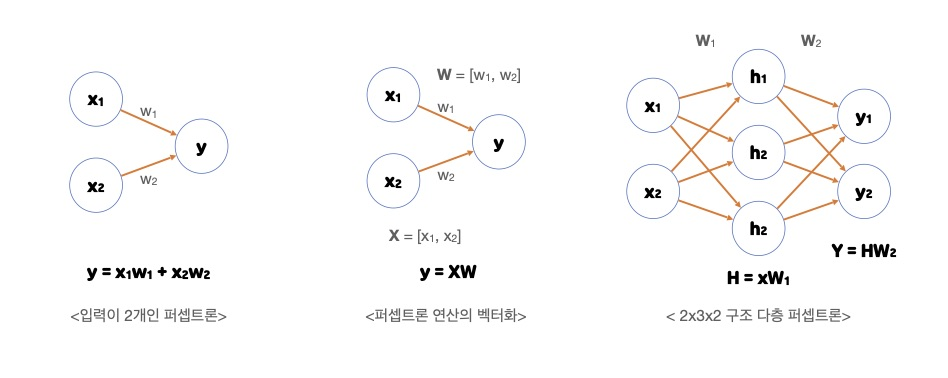
- 하나의 노드(뉴런)으로 이루어진 신경망의 기본 구조
- 인간 뇌의 뉴런을 모사하여 만들어진 신경망의 기본 단위
- 다수의 입력값을 받아 하나의 출력값을 내보냄
- 입력값에 가중치(와 편향)가 곱해진 값을 모두 더하는 연산, 즉 선형 결합을 하고
활성화 함수를 적용한 후 그 값을 출력
- 프랑크 로젠블라트(Frank Rosenblatt)가 1957년 고안한 알고리즘
- 신경망(딥러닝)의 기원이 되는 알고리즘
- 전류가 전선을 타고 흐르듯이 입력 데이터와 가중치가 연산의 흐름을 만들어 정보를 계속해서 전달
- '흐른다' 또는 '안 흐른다'로 1과 0의 값 중 하나를 가질 수 있다.
- 가중치는 신호를 얼마나 흘려 줄지를 결정하며 클수록 강한 신호를 흘려보낸다.
논리게이트로 본 퍼셉트론
AND GATE
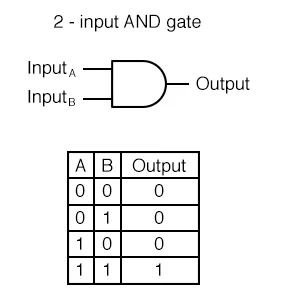
입력 신호가 모두 1(True)일 때 1(True) 출력
# w1, w2 => 가중치(weight)를 의미하는 변수
# theta : threshold

def AND(x1, x2):
    w1, w2, theta = 0.5, 0.5, 0.7
    tmp = x1*w1 + x2*w2

    if tmp <= theta:
        return 0
    else:
        return 1

print(AND(0, 0))	# 0
print(AND(1, 0))	# 0
print(AND(0, 1))	# 0
print(AND(1, 1))	# 1
NAND GATE
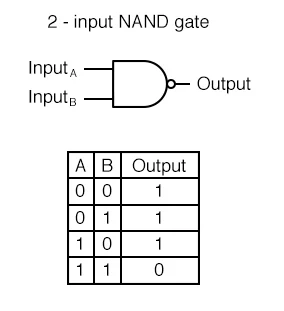
Not AND의 줄임말로 AND GATE 결과의 반대 출력
def NAND(x1, x2):
    """
    AND GATE 의 코드에서 어떤 부분이 변화되었을까요? > return값
    """
    w1, w2, theta = 0.5, 0.5, 0.7
    tmp = x1*w1 + x2*w2

    if tmp <= theta:
        return 1
    else:
        return 0

print(NAND(0, 0))	# 1
print(NAND(1, 0))	# 1
print(NAND(0, 1))	# 1
print(NAND(1, 1))	# 0
OR GATE
입력 신호 중 하나만 1(True)이라도 1(True) 출력
def OR(x1, x2):
    """
    AND GATE의 코드에서 어떤 부분이 변화되었을까요? > theta값
    """
    w1, w2, theta = 0.5, 0.5, 0.3
    tmp = x1*w1 + x2*w2

    if tmp <= theta:
        return 0
    else:
        return 1

print(OR(0, 0))	  # 0
print(OR(1, 0))	  # 1
print(OR(0, 1))	  # 1
print(OR(1, 1))	  # 1
XOR GATE
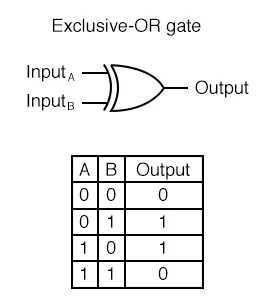
- 배타적 논리합(Exclusive-OR)이라고도 불리는 GATE
- 입력 신호가 다를 경우 1(True) 출력
AND(NAND(x1, x2), OR(x1, x2))
퍼셉트론의 한계
단순 선형인 경계로는 XOR에서 등장하는 점을 두 클래스로 완벽히 분류할 수 없다.(XOR 문제를 해결할 수 없다.)
신경망의 기본 구조
ANN(Artificial Neural Networks)_인공 신경망
- 실제 신경계의 특징을 모사하여 만들어진 계산 모델
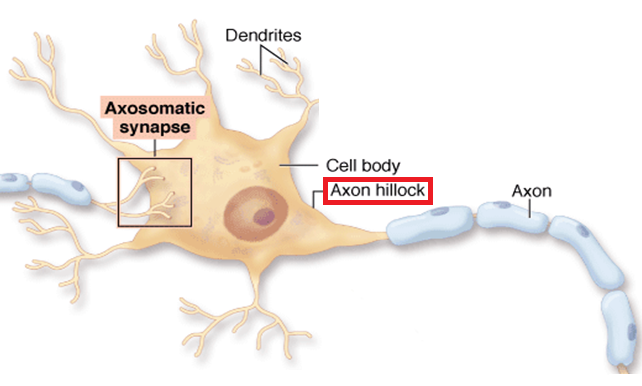
- 인공 신경망의 기본 구조인 퍼셉트론은 실제 뇌 신경망의 기본 구조인 뉴런(Neuron)을 모사하여 제작
- 최근에는 '뉴럴넷(Neural-Net)'으로 가장 많이 불리고 있다.
신경세포(Neuron)
- 수상 돌기(Dendrites)에서 입력 신호를 다른 뉴런으로부터 받아들임
- 받아들인 신호를 신경 세포 내에서 통합
- 임계값을 넘어서는 전류가 생기면 Axon Hillock이 축삭돌기(Axon)로 최종 출력 신호를 전송하여 다음 뉴런으로 전파
신경망 기본 형태 : 가중치, 편향 연산
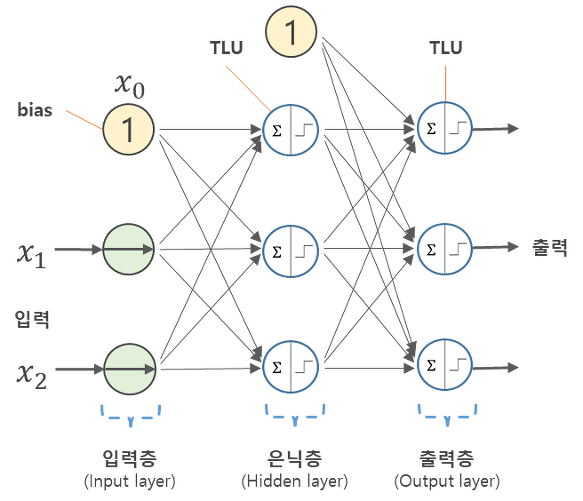
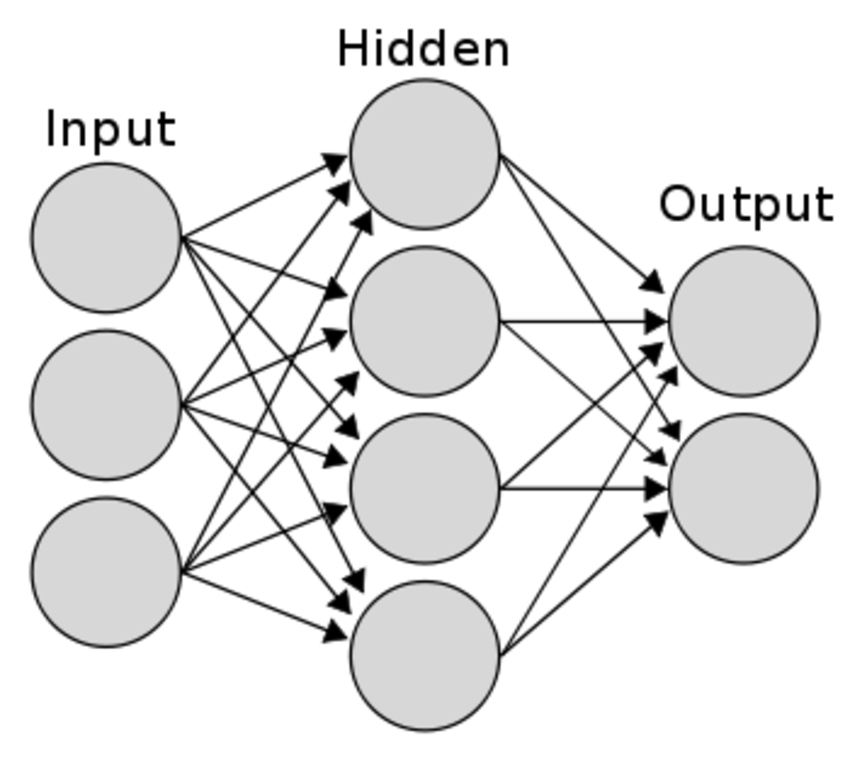
- 원으로 표현된 부분 = 뉴런(Neuron) / 노드(node)
- 노드의 역할

- 입력 신호( )가 입력되면 각각 고유한 가중치( )가 곱해집니다.
- 다음 노드에서는 입력된 모든 신호를 더해줍니다().
- 각 노드에서의 연산값이 정해진 임계값(Threshold Logic Unit)을 넘을 경우에만 다음 노드들이 있는 층(layer)으로 신호를 전달합니다. ->
활성화 함수 (Activation Function)
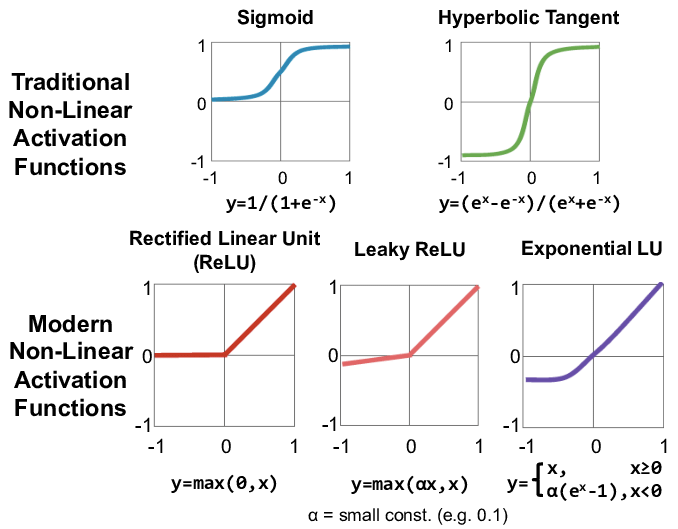
- 다음 층으로 신호를 얼마만큼 전달할지를 결정 (전달함수(Transfer function))
- 정해진 임계값을 넘을 경우에만 다음 노드들이 있는 층으로 신호를 전달하는 역할을 하는 함수
- 신호를 보정하는 역할
*값이 항상 0 또는 1인 것은 아니고 활성함수에 따라 달라진다.
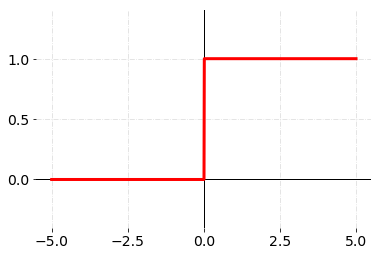
계단 함수(Step function)
입력 값이 임계값(여기서는 0)을 넘기면 1을 출력하고, 그렇지 않으면 0을 출력하는 함수
###python 코드
# 필요한 패키지를 import 해줍니다.
import numpy as np
import matplotlib.pyplot as plt
import math

# 입력할 샘플 데이터를 만들고 확인합니다.
x = np.array([-1, 1, 2])
print("input : ", x)

# 입력 값이 임계값(0)을 넘기는지 판단합니다.
y = x>0
print("Logic : ", y)

# 논리(boolean)형태를 정수형으로 바꾸어 0과 1로 나타냅니다.
y = y.astype(np.int)
print("Boolean : ", y)

>>> input :  [-1  1  2]
>>> Logic :  [False  True  True]
>>> Boolean :  [0 1 1]


### 함수
def step_function(x):
  return np.array(x>0, dtype=np.int)

# 함수가 제대로 만들어 졌는지 값을 출력해봅니다.
print(step_function(-1))	# 0
print(step_function(0.5))	# 1
print(step_function(500000))	# 1

# 구현한 계단 함수의 값을 바탕으로 그래프를 그려봅시다.
x = np.linspace(-1, 1, 100)
plt.step(x, step_function(x))
plt.show()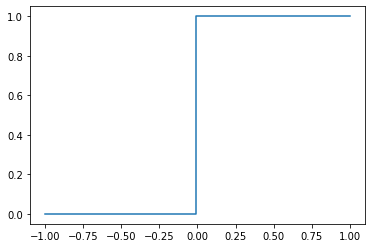
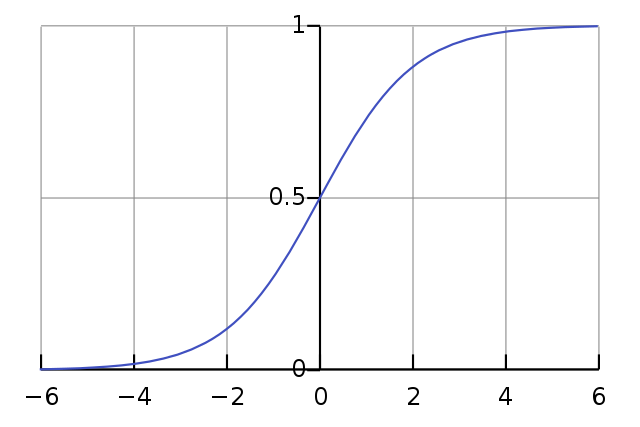
시그모이드 함수(Sigmoid function)
- 임계값 지점에서 미분이 불가능하고, 나머지 지점에서는 미분값이 0이 나오는 계단 함수의 단점을 해결하기 위해 사용된 함수
- 모든 지점에서 미분 가능하며, 미분값도 0이 아니다.
def sigmoid(x):
  return 1/ (1+np.exp(-x))

x = np.array([-5, -1, 0, 0.1, 5, 500000])
print(sigmoid(x))
# [0.00669285 0.26894142 0.5        0.52497919 0.99330715 1.        ]

x = np.linspace(-10, 10, 100)

plt.plot(x, sigmoid(x))
plt.xlabel("x")
plt.ylabel("Sigmoid(X)")

plt.show() 
ReLU 함수
실제로 많이 사용되는 활성화 함수
def ReLU(x):
    zero = np.zeros(len(x))
    return np.max([zero, x], axis=0)

x = np.arange(-3, 3, .1)
y = ReLU(x)

fig = plt.figure()
ax = fig.add_subplot(111)
ax.plot(x, y)
ax.set_ylim([-1.0, 3.0])
ax.set_xlim([-3.0, 3.0])
#ax.grid(True)
ax.set_xlabel('z')
ax.set_title('ReLU: Rectified linear unit')

plt.show()
fig = plt.gcf()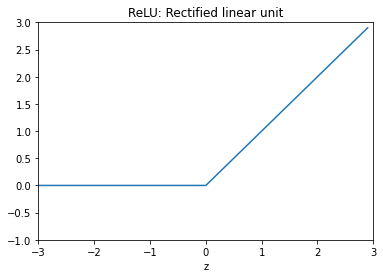
신경망 구현하기
1. 초기 상태 설정
가중치와 편향의 값은 우선 임의의 값으로 지정
# 네트워크 구조 생성 함수 정의
def init_network():
    """
    W1,W2 : 가중치
    B1,B2 : 편향
    값은 일단 마음대로 지정한 값이니 신경쓰지 않으셔도 됩니다.
    """
    network = {}
    network['W1'] = np.array([[0.1, 0.3, 0.5, 0.7], [0.1, 0.3, 0.3, 0.7], [0.2, 0.1, 0.6, 0.8]]) # 3 x 4
    network['B1'] = np.array([0.11, 0.12, 0.13, 0.14]) # 4개
    network['W2'] = np.array([[0.1, 0.5], [0.2, 0.6], [0.3, 0.4], [0.35, 0.35]]) # 4 x 2
    network['B2'] = np.array([0.1, 0.5]) # 2개

    return network
2. 순전파(Feed Forward) 함수 정의
순전파 : 가중치와 편향의 연산을 반복하며 입력값을 받아 출력값으로 반환하는 과정
# 순전파 함수 정의
def forward(network, x):
  W1, W2 = network['W1'], network['W2']
  b1, b2 = network['B1'], network['B2']

  a1 = np.dot(x, W1) + b1
  z1 = sigmoid(a1)
  a2 = np.dot(z1, W2) + b2

  y = a2
  return y
3. 정의한 함수와 입력 데이터를 바탕으로 계산한 값을 출력
# 네트워크 제작
network = init_network()

# 샘플 입력 데이터
x = np.array([1, 0.5, 0.7])

# 순전파 실행
y = forward(network, x)
print(y)
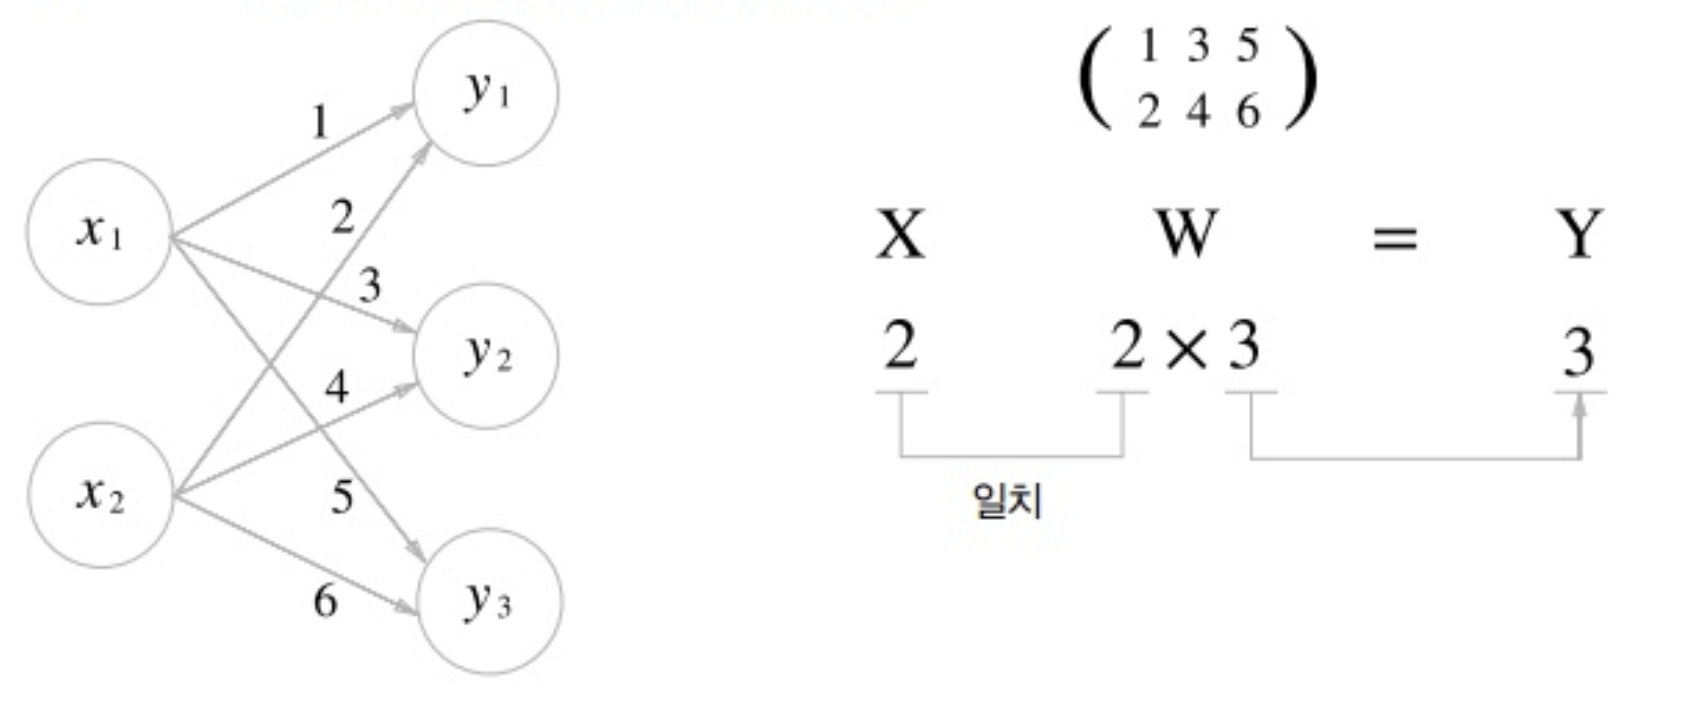

- 신경망 : 노드가 가중치로 연결되어 입력 신호와 연산한 뒤에 출력값으로 내보내는 함수
- 학습(Training, Learning) : 가중치를 지속하여 수정하면서 적절한 가중치를 찾는 과정
신경망의 각 층
입력층(Input Layer)
- 데이터셋이 입력되는 층
- 입력되는 데이터셋의 특성(Feature)에 따라 입력층 노드의 수가 결정
- 어떤 계산도 수행하지 않고 그냥 값들을 전달하기만 하는 특징이 있어 신경망의 층수(깊이, depth)를 셀 때 입력층은 포함하지 않는다.
은닉층(Hidden Layers)
- 입력층으로부터 입력된 신호가 가중치, 편향과 연산되는 층
- 입력층과 출력층 사이에 있는 층
- 계산의 결과를 사용자가 볼 수 없기 때문에 '은닉(Hidden)층'
- 입력 데이터셋의 특성 수와 상관 없이 노드 수를 구성할 수 있다.
- 딥러닝(Deep Learning) -> 2개 이상의 은닉층을 가진 신경망
출력층(Output Layer)
- 가장 마지막에 위치한 층이며 은닉층 연산을 마친 값이 출력되는 층
- 다중 분류(Multi-class Classification) : 소프트맥스(Softmax), 레이블의 클래스(Class) 수
- 이진 분류(Binary Classification)
- 출력층 노드 2개 (0,1) : softmax (확률)
- 출력층 노드 1개 (0/1) : sigmoid - 회귀 : 활성화 함수 지정X, 노드 수는 출력값의 특성(Feature) 수와 동일하게 설정
표현 학습(Representation Learning)
데이터에서 필요한 특성의 관계를 알아서 조합하여 찾아내는 신경망의 특징
Tensorflow 신경망 예제 : MNIST

가장 기본적인 이미지 분류(Image Classification) 예제로, 사람이 0-9까지 쓴 흑백 손글씨 숫자 이미지를 각 클래스로 분류합니다.
### 패키지 & 라이브러리
import pandas as pd
!pip install tensorflow-gpu==2.0.0-rc1
import tensorflow as tf


### 학습 데이터셋(Train Dataset), 시험 데이터셋(Test Dataset) Split
# 라이브러리 데이터셋을 불러옵니다.
mnist = tf.keras.datasets.mnist

# Training Set, Test Set을 분류해줍니다.
(x_train, y_train), (x_test, y_test) = mnist.load_data()

# Value normalization(정규화)을 수행합니다.
x_train, x_test = x_train / 255.0, x_test / 255.0

# 데이터의 레이블 구성 형태를 살펴봅니다.
# 처음보는 데이터의 경우 데이터 자체를 디스플레이 하여 보면 도움이 됩니다.
pd.unique(y_train)
# array([5, 0, 4, 1, 9, 2, 3, 6, 7, 8], dtype=uint8)

# 신경망 모델 구축
model = tf.keras.models.Sequential([
  tf.keras.layers.Flatten(input_shape=(28, 28)),
  tf.keras.layers.Dense(100, activation='relu'),
  tf.keras.layers.Dropout(0.2), # 과적합(Overfitting) 방지 역할
  tf.keras.layers.Dense(10, activation='softmax')
])

# 구축한 모델을 컴파일하며, 옵티마이저, loss function 등을 설정해줍니다.
# 컴파일 : 모델을 학습시키기 위한 학습과정 설정 단계
model.compile(optimizer='adam',  # 훈련과정 / 함수를 최적화하는 방향으로 학습이 일어나는 함수 설정
              loss='sparse_categorical_crossentropy', # 손실함수
              metrics=['accuracy']) # 훈련과정을 모니터링하는 방식

# 모델이 학습 하는 부분
model.fit(x_train, y_train, epochs=5) # epoch의 수를 변화시키면 더 많이 학습하거나 적게 학습할 수 있습니다.

# 만들어진 모델을 이용하여 예측하는 부분
model.evaluate(x_test,  y_test, verbose=2)
Python으로 직접 만드는 신경망
1. 입력 데이터 생성
# 랜덤 시드(Random Seed)를 고정합니다.
np.random.seed(405)

# X: 입력(inputs)
X = np.array([
    [0, 0]
    ,[0, 1]
    ,[1, 0]
    ,[1, 1]
])

# 편향(bias)
b = 1

# Y: 타겟값(target, correct outputs)
Y= np.array([[0],[1],[1],[1]])
2. 활성화 함수인 시그모이드(Sigmoid) 함수와 그 도함수를 구현
# 시그모이드 함수
# net: 입력과 가중치의 가중합
def sigmoid(net):
    return 1 / (1 + np.exp(-net))

# 시그모이드 함수의 도함수 유도 예시
# https://towardsdatascience.com/derivative-of-the-sigmoid-function-536880cf918e
def sigmoid_prime(net):
    sig = sigmoid(net)
    return sig * (1 - sig)


# 시그모이드 함수가 잘 생성되었는지 그래프를 출력해봅시다.
x_range = np.arange(-10., 10., 0.2)
y_range = np.array([sigmoid(x) for x in x_range])
y_prime = np.array([sigmoid_prime(x) for x in x_range])

plt.plot(x_range, y_range, label='sigmoid')
plt.plot(x_range, y_prime, label='sigmoid_prime')
plt.legend()
plt.show();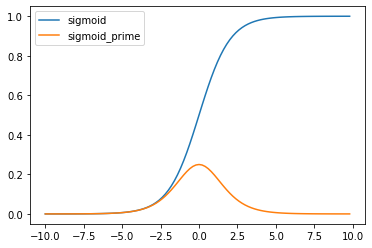
3. 초기 가중치는 무작위(Random)로 지정
# W: [w0, w1]
W = 2 * np.random.rand(2,1) - 1
W
"""
array([[ 0.40316676],
       [-0.44345216]])
"""
4. 입력 데이터와 가중치 연산
# Z: 신호에 가중치와 편향을 연산해 준 결과
Z = np.dot(X, W) + b
Z
"""
array([[1.        ],
       [0.55654784],
       [1.40316676],
       [0.9597146 ]])
"""
5. 활성화 함수를 적용한 뒤 나오는 값(output) 출력
# A: 출력(activated outputs)
A = sigmoid(Z)
A
"""
array([[0.73105858],
       [0.6356534 ],
       [0.80268592],
       [0.72306466]])
"""
6. 미분한 값을 코드로 구현
=> 출력 오차를 줄이기 위한 역전파(경사하강법 이용)
- 경사 하강법(Gradient descent) : 손실 값이 최소가 되는 가중치(weight)를 찾는 방법
- 역전파 알고리즘 : 경사 하강법에 필요한 미분값을 빠르고 효율적으로 찾는 알고리즘
da= (MSE를 미분하여 나오는 값)dz=dw,db= 각각 가중치(weight), 편향(bias) 업데이트 값
da = A - Y
dz = da * sigmoid_prime(Z)
dw = np.dot(X.T, dz)
db = np.sum(da, keepdims=True)

print("dz : \n", dz, "\n")
print("dw : \n", dw, "\n")
print("db : \n", db, "\n")
"""
dz :
 [[ 0.14373484]
 [-0.084382  ]
 [-0.03125085]
 [-0.05545413]]

dw :
 [[-0.08670498]
 [-0.13983613]]

db :
 [[-0.10753744]]
"""

print("기존 가중치: \n", W, "\n")
"""
기존 가중치:
 [[ 0.40316676]
 [-0.44345216]]
"""
7. 가중치와 편향 업데이트
# 가중치 업데이트(batch)
W += dw
b += db

print("업데이트 후 가중치: \n", W, "\n")
print("업데이트 후 bias: \n", b, "\n")

"""
업데이트 후 가중치:
 [[ 0.31646178]
 [-0.58328829]]

업데이트 후 bias:
 [[0.89246256]]
"""

>**8. 이 과정을 반복하여 최적의 가중치를 찾기**

```python
# 이미 입력 데이터와 타겟 출력은 윗 부분에서 선언 하였습니다.

# 가중치 초기화
# W = 2 * np.random.random((2,1)) - 1
W = np.random.randn(2,1)
# W = np.zeros((2,1))

b = 0

print('학습 전 가중치: \n', W)

# 가중치 업데이트를 10,000회 (10,000 epoch) 진행하겠습니다.

for iteration in range(1000):

    # 순방향 전파
    Z = np.dot(X, W) + b
    A = sigmoid(Z)

    # 역방향 전파(기울기 계산)
    da = Y - A
    dz = da * sigmoid_prime(Z)
    dw = np.dot(X.T, dz)
    db = np.sum(da, keepdims=True)

    W += dw
    b += db

print('학습 후 가중치: \n', W, "\n")
print('학습 후 bias: \n', b, "\n")
print('학습 후 예측값: \n', A.round(3), "\n")
"""
학습 전 가중치:
 [[-0.79003947]
 [ 0.6826574 ]]
학습 후 가중치:
 [[5.92060487]
 [5.92082351]]

학습 후 bias:
 [[-2.59025899]]

학습 후 예측값:
 [[0.07 ]
 [0.965]
 [0.965]
 [1.   ]]
"""
Iris 데이터를 퍼셉트론으로 분류하기
### 1. 필요한 패키지를 import 하고 Iris 데이터셋 불러오기
import pandas as pd
import numpy as np
import matplotlib.pyplot as plt

# iris 데이터를 DataFrame 형태로 불러옵니다.
df = pd.read_csv('https://archive.ics.uci.edu/ml/machine-learning-databases/iris/iris.data', header=None)

df.head()
df.head()


### 2. 데이터 전처리(Preprocessing) 및 시각화(Visualization)
# 50 setosa, 50 versicolor 데이터만 사용하여 이진 분류(Binary Classification) 문제를 풀어보겠습니다.

y = df.iloc[0:100, 4].values
y
"""
array(['Iris-setosa', 'Iris-setosa', 'Iris-setosa', 'Iris-setosa',
       'Iris-setosa', 'Iris-setosa', 'Iris-setosa', 'Iris-setosa',
       'Iris-setosa', 'Iris-setosa', 'Iris-setosa', 'Iris-setosa',
       'Iris-setosa', 'Iris-setosa', 'Iris-setosa', 'Iris-setosa',
       'Iris-setosa', 'Iris-setosa', 'Iris-setosa', 'Iris-setosa',
       'Iris-setosa', 'Iris-setosa', 'Iris-setosa', 'Iris-setosa',
       'Iris-setosa', 'Iris-setosa', 'Iris-setosa', 'Iris-setosa',
       'Iris-setosa', 'Iris-setosa', 'Iris-setosa', 'Iris-setosa',
       'Iris-setosa', 'Iris-setosa', 'Iris-setosa', 'Iris-setosa',
       'Iris-setosa', 'Iris-setosa', 'Iris-setosa', 'Iris-setosa',
       'Iris-setosa', 'Iris-setosa', 'Iris-setosa', 'Iris-setosa',
       'Iris-setosa', 'Iris-setosa', 'Iris-setosa', 'Iris-setosa',
       'Iris-setosa', 'Iris-setosa', 'Iris-versicolor', 'Iris-versicolor',
       'Iris-versicolor', 'Iris-versicolor', 'Iris-versicolor',
       'Iris-versicolor', 'Iris-versicolor', 'Iris-versicolor',
       'Iris-versicolor', 'Iris-versicolor', 'Iris-versicolor',
       'Iris-versicolor', 'Iris-versicolor', 'Iris-versicolor',
       'Iris-versicolor', 'Iris-versicolor', 'Iris-versicolor',
       'Iris-versicolor', 'Iris-versicolor', 'Iris-versicolor',
       'Iris-versicolor', 'Iris-versicolor', 'Iris-versicolor',
       'Iris-versicolor', 'Iris-versicolor', 'Iris-versicolor',
       'Iris-versicolor', 'Iris-versicolor', 'Iris-versicolor',
       'Iris-versicolor', 'Iris-versicolor', 'Iris-versicolor',
       'Iris-versicolor', 'Iris-versicolor', 'Iris-versicolor',
       'Iris-versicolor', 'Iris-versicolor', 'Iris-versicolor',
       'Iris-versicolor', 'Iris-versicolor', 'Iris-versicolor',
       'Iris-versicolor', 'Iris-versicolor', 'Iris-versicolor',
       'Iris-versicolor', 'Iris-versicolor', 'Iris-versicolor',
       'Iris-versicolor', 'Iris-versicolor', 'Iris-versicolor'],
      dtype=object)
"""

# 타겟 레이블을 setosa = -1, versicolor = 1 로 바꾸기
y = np.where(y == 'Iris-setosa', -1, 1)
y
"""
array([-1, -1, -1, -1, -1, -1, -1, -1, -1, -1, -1, -1, -1, -1, -1, -1, -1,
       -1, -1, -1, -1, -1, -1, -1, -1, -1, -1, -1, -1, -1, -1, -1, -1, -1,
       -1, -1, -1, -1, -1, -1, -1, -1, -1, -1, -1, -1, -1, -1, -1, -1,  1,
        1,  1,  1,  1,  1,  1,  1,  1,  1,  1,  1,  1,  1,  1,  1,  1,  1,
        1,  1,  1,  1,  1,  1,  1,  1,  1,  1,  1,  1,  1,  1,  1,  1,  1,
        1,  1,  1,  1,  1,  1,  1,  1,  1,  1,  1,  1,  1,  1,  1])
"""

# 두 개의 특성(sepal length, petal length)만 사용
X = df.iloc[0:100, [0, 2]].values
X.shape
"""
(100, 2)
"""

# 두 특성에 따라 데이터 시각화
plt.scatter(X[:50, 0], X[:50, 1], color='red', marker='o', label='setosa')
plt.scatter(X[50:100, 0], X[50:100, 1], color='blue', marker='x', label='versicolor')
plt.xlabel('sepal length')
plt.ylabel('petal length')
plt.legend(loc='upper left')
plt.show()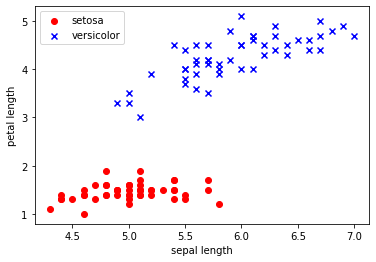
### 퍼셉트론(Perceptron)을 구현
class Perceptron:
    # niter = iteration 의 횟수입니다.
    # iteration에 대해서는 다음 강의에서 자세히 배울 것이므로 반복 횟수 정도로만 이해하셔도 충분합니다.
    def __init__(self, rate = 0.01, niter = 10):
        self.rate = rate
        self.niter = niter

    def fit(self, X, y):
        """
        퍼셉트론을 학습시키는 코드입니다.

        X : 학습되는 데이터에 해당하는 벡터입니다.
        X.shape -> [샘플의 수, 특성의 수] 가 되어야 합니다.

        y : 타겟값입니다.
        y.shape -> [샘플의 수] 가 되어야 합니다.
        """

        # 초기 가중치는 [0, 0, 0] 으로 설정합니다.
        self.weight = np.zeros(1 + X.shape[1])

        # 오분류(mis-classification)된 데이터의 수
        self.errors = []

        for i in range(self.niter):
            err = 0
            for xi, target in zip(X, y):
                delta_w = self.rate * (target - self.predict(xi))
                self.weight[1:] += delta_w * xi
                self.weight[0] += delta_w
                err += int(delta_w != 0.0)
            self.errors.append(err)
        return self

    def net_input(self, X):
        """
        입력값을 받아 가중치, 편향과 연산해줍니다.
        """
        return np.dot(X, self.weight[1:]) + self.weight[0]

    def predict(self, X):
        """
        학습 후 가중치를 바탕으로 데이터의 클래스를 예측합니다.
        """
        return np.where(self.net_input(X) >= 0.0, 1, -1)


### 4. 퍼셉트론에 데이터 넣어 가중치를 학습
# 학습률(learning rate): 0.1, iteration(epoch): 10
# 퍼셉트론을 학습시키고 오분류(mis-classification)의 변화를 살펴보겠습니다.
pn = Perceptron(0.1, 10)
pn.fit(X, y)
plt.plot(range(1, len(pn.errors) + 1), pn.errors, marker='o')
plt.xlabel('Epochs')
plt.ylabel('Number of misclassifications')
plt.show()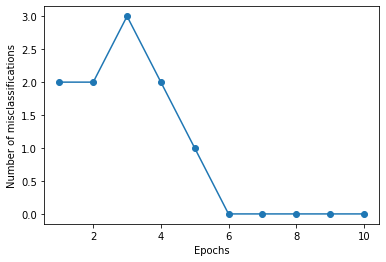
### 데이터가 잘 분류 되었는지 확인
# 퍼셉트론의 결정 경계를 확인해 보겠습니다.
from matplotlib.colors import ListedColormap

def plot_decision_regions(X, y, classifier, resolution=0.02):

    # 그래프 요소를 세팅하여줍니다.
    markers = ('s', 'x', 'o', '^', 'v')
    colors = ('red', 'blue', 'lightgreen', 'gray', 'cyan')
    cmap = ListedColormap(colors[:len(np.unique(y))])

    # 결정 경계면을 그려보겠습니다.
    x1_min, x1_max = X[:,  0].min() - 1, X[:, 0].max() + 1
    x2_min, x2_max = X[:, 1].min() - 1, X[:, 1].max() + 1
    xx1, xx2 = np.meshgrid(np.arange(x1_min, x1_max, resolution),
    np.arange(x2_min, x2_max, resolution))
    Z = classifier.predict(np.array([xx1.ravel(), xx2.ravel()]).T)
    Z = Z.reshape(xx1.shape)
    plt.contourf(xx1, xx2, Z, alpha=0.4, cmap=cmap)
    plt.xlim(xx1.min(), xx1.max())
    plt.ylim(xx2.min(), xx2.max())

    # 데이터를 그립니다
    for idx, cl in enumerate(np.unique(y)):
        plt.scatter(x=X[y == cl, 0], y=X[y == cl, 1],
        alpha=0.8, color=cmap(idx),
        marker=markers[idx], label=cl)

plot_decision_regions(X, y, classifier=pn)
plt.xlabel('sepal length [cm]')
plt.ylabel('petal length [cm]')
plt.legend(loc='upper left')
plt.show()
flatten
- (28, 28) -> 한 줄로 쭉 펴줌
- 사용 목적 : fully connected layer(노드와 노드가 각각 다 연결되어있는 것)를 사용하기 위해
🧐 Review
-
퍼셉트론(Perceptron)이란?
-> 입력 값 = 여러 개, 출력 값 = 1개 -
다층 퍼셉트론 신경망(MLP, Multi-Layer Perceptron)은 무엇이며 단층 퍼셉트론 신경망과 구별되는 장점은 무엇인가요?
-> 은닉층이 1개 이상인 퍼셉트론을 의미하며 단층 퍼셉트론과는 달리 XOR과 같이 비선형적으로 분리되는 데이터에 대해서도 학습이 가능하고 가중치 매개변수의 적절한 값을 데이터로부터 자동으로 학습하는 능력이 있다는 장점이 있다. -
신경망(Neural Network)의 기본 구조와 이를 이루는 구성 요소에 대해 설명해봅시다.
- 뉴런(노드) : 생물학의 신경세포(=neuron)과 같은 개념, 신경망을 구성하는 하나의 단위
- 연결(가중치, 편향)
- 가중치(weight) : 입력신호가 결과 출력에 주는 영향도를 조절하는 매개변수
- 편향(bias) : 뉴런(또는 노드)이 얼마나 쉽게 활성화(1로 출력; activation)되느냐를 조정하는(adjust) 매개변수
- 입력층(Input layer)/은닉층(Hidden layers)/출력층(Output layer)
- 입력층 : 데이터가 입력되는 층
- 은닉층 : 가중치, 편향, 활성화 함수 등 연산이 일어나는 층
- 출력층 : 결과값이 나오는 층으로 문제 유형에 따라 쓰이는 함수가 결정된다.
-
활성화 함수(Activation Function)는 어떤 역할을 하나요?
- 비선형성(Non-linearity)을 만들어 주는 구조
- 전달 받은 값을 출력할 때 일정 기준에 따라 출력값을 변화시키는 비선형 함수의 역할
-
신경망의 학습(Training)은 무엇을 찾기 위한 과정인가요?
- 신경망의 학습은 적절한 가중치를 찾는 과정이다.
- 신경망 학습의 목적은 손실 함수의 값을 가능한 한 낮추는 매개변수를 찾는것이다.
이는 매개변수의 최적값을 찾는 것이며, 이것을 최적화(optimization)라고 한다.
-
분류/회귀는 각각 언제 쓰나요? 그리고 이에 따라 신경망은 어떻게 설계해야 할까요?
- 이진 분류
- 활성화 함수 : 시그모이드(Sigmoid)
- 출력층 노드 수 : 1개 (0/1)
- 손실 함수 : binary_crossentropy (이항 교차 엔트로피)
- 다중 분류
- 함수 : 소프트맥스(Softmax)
- 노드 수 : Label의 클래스(Class) 수
- 손실 함수 : categorical_crossentropy (범주형 교차 엔트로피, label이 원-핫 인코딩 된 형태), sparse_categorical_crossentropy(label이 정수 인코딩 된 형태 즉 label이 class index를 값으로 가질 때 사용)
- 회귀
- 함수 : X
- 노드 수 : 출력값의 특성(feature) 수
- 손실 함수 : 평균 제곱 오차 손실 (Mean_Squared_error, MSE)
- 이진 분류

