- 논문 제목 : House price estimation from visual and textual features
0. Abstract
- 대부분의 집값 예측 시스템은 이웃 지역과 방의 수같은 문자 데이터 등에 의존한다.
- 논문에서는 집 사진에서 시각적 특징을 추출하고 이를 문자 데이터와 합쳐서 활용한다.
- 데이터 : 535개(sample house from the state of California, USA)
- 결과 : 시각적 특징을 추가하고 R-value가 증가, MSE감소
0. INTRODUCTION
Predicting the houses’ prices is a very difficult task due to the illiquidity and heterogeneity in both the physical and the geographical perspectives of the houses market. Also,
there is a subtle interaction between the house price and some other macroeconomic factors that makes the process of prediction very complicated.
- 집값의 경우 미묘한 상호 작용이 존재하여 예측이 복잡하다.
We propose a multilayer neural network for house price estimation from visual and textual features. We report the results of this proposed model using the newly created benchmark dataset. Additionally, we show that our model surpasses the state of the art models, when tested using only the textual features, on an existing benchmark housing dataset (Lichman, 2013). Our model also outperforms Support Sector Regression machine (SVR) when trained and tested on our dataset.
- 논문에서는 집값 예측을 위해 multilayer neural network을 사용한다.
- 또한, 다른 실험들에 비해 성능이 좋다.
3. DATASET DESCRIPTION
- 535 sample houses from California State in the United State(both visual and textual data)
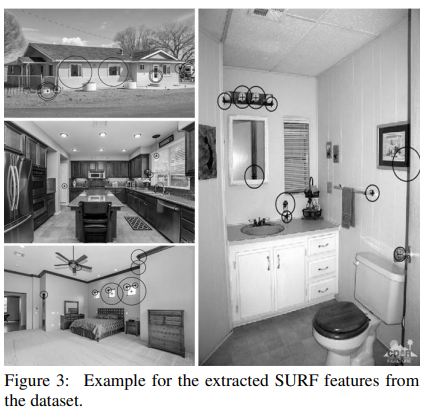
- 이미지 데이터는 4개의 이미지로 구성(아래의 Figure 1 처럼 the house, the bedroom, the kitchen and the
bathroom로 구성되어 있음)
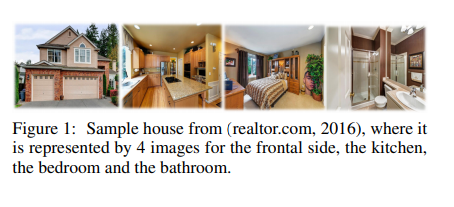
- 문자 데이터 특성은 방의 수(the number of bedrooms), 화장실 수(the number of bathrooms), 집 면적(the area of the house), 우편 번호(the zip code)로 구성되어 있다.
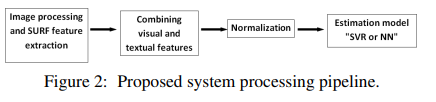
- 집값은 $22,000부터 $5,858,000까지 구성되어 있다.
4. PROPOSED BASELINE SYSTEM
- 목적 : 시각적 특징을 포함하는 것이 주택 가격 추정에 테스트 하기 위함
- 논문에서는 시각적 특징과 예측 정확도를 찾기 위해 시도함.(Support Vector Regression과 Neural Networks Model사용)
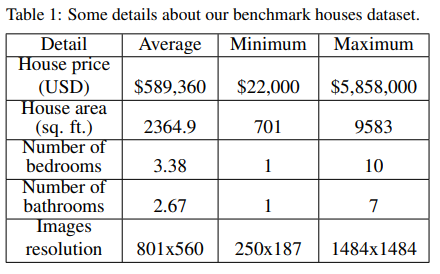
- 본 논문에서 사용한 파이프 라인
-
첫번쨰 모듈 : 이미지 전처리
-
마지막 모듈
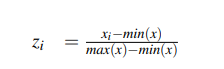
1. 정규화(min-max scaele)
2. the aggregated features이 추정 모듈에 통과(SVR or NN)
4.1 Support Vector Regression (SVR)
- SVM 특징
- 다차원 함수 추정 및 회귀 문제를 해결하기 위한 머신러닝 접근 방법
- 통계적 학습 이론에서 파생되며 클래스의 최적 분리 원칙을 기반으로 함
- 두개의 카테고리가 존재
- Support Vector Classification (SVC)
- Support Vector Regression (SVR)
- the kernel type : the Histogram Intersection Kernel
- optimal value for the parameter (C) : several experiments on the dataset to obtain the best
result - Histogram Intersection : 색상 인덱싱을 위해
객체 인식에 적용하고 색상 기반의 효과적인 표현으로 SVM의 커널로 사용할 수 있음이 입증 - 평가 지표 : the coefficient of determination (R2) and the Mean Squared Error (MSE)
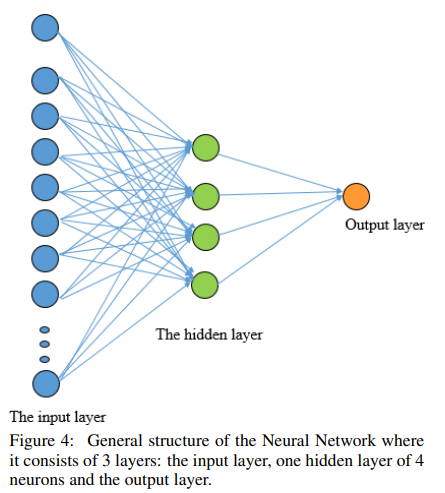
4.2 Neural Networks (NNs)
-
activation function : the sigmoid activation function
Our NN was trained using Levenberg–Marquardt
algorithm (LMA) which is a technique used to solve non-linear least square problems. -
Levenberg–Marquardt algorithm (LMA)활용 참고링크
- a combination of two minimization methods
- the gradient descent method
- the Gauss-Newton method
- a combination of two minimization methods
-
평가 지표 : coefficient of determination (R2)
and the Mean Squared Error (MSE)
4.3 Performance evaluation
4.3.1 Mean Square Error
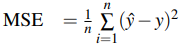
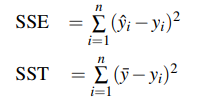
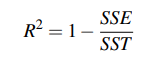
4.3.2 The coefficient of determination R^2
5 EXPERIMENTS AND RESULTS
5.1 SVR experiments
- train : 80%(428 houses)
- test : 20%(107 houses)
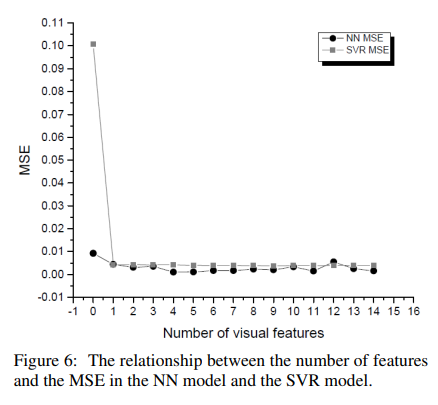
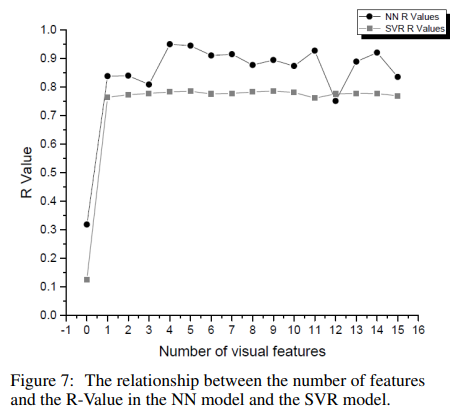
- different number of the extracted SURF features each time to find the relationship between the number of features and the accuracy of the estimation model(16 different cases)
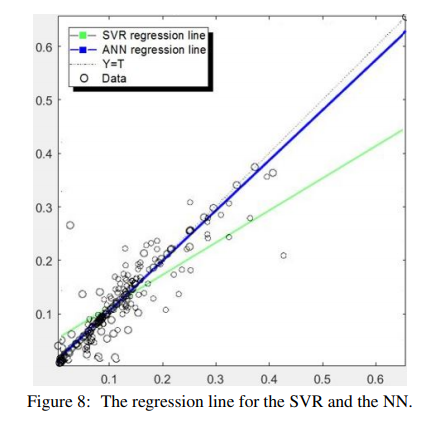
- 9 visual features where the model achieves the lowest MSE value of 0.0037665 and the highest R−Value of 0.78602(9 이후로 성능 안좋아짐)
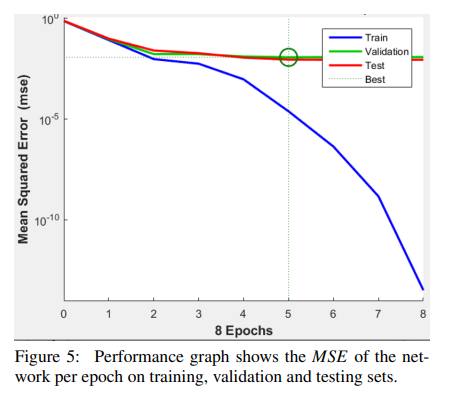
5.2 Neural Networks experiments
- one 4-units hidden layer(실험적으로 4개가 좋음)
- train : 70% / valid : 15% / test : 15%
- 5 epoch마다 훈련을 중단에 업데이트
- 4 SURF features with the textual attributes results in achieving the highest R−Value of 0.95053 and the least MSE of 0.000959.
6 Conclusion
it was shown that aggregating both visual and
textual information yielded better estimation accuracy compared to textual features alone. Moreover, better results were achieved using NN over SVM given the same dataset.