
Choropleth Map
World Map 그리기
데이터 불러오기
동시에 여러종류의 데이터를 fetch해야하는 경우, Promise.all()을 사용한다.
tsvData에 있는 나라별 economy value를topoJSONdata의 각각의 국가의 properties에 합치기 위해서rowById오브젝트를 만든다. ({id: properties}와 같이)tsvData의iso_n3의 값과topoJSONdata의 properties에 있는id의 값과 동일하다.- countries.features을 돌면서
Object.assign()을 이용해서 국가의 properties에 rowById 프로퍼티를 추가한다.(id를 key로 이용)
// loadAndProcessData.js
import { feature } from 'topojson';
import { tsv, json } from 'd3';
export const loadAndProcessData = () =>
  Promise.all([
    tsv('https://unpkg.com/world-atlas@1.1.4/world/50m.tsv'),
    json('https://unpkg.com/world-atlas@1.1.4/world/50m.json'),
  ]).then(([tsvData, topoJSONdata]) => {

    // Look up a row of tsvData  by id of topoJSONdata
    const rowById = tsvData.reduce((accumulator, d) => {
      accumulator[d.iso_n3] = d;
      return accumulator;
    }, {});

    // Convert topoJson to GeoJson
    const countries = feature(topoJSONdata, topoJSONdata.objects.countries);

    // Assign all properties of tsvData into properties object of topoJSONdata
    countries.features.forEach(d => {
      Object.assign(d.properties, rowById[d.id]);
    });

    return countries;
  });
Color Scheme 추가하기
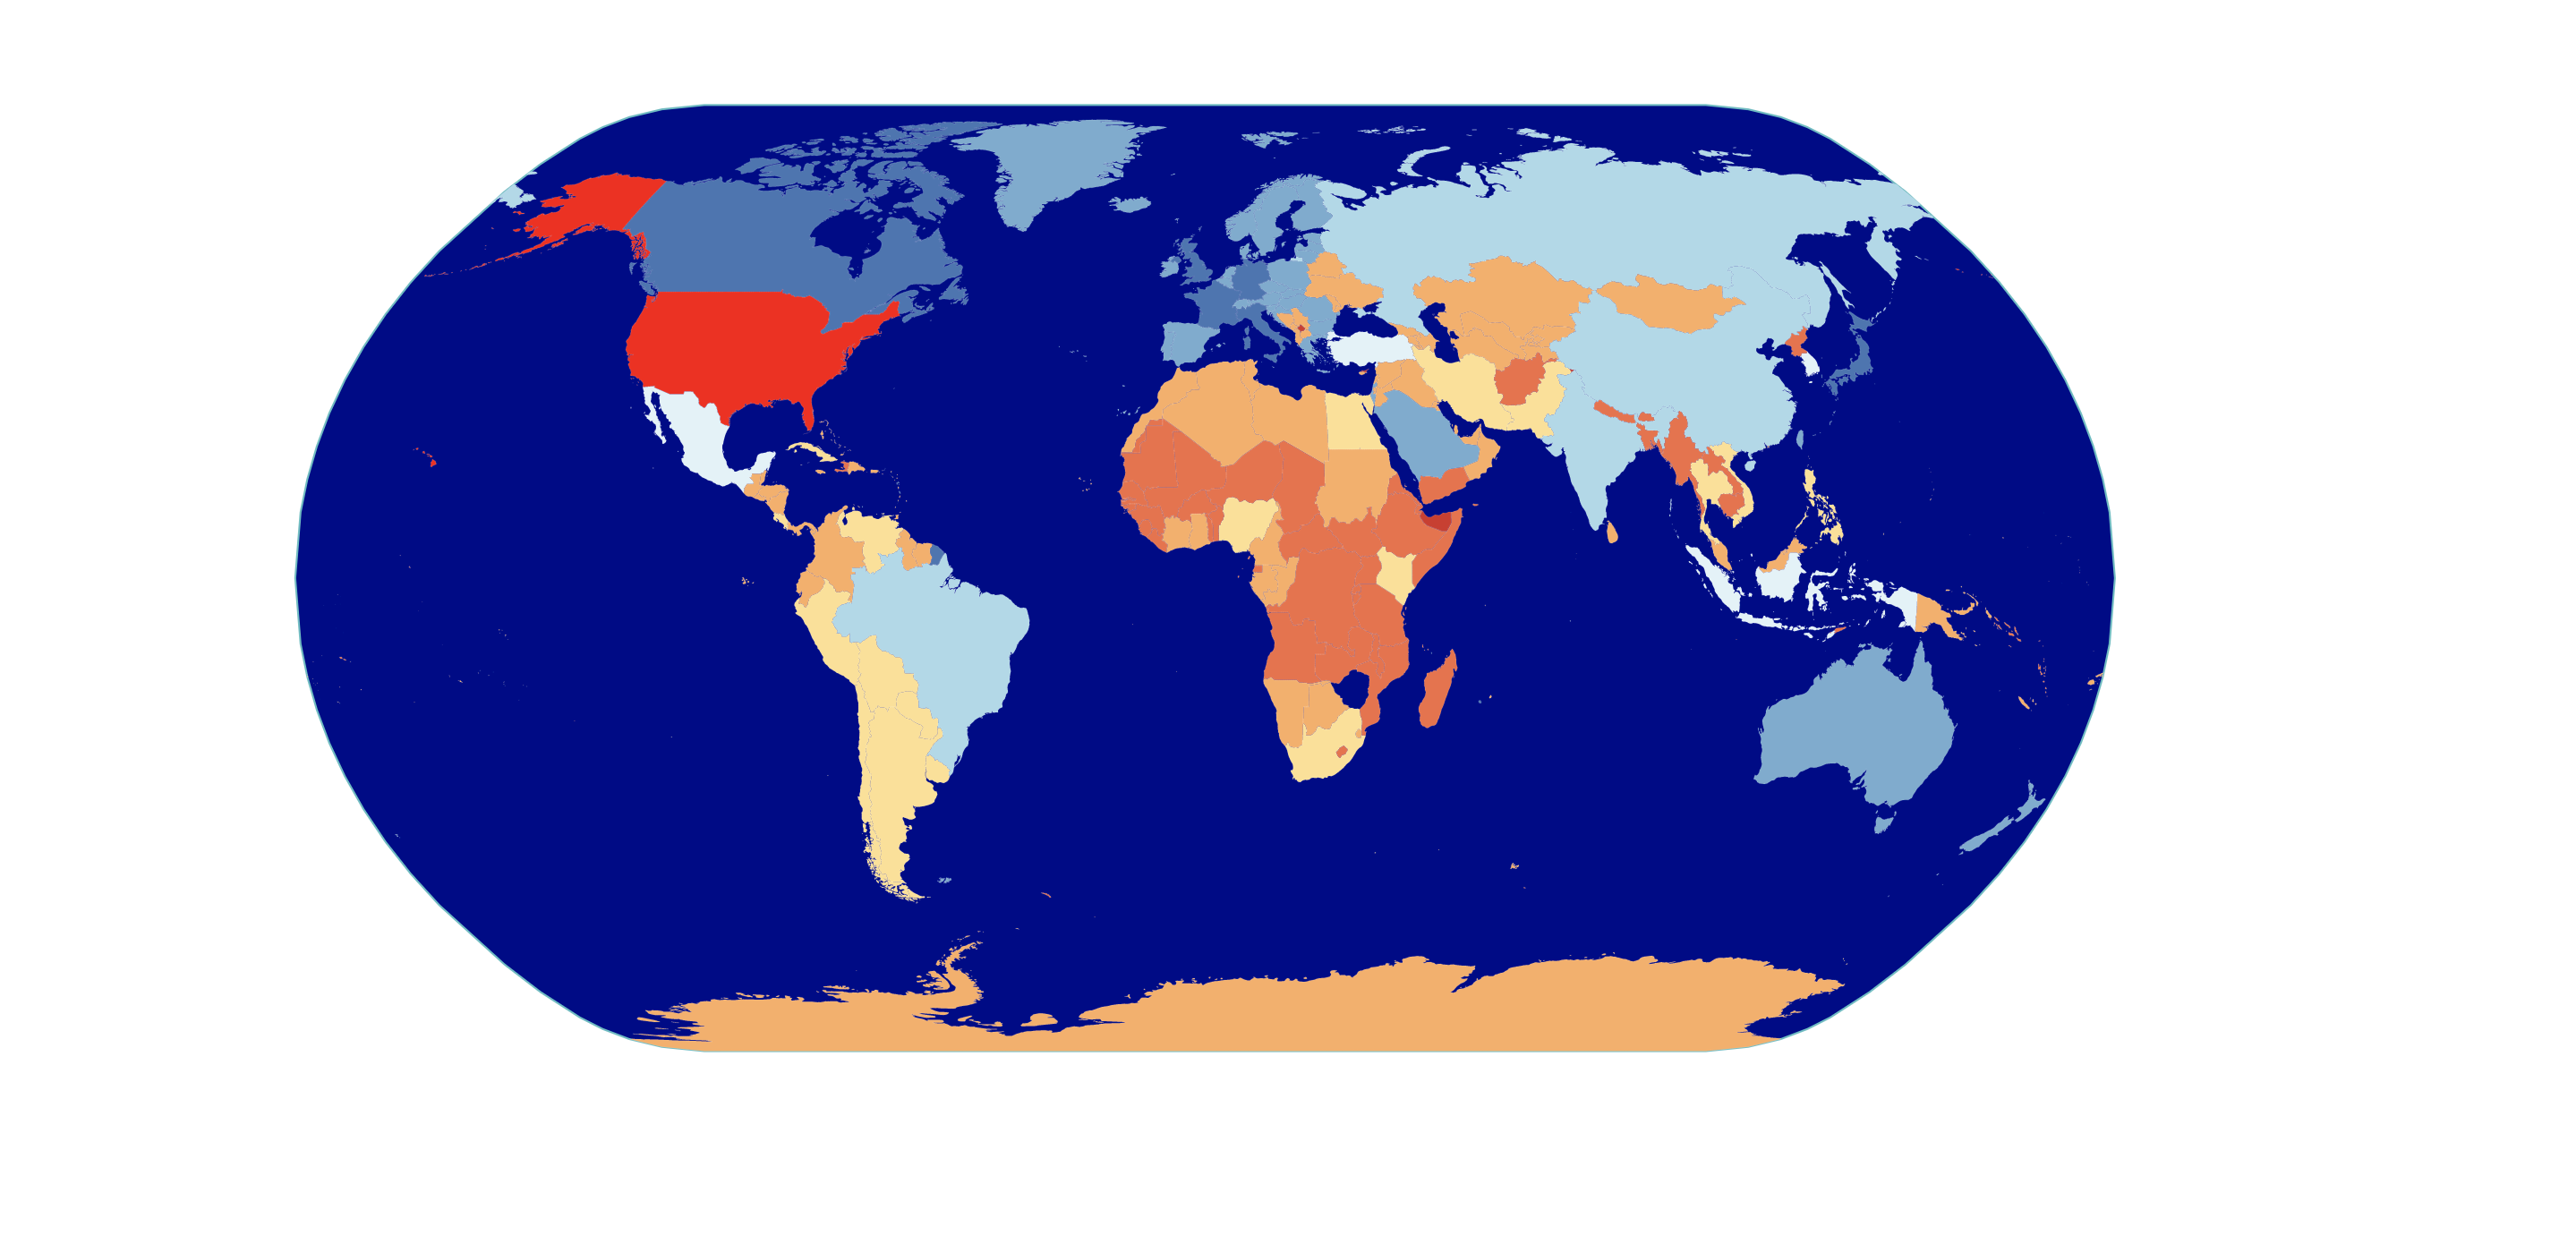
Color Scheme의 종류가 궁금하다면, d3-scale-chromatic 확인Color Scheme의 색상을 반대로 적용 하고 싶다면,domain값에reverse()를 사용한다.
import {
  select,
  geoPath,
  geoNaturalEarth1,
  zoom,
  scaleOrdinal,
  schemeRdYlBu,
} from 'd3';
import { loadAndProcessData } from './loadAndProcessData';

const width = document.body.clientWidth;
const height = document.body.clientHeight;

const svg = select('div')
  .append('svg')
  .attr('width', width)
  .attr('height', height);
const g = svg.append('g');

// Convert data into svg path
const projection = geoNaturalEarth1()
  .scale(width / 1.8 / Math.PI) // center
  .rotate([0, 0])
  .center([0, 0])
  .translate([width / 2, height / 2]);

const pathGenerator = geoPath().projection(projection);

// Create earth sphere
g.append('path')
  .attr('class', 'sphere')
  .attr('d', pathGenerator({ type: 'Sphere' }));

// Panning and zooming
svg.call(
  zoom().on('zoom', ({ transform }) => {
    g.attr('transform', transform);
  })
);

/////////// Color Scale //////////////
const colorScale = scaleOrdinal();
const colorValue = d => d.properties.economy;

loadAndProcessData().then(countries => {
  colorScale
    .domain(countries.features.map(colorValue)) // 03 Developing region, 01 Develop region...
    .domain(colorScale.domain().sort().reverse()) // (*) Reverse color
    .range(schemeRdYlBu[colorScale.domain().length]); // 7

  g.selectAll('path')
    .data(countries.features)
    .enter()
    .append('path')
    .attr('class', 'country')
    .attr('d', pathGenerator)
    .attr('fill', d => colorScale(colorValue(d)))
    .append('title') // Add tooltip
    .text(d => `${d.properties.name}: ${colorValue(d)}`);
});
Color Legend 추가하기
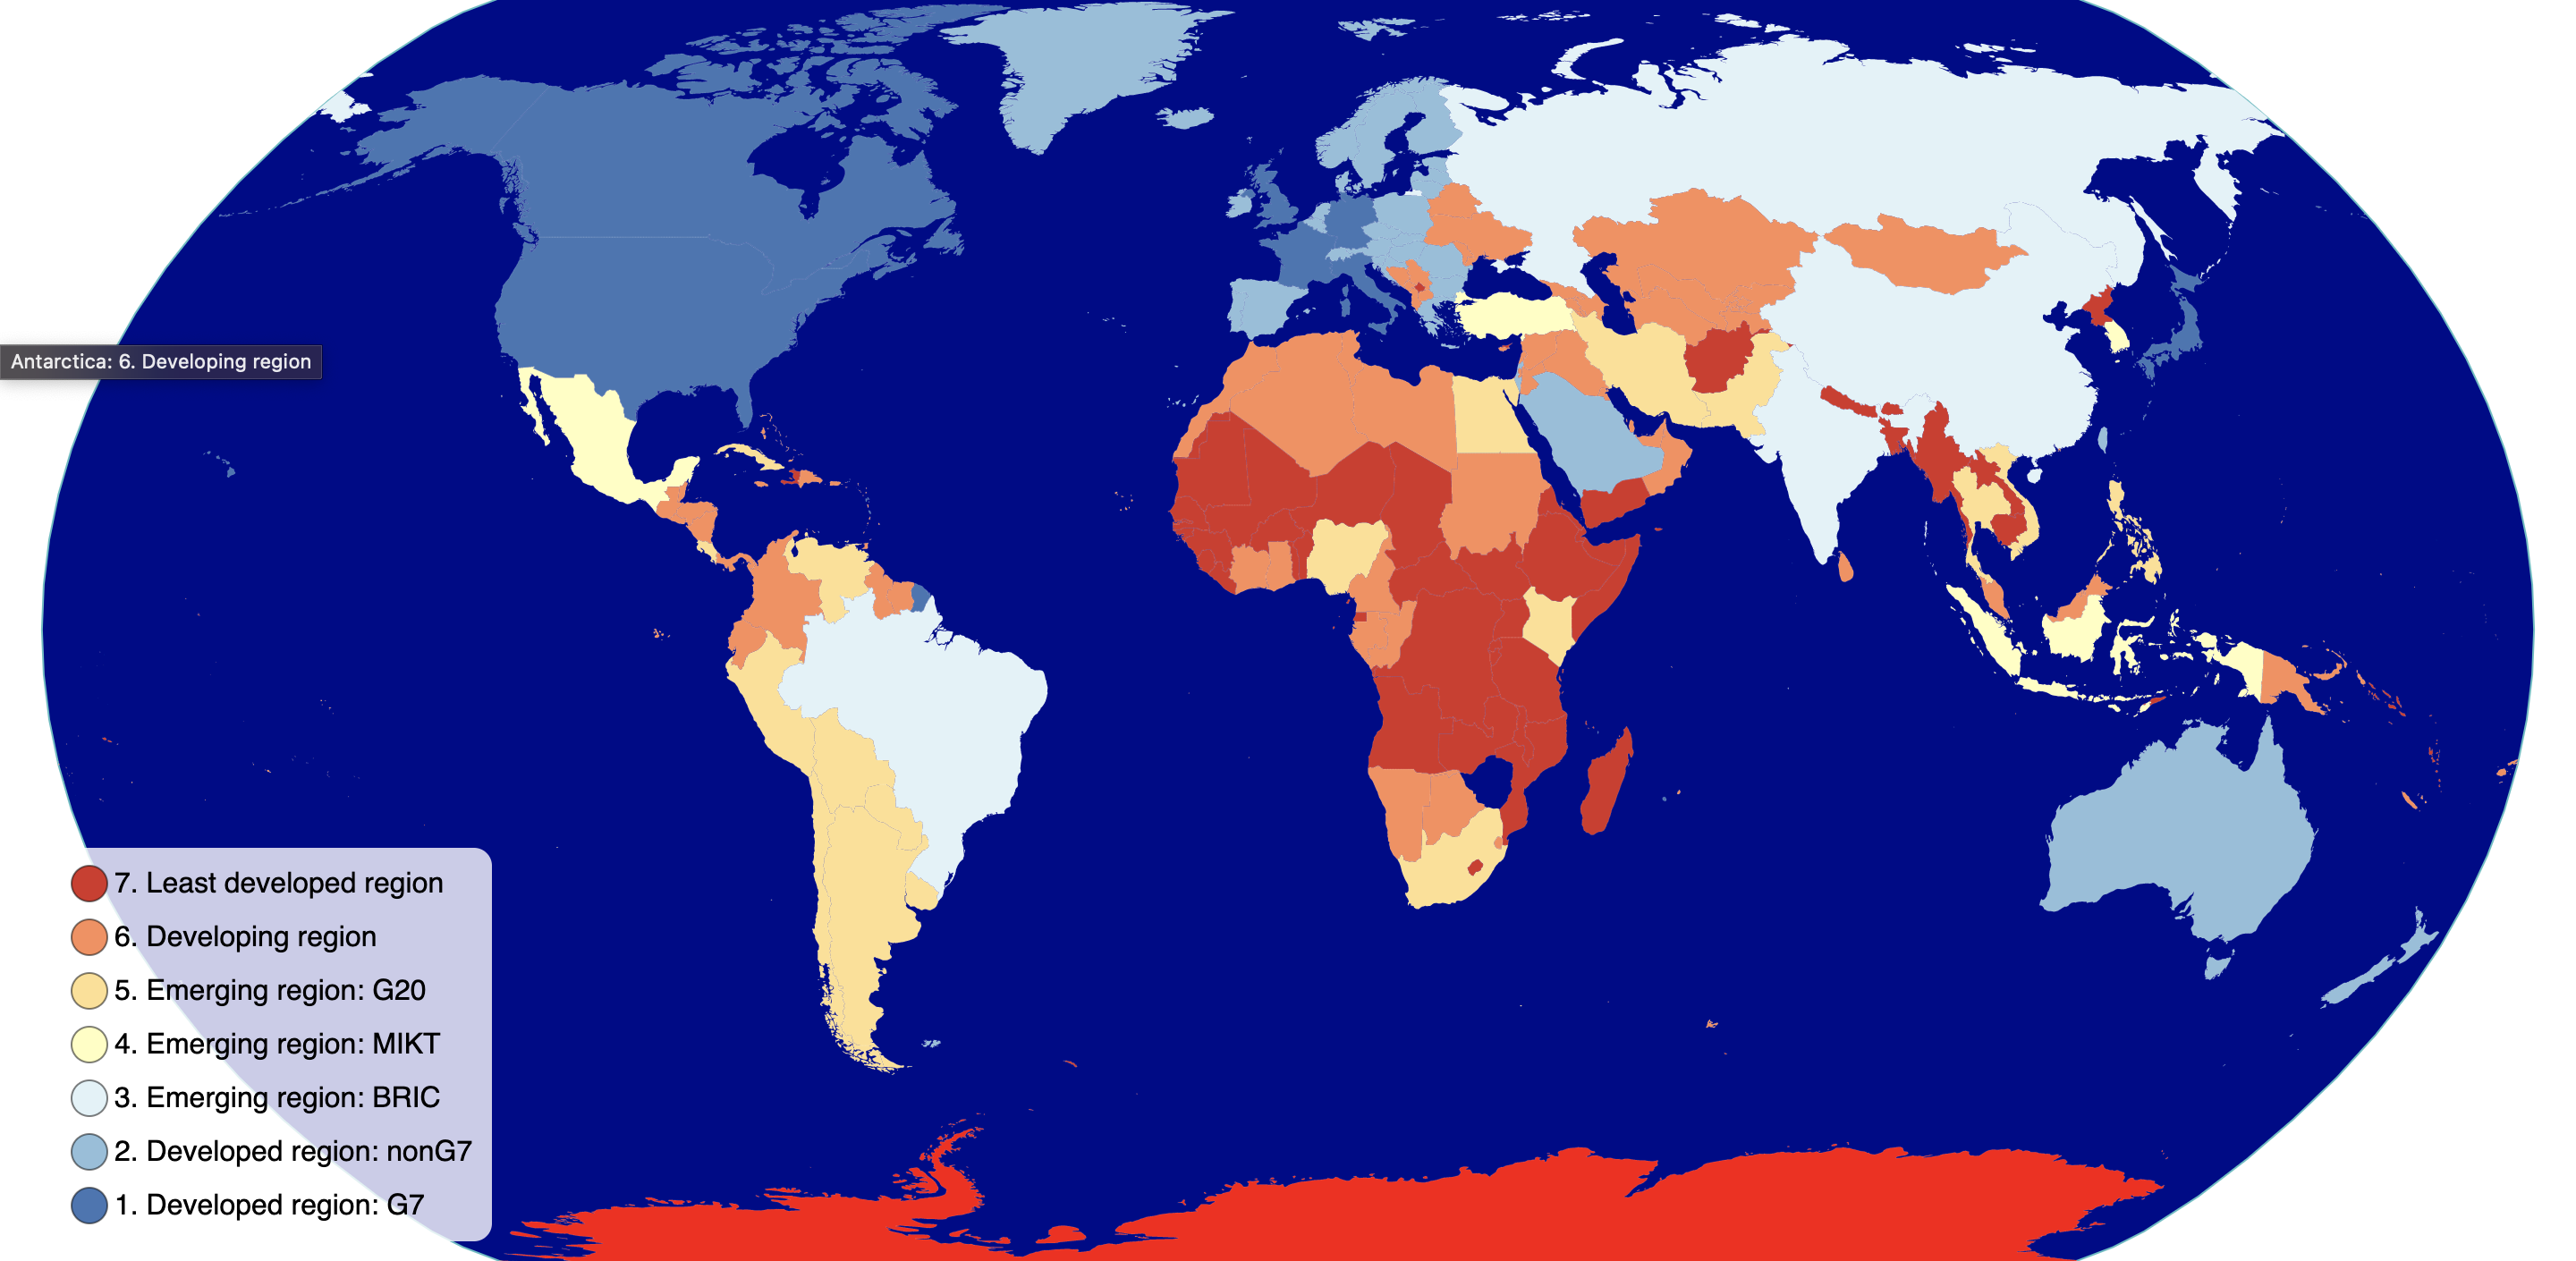
- 맵을 zoom했을 때, color legend가 함께 zoom되지 않도록 color legend를 따로 그룹으로 묶는다.
color-legend.js 생성
// color-legend.js
export const colorLegend = (selection, props) => {
  const { colorScale, circleRadius, spacing, textOffset, bgRectWidth } = props;

  // Add background rectangle of color lenged
  const bgRect = selection.selectAll('rect').data([null]);
  const n = colorScale.domain().length;

  bgRect
    .enter()
    .append('rect')
    .merge(bgRect)
    .attr('x', -circleRadius * 2)
    .attr('y', -circleRadius * 2)
    .attr('rx', circleRadius)
    .attr('width', bgRectWidth)
    .attr('height', spacing * n + circleRadius)
    .attr('fill', 'white')
    .attr('opacity', 0.8);

  const groups = selection.selectAll('g').data(colorScale.domain());
  const groupsEnter = groups.enter().append('g').attr('class', 'tick');
  groupsEnter
    .merge(groups)
    .attr('transform', (d, i) => `translate(0, ${i * spacing})`);
  groups.exit().remove();

  groupsEnter
    .append('circle')
    .merge(groups.select('circle'))
    .attr('r', circleRadius)
    .attr('fill', colorScale);

  groupsEnter
    .append('text')
    .merge(groups.select('text'))
    .text(d => d)
    .attr('dy', '0.32em')
    .attr('x', textOffset);
};
index.js
import { colorLegend } from './color-legend';

const g = svg.append('g');
const colorLegendG = svg.append('g').attr('transform', 'translate(50, 500)');

  // Add a color legend
  colorLegendG.call(colorLegend, {
    colorScale,
    circleRadius: 10,
    spacing: 30,
    textOffset: 14,
    bgRectWidth: 245,
  });
Filtering 기능 추가하기
listen event➡️change state➡️update- General update pattern 사용
choroplethMap컴포넌트로 분리
index.js
import { select, scaleOrdinal, schemeRdYlBu } from 'd3';
import { loadAndProcessData } from './choropleth-map/loadAndProcessData';
import { colorLegend } from './choropleth-map/color-legend';
import { choroplethMap } from './choropleth-map/choroplethMap';

export const width = document.body.clientWidth;
export const height = document.body.clientHeight;

const svg = select('div')
  .append('svg')
  .attr('width', width)
  .attr('height', height);

const choroplethMapG = svg.append('g');
const colorLegendG = svg.append('g').attr('transform', 'translate(50, 500)');

// Color Scale
const colorScale = scaleOrdinal();
const colorValue = d => d.properties.economy;

// Change State
let selectedColorValue;
let features;

const onClick = (e, d) => {
  if (d === selectedColorValue) {
    // Toggle opaticy on click
    selectedColorValue = null;
  } else {
    selectedColorValue = d;
  }
  render();
};

const render = () => {
  colorScale
    .domain(features.map(colorValue)) // 03 Developing region, 01 Develop region...
    .domain(
      colorScale
        .domain()
        .filter(el => el !== undefined)
        .sort()
        .reverse()
    )
    .range(schemeRdYlBu[colorScale.domain().length]);

  // Add a color legend
  colorLegendG.call(colorLegend, {
    colorScale,
    circleRadius: 10,
    spacing: 30,
    textOffset: 14,
    bgRectWidth: 245,
    onClick,
    selectedColorValue,
  });

  // Add a choropleth map
  choroplethMapG.call(choroplethMap, {
    features,
    colorScale,
    colorValue,
    selectedColorValue,
  });
};

loadAndProcessData().then(countries => {
  features = countries.features;
  render();
});
color-legend.js
- Color Legend를 클릭했을 때,
selectedColorValue를 제외한 값은 opacity를 0으로 지정한다. - 첫 렌더링(
!selectedColorValue)과d === selectedColorValue의 경우는 opcaity를 1로 설정한다.
export const colorLegend = (selection, props) => {
  const {
    colorScale,
    circleRadius,
    spacing,
    textOffset,
    bgRectWidth,
    onClick,
    selectedColorValue,
  } = props;

  // Add background rectangle of color lenged
  const bgRect = selection.selectAll('rect').data([null]);
  const n = colorScale.domain().length;

  bgRect
    .enter()
    .append('rect')
    .merge(bgRect)
    .attr('x', -circleRadius * 2)
    .attr('y', -circleRadius * 2)
    .attr('rx', circleRadius)
    .attr('width', bgRectWidth)
    .attr('height', spacing * n + circleRadius)
    .attr('fill', 'white')
    .attr('opacity', 0.8);

  const groups = selection.selectAll('.tick').data(colorScale.domain());
  const groupsEnter = groups.enter().append('g').attr('class', 'tick');

  groupsEnter
    .merge(groups)
    .attr('transform', (d, i) => `translate(0, ${i * spacing})`)
    .attr(
      'opacity',
      d => (!selectedColorValue || selectedColorValue === d ? 1 : 0.2) // Set opacity 1 when firest rendering
    )
    .on('click', onClick);

  groups.exit().remove();

  groupsEnter
    .append('circle')
    .merge(groups.select('circle'))
    .attr('r', circleRadius)
    .attr('fill', colorScale);

  groupsEnter
    .append('text')
    .merge(groups.select('text'))
    .text(d => d)
    .attr('dy', '0.32em')
    .attr('x', textOffset);
};
choroplethMap.js
import { geoPath, geoNaturalEarth1, zoom } from 'd3';
import { width, height } from './index';

// Convert data into svg path
const projection = geoNaturalEarth1()
  .scale(width / 1.8 / Math.PI)
  .rotate([0, 0])
  .center([0, 0])
  .translate([width / 2, height / 2]);

const pathGenerator = geoPath().projection(projection);

export const choroplethMap = (selection, props) => {
  const { features, colorScale, colorValue, selectedColorValue } = props;

  // General update pattern for managing single element
  const gUpdate = selection.selectAll('g').data([null]);
  const gEnter = gUpdate.enter().append('g');
  const g = gUpdate.merge(gEnter);

  // Create earth sphere
  gEnter
    .append('path')
    .attr('class', 'sphere')
    .attr('d', pathGenerator({ type: 'Sphere' }))
    .merge(gUpdate.select('.sphere'))
    .attr('opacity', selectedColorValue ? 0.2 : 1);

  // Panning and zooming
  selection.call(
    zoom().on('zoom', ({ transform }) => {
      g.attr('transform', transform);
    })
  );

  const countryPaths = g.selectAll('.country').data(features);

  const countryPathsEnter = countryPaths
    .enter()
    .append('path')
    .attr('class', 'country');

  // Set opacity of countries when having selectedColorValue
  countryPaths
    .merge(countryPathsEnter)
    .attr('d', pathGenerator)
    .attr('fill', d => colorScale(colorValue(d)))
    .attr('opacity', d =>
      !selectedColorValue || selectedColorValue === colorValue(d) ? 1 : 0.2
    )
    .classed(
      // Add class conditionally
      'highlighted',
      d => selectedColorValue && selectedColorValue === colorValue(d)
    );

  // Add tooltip
  countryPathsEnter
    .append('title')
    .text(d => `${d.properties.name}: ${colorValue(d)}`);
};
style.css
.country {
  stroke: white;
  stroke-width: 0.3px;
}

.country:hover {
  fill: red;
}

.country.highlighted {
  stroke: black;
  stroke-width: 0.3px;
}

.sphere {
  fill: darkblue;
}

text {
  fill: black;
  color: black;
}

.tick {
  cursor: pointer;
}

.tick text {
  font-size: 1em;
  fill: black;
}

.tick circle {
  stroke: black;
  stroke-opacity: 0.5;
}

Hello World.