1. LDA 이란?
선형판별분석(Linear Discriminant Analysis, LDA)는 Classification(분류모델)과 Dimensional Reduction(차원 축소)까지 동시에 사용하는 알고리즘이다.
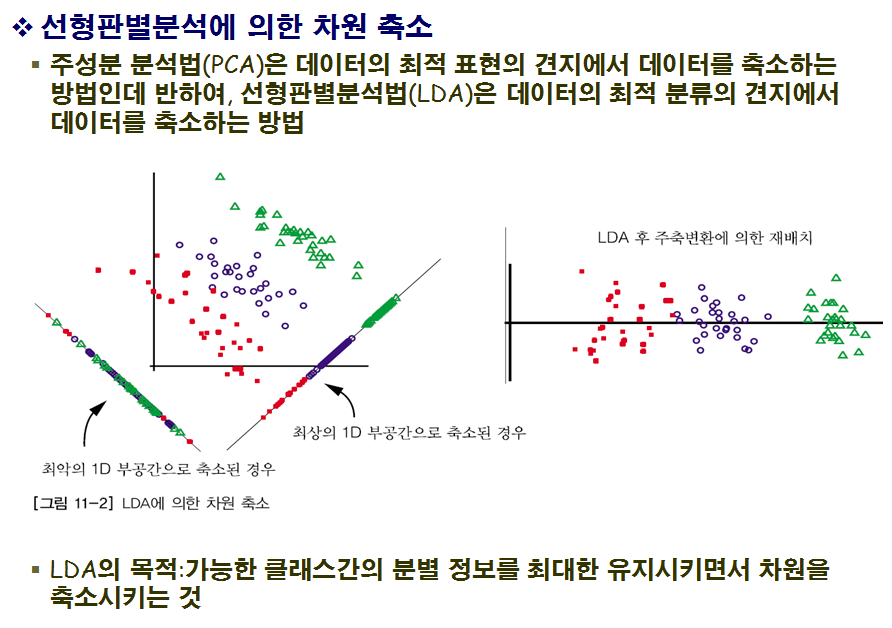
LDA는 입력 데이터 세트를 저차원 공간으로 투영(projection)해 차원을 축소하는 기법이며 지도학습에서 사용된다. (PCA는 비지도 학습에 사용된다)
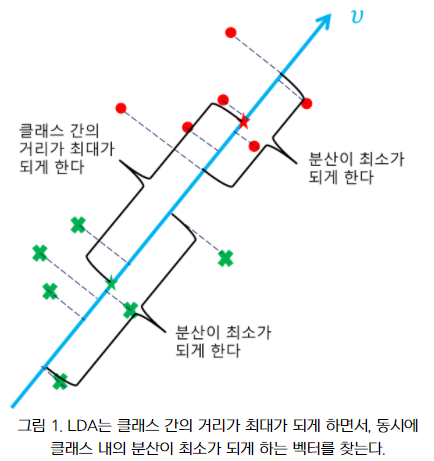
LDA는 아래와 같은 두 가지 성질을 가진 벡터를 찾는다.
- 데이터 포인트들을 투영시켰을 때 각 클래스에 속하는 투영들의 평균간의 거리의 합이 최대가 되게 하는 벡터. 다른 말로, 클래스 간(between-class)의 거리가 최대가 되게 하는 벡터.
- 데이터 포인트들을 투영시켰을 때 클래스 내의 투영들의 분산이 최소가 되게 하는 벡터. 다른 말로, 클래스 내(within-class)의 분산이 최소가 되게 하는 벡터.
LDA는 클래스 내의 분산이 최소가 되게 하고, 클래스 간의 거리가 최대가 되게 하는 벡터를 찾아 데이터 포인트들을 투영 시키게 한다.
즉 특정 공간상에서 클래스 분리를 최대화하는 축을 찾기 위해 클래스 간 분산(between-class scatter)과 클래스 내부 분산(within-class scatter)의 비율을 최대화하는 방식으로 차원을 축소한다. (SB / SW)
LDA은 투영을 통해 가능한 한 클래스를 멀리 떨어지게 하므로 SVM 같은 다른 분류 알고리즘을 적용하기 전에 차원을 축소시키는 데 사용하면 좋다고 한다.


*SB / SW
SB = between-class scatter (클래스 간 분산)
SW = within-class scatter (클래스 내 분산)
2. LDA와 PCA의 차이점?
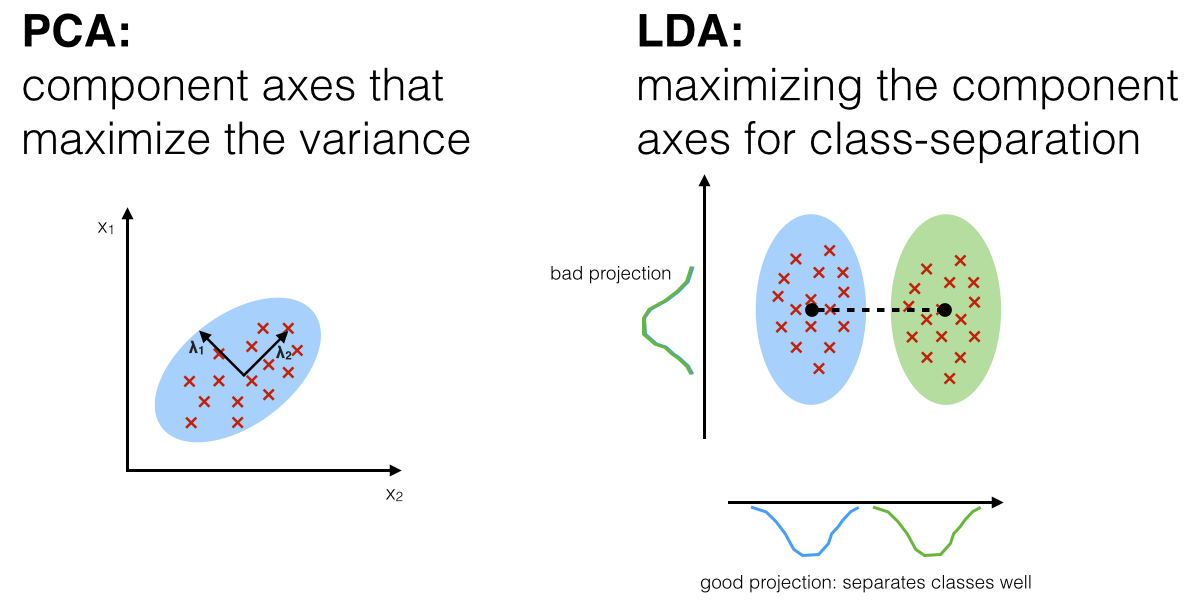
LDA는 다른 클래스에 속하는 데이터들을 선형으로 분류가 가능하도록 데이터 포인트들을 투영시키는 머신러닝 알고리즘이다. 여기서 LDA는 PCA와 같이 투영(projection)이라는 기법을 한다.
PCA는 데이터들을 어떠한 벡터로 투영시켰을 때, 투영들의 분산이 큰 벡터들을 찾는다. 투영들의 분산이 적게 만드는 벡터들은 제거해줌으로 데이터의 차원을 감소시킨다. 고차원의 데이터를 저차원으로 감소시켜 시각화가 가능하게 하거나 노이즈를 제거하는 것이 PCA의 목적이다.
반면 LDA는 데이터를 하나의 선으로 투영시킨다. 또한 PCA와 달리 데이터들이 어떤 클래스에 속하는지 알아야 한다.

3. 선형 판별 분석의 내부 동작 방식
PCA와 마찬가지로 LDA의 단계를 요약해보면 아래와 같다.
- d차원 데이터셋을 표준화한다. (d = 특성개수)
- 각 클래스 대해 d차원 평균 벡터를 계산한다.
- 클래스 간의 산포 행렬(scatter matrix) S(B)와 클래스 내부의 산포행렬 S(W)를 구성한다.
- S(W)의 역행렬과 S(B)의 곱행렬의 고유벡터와 고윳값을 계산한다.
- 고윳값을 내림차순으로 정렬해 순서를 정한다.
- 고윳값이 가장 큰 k개의 고유벡터를 선택해 d * k 차원의 변환행렬 W를 구한다.
- 변환 행렬 W를 사용해 새로운 특성 부분 공간으로 투영한다.
LDA는 행렬을 고윳값과 고유벡터로 분해해서 새로운 저처원 특성 공간을 구성한다는 점에서 매우 PCA와 비슷하다. 다만, LDA는 2단계에서 평균 벡터를 만들 때 클래스 레이블 정보를 사용하고, 레이블 별로 데이터를 나누어 평균을 구한다는 점에서 다르다.
4. Python 코드로 구현
from sklearn.discriminant_analysis import LinearDiscriminantAnalysis
from sklearn.preprocessing import StandardScaler
from sklearn.datasets import load_iris
import pandas as pd
import matplotlib.pyplot as plt
%matplotlib inline
#붓꽃 데이터 로드
iris = load_iris()
#데이터 정규 스케일링
iris_scaled = StandardScaler().fit_transform(iris.data)
print(iris_scaled)
...
#2개의 클래스로 구분하기 위한 LDA 생성
lda = LinearDiscriminantAnalysis(n_components=2)
- 지도학습 분류이므로 fit할 때, target값을 입력해주어야 한다.
- iris_scaled : feature 데이터
- iris.target : target 데이터#fit()호출 시 target값 입력 lda.fit(iris_scaled, iris.target) iris_lda = lda.transform(iris_scaled) print(iris_lda)
...
lda_columns=['lda_component_1','lda_component_2']
irisDF_lda = pd.DataFrame(iris_lda, columns=lda_columns)
irisDF_lda['target']=iris.target
#--------------
print(iris_lda)
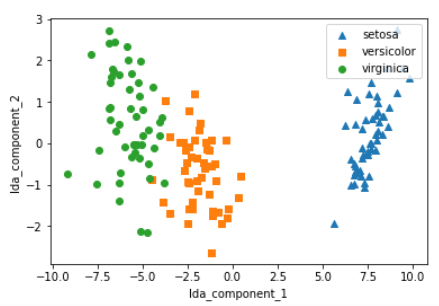
#setosa는 세모, versicolor는 네모, virginica는 동그라미로 표현
markers=['^', 's', 'o']
#setosa의 target 값은 0, versicolor는 1, virginica는 2. 각 target 별로 다른 shape으로 scatter plot for i, marker in enumerate(markers): x_axis_data = irisDF_lda[irisDF_lda['target']==i]['lda_component_1'] y_axis_data = irisDF_lda[irisDF_lda['target']==i]['lda_component_2'] plt.scatter(x_axis_data, y_axis_data, marker=marker,label=iris.target_names[i])plt.legend(loc='upper right') plt.xlabel('lda_component_1') plt.ylabel('lda_component_2') plt.show()
출처:
https://bkshin.tistory.com/entry/%EB%A8%B8%EC%8B%A0%EB%9F%AC%EB%8B%9D-18-%EC%84%A0%ED%98%95%ED%8C%90%EB%B3%84%EB%B6%84%EC%84%9DLDA
https://dnai-deny.tistory.com/17
https://bskyvision.com/351

