컴퓨터 비전
1.이미지 히스토그램
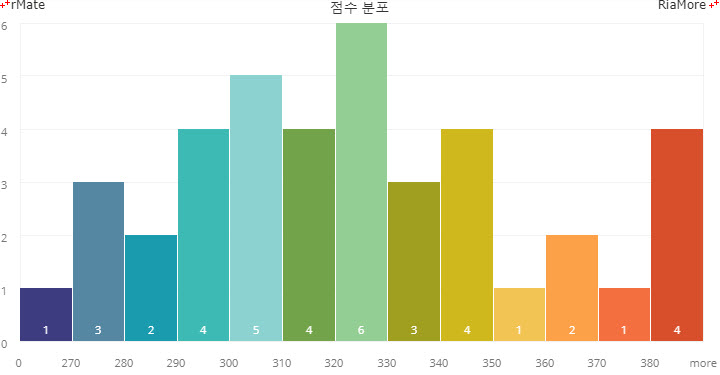
히스토그램은 이미지의 픽셀 값 분포를 시각화하고 분석하는 데 사용된다.회사 업무 중 두 이미지의 유사도 비교를 해야하는 과제에 직면했다.여러 방법을 탐구한 후, 이미지 히스토그램이 제일 적합하여 활용했다. 이미지의 픽셀 값 분포를 시각화한 그래프이미지의 픽셀 값이란?참
2.이미지 유사도 분석 패키지..? 실패 😥

https://pypi.org/project/image-similarity-measures/히스토그램으로 비교했는데 작년에 released된 패키지가 있다?!
3.모폴로지 연산
모폴로지 연산이란?이미지 처리에서 객체의 형태학적(structural) 특성을 분석하거나 변환하는 기법주로 이진 이미지에 적용되며, 객체의 크기, 형태, 연결성 등을 조작할 수 있다.대표적인 연산으로 침식(Erosion), 팽창(Dilation), 열림(Opening)
4.이미지 증강
데이터 증강이란(Data Augmentation) 모델의 성능을 향상시키기 위해 기존 데이터를 변형하여 새로운 데이터를 생성하는 기법. 주로 딥러닝에서 모델의 일반화 성능을 높이고 과적합(overfitting)을 방지하기 위해 사용된다.
5.ASPP (Atrous Spatial Pyramid Pooling)
요즘 multi-scaling 공부가 필요함 1. Atrous convolution (= Dilated Convolution) dilation이 적용된 합성곱 dilation이란 아래 사진과 같이 픽셀 사이에 빈 공간을 사이사이에 넣는 것을 말한다. 수용 영역(Receptive Field)가 확장되어 더 넓은 범위의 정보 학습이 가능. 2. SSP (S...
6.Multi-Scale Embedding을 활용한 Crowd Counting 모델
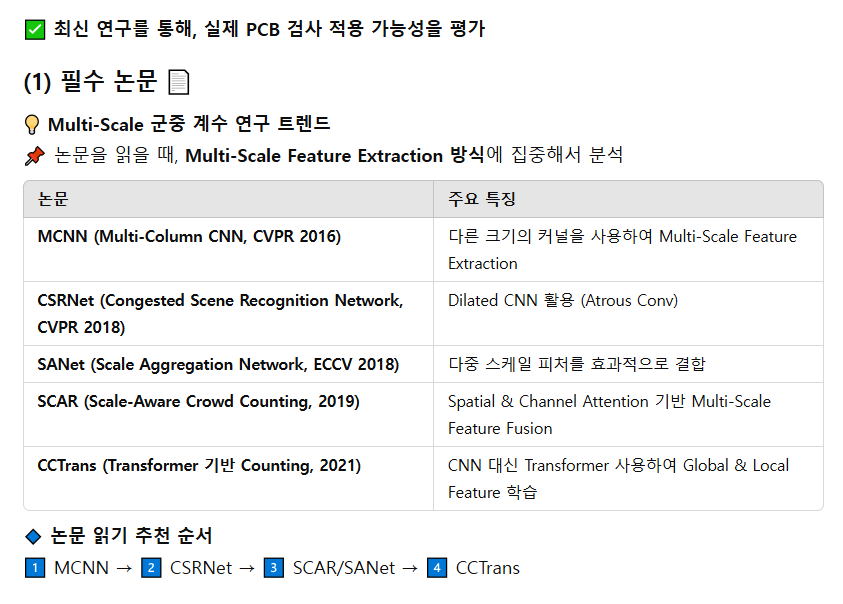
CNN 백본(VGG-16)과 dilated convolution을 활용하여 넓은 수용영역을 확보하고, 군중 밀집 지역의 밀도를 예측하는 방식.서로 다른 커널 크기를 가진 3개의 병렬 CNN을 사용하여 다양한 스케일의 정보를 학습하는 모델.다중 스케일 특징을 동적으로 조
7.Denoising Diffusion Probabilistic Models(DDPM) - 비전공자(바로 나!)를 위한 정리
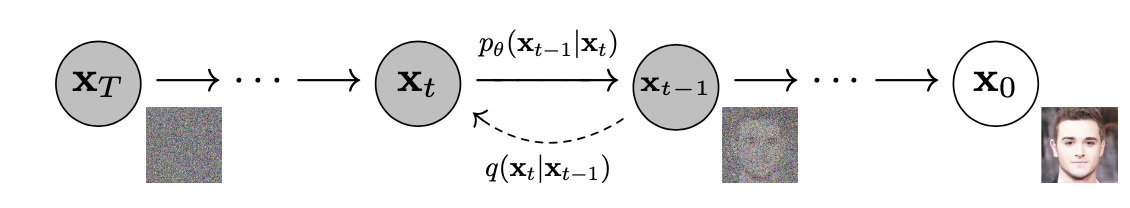
사실 dpm도 ddpm을 이해하기 위한 배경 지식인데 클났다. 이미지에 점진적으로 노이즈를 추가하고, 노이즈를 다시 없애면서 원본 이미지를 복원목표:고품질 이미지 생성이미지 복원 등Forward Process$q(xt | x{t-1}) = \\mathcal{N}(xt
8.Autoencoder, VAE
압축(Encoding) → 복원(Decoding) 과정이미지를 압축해서 중요한 특징만 남김. 중복된 정보나 노이즈는 자연스럽게 제거되어 연산이 가벼움.비지도 학습출력과 입력을 비교하기 때문에 정답 라벨 필요x.Latent Space (잠재 공간): 핵심 특징만 담은 벡
9.LDM (Latent Diffusion Model)
기존의 Diffusion Model은 픽셀 단위에서 동작해서 고해상도 이미지 생성 시 연산량과 시간이 매우 많이 필요했다.LDM = Autoencoder + Diffusion Model1\. 계산 효율성 극대화기존 픽셀 단위 Diffusion Model은 매우 높은 계
10.SDEdit
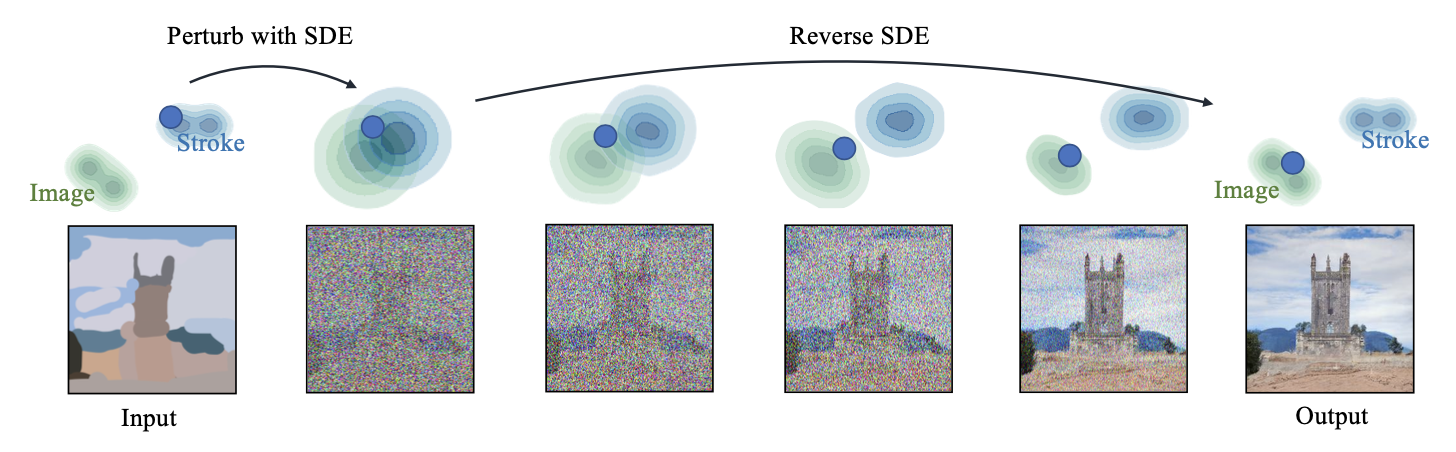
gpt4.5로 작성됨.기존의 GAN(Generative Adversarial Network) 기반 방법들은 사용자의 입력과 사실적 이미지 간 균형을 유지하는 데 어려움이 있었고, 매번 새로운 데이터 수집 및 학습 과정이 필요했다. 이에 대한 대안으로 등장한 것이 바로