
데이터 로드 및 확인
import pandas as pd
import numpy as np

adidas = pd.read_csv('Adidas US Sales Datasets.csv')

adidas.head(2)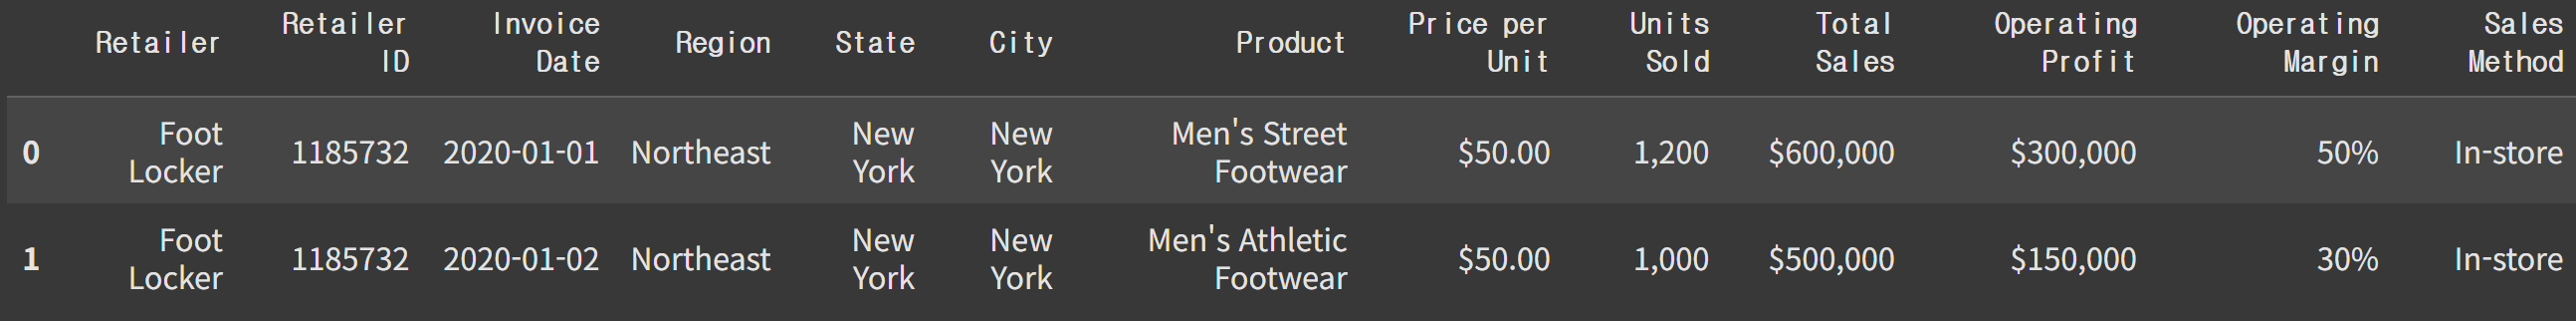
판매방법의 유니크한 값 확인
adidas['Sales Method'].unique()

array(['In-store', 'Outlet', 'Online'], dtype=object)
컬럼 설명
Retailer : adidas 브랜드를 판매하는 유통처
Retailer ID : 판매점 ID
Price per Unit : 상품 1개당 가격
Units Sold : 판매수량
Total Sales : 판매금액
Operating Profit : 영업이익(매출액 - 원가)
Operating Margin : 영업마진(영업이익율)
데이터타입 조회
adidas.info()

 #   Column            Non-Null Count  Dtype
---  ------            --------------  -----
 0   Retailer          9648 non-null   object
 1   Retailer ID       9648 non-null   int64
 2   Invoice Date      9648 non-null   object
 3   Region            9648 non-null   object
 4   State             9648 non-null   object
 5   City              9648 non-null   object
 6   Product           9648 non-null   object
 7   Price per Unit    9648 non-null   object
 8   Units Sold        9648 non-null   object
 9   Total Sales       9648 non-null   object
 10  Operating Profit  9648 non-null   object
 11  Operating Margin  9648 non-null   object
 12  Sales Method      9648 non-null   object
데이터 전처리
NULL값은 없지만 'Retailer ID'을 제외하고 전부 object 타입이기 때문에 데이터타입 변환이 필요하다
Retailer object
Retailer ID int64 -> 문자
Invoice Date object -> 날짜
Region object
State object
City object
Product object
Price per Unit object -> 숫자(실수, float)
Units Sold object -> 숫자(실수, float)
Total Sales object -> 숫자(실수, float)
Operating Profit object -> 숫자(실수, float)
Operating Margin object -> 숫자(실수, float)
Sales Method object
숫자가 문자로 나타난 경우 문자 -> 숫자로 변환
가격, 매출액등의 컬럼에 특수문자가 포함되어있다 -> 정규표현식 이용해서 특수문자 제거 X
소수점이 있기 때문에 특수문자 전체를 제거하면 안된다
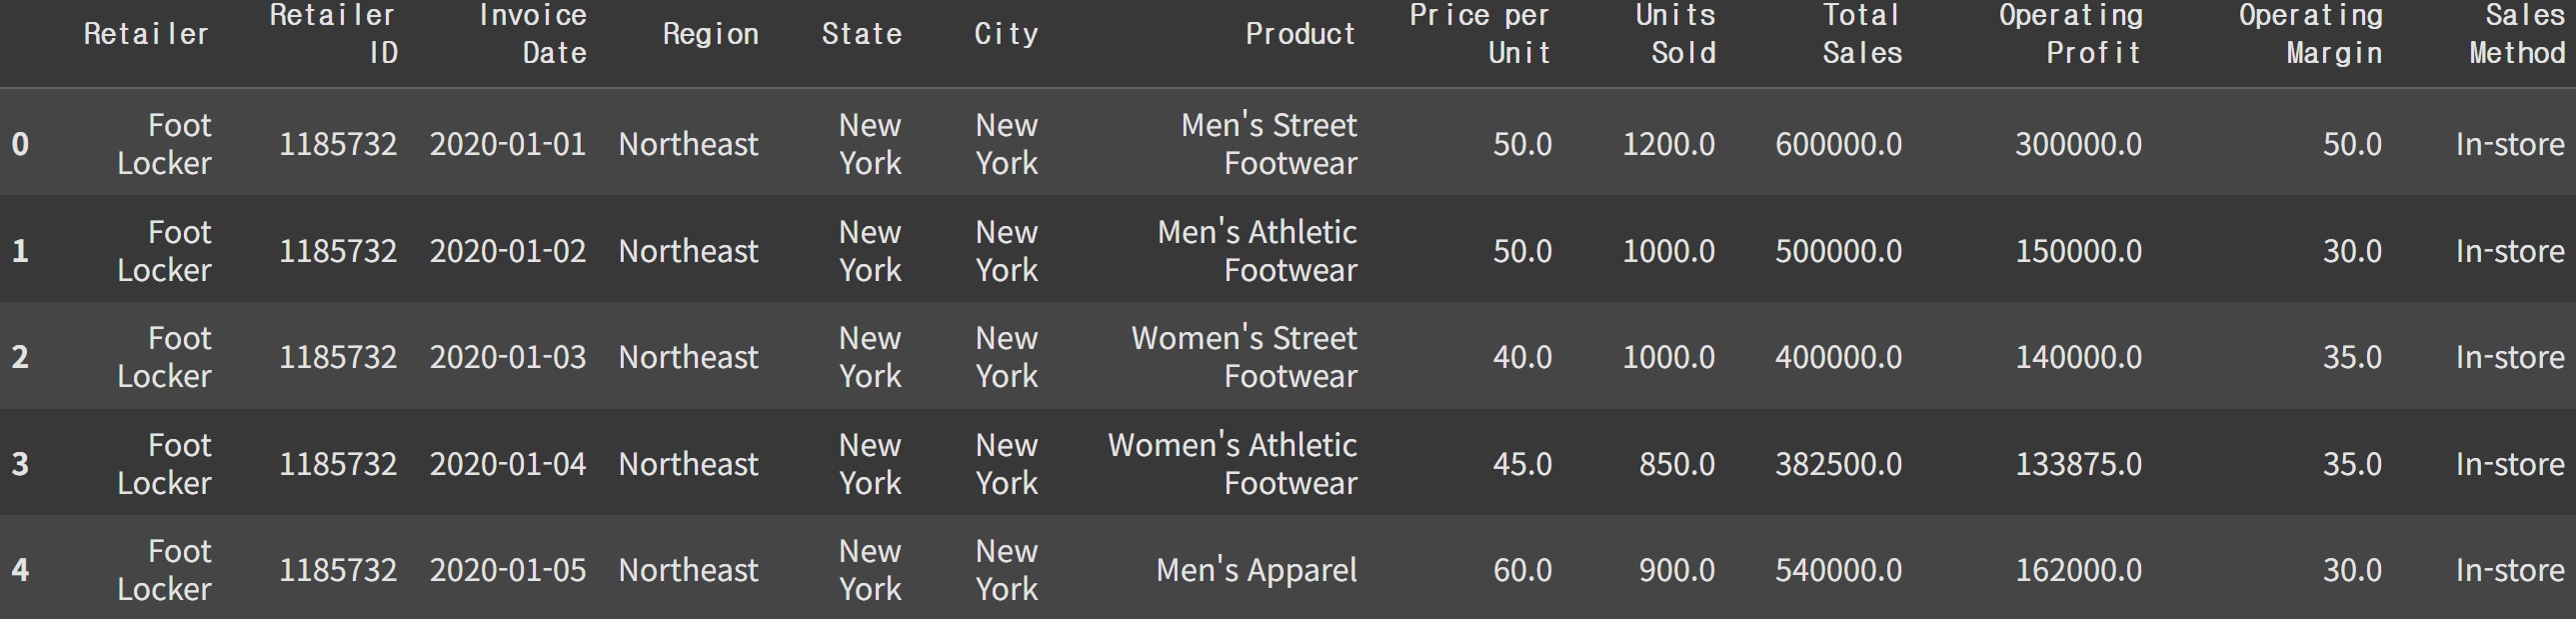
adidas['Price per Unit']=adidas['Price per Unit'].str.replace('[%$,]', '', regex=True).astype('float')
adidas['Units Sold']=adidas['Units Sold'].str.replace('[$%,]', '', regex=True).astype('float')
adidas['Total Sales']=adidas['Total Sales'].str.replace('[$%,]', '', regex=True).astype('float')
adidas['Operating Profit']=adidas['Operating Profit'].str.replace('[$%,]', '', regex=True).astype('float')
adidas['Operating Margin']=adidas['Operating Margin'].str.replace('[$%,]', '', regex=True).astype('float')
데이터 확인
Operation Margin은 백분율이기 때문에 0.01을 곱해 계산을 사용할 수 있도록 변환
adidas['Operating Margin']=adidas['Operating Margin']*0.01시간데이터 다루기
YYYY-mm-dd 형태의 문자 데이터를 pandas의 datetime으로 변환
adidas['Invoice Date']=pd.to_datetime(adidas['Invoice Date'], format='%Y-%m-%d')

adidas['year']=adidas['Invoice Date'].dt.year
adidas['month']=adidas['Invoice Date'].dt.month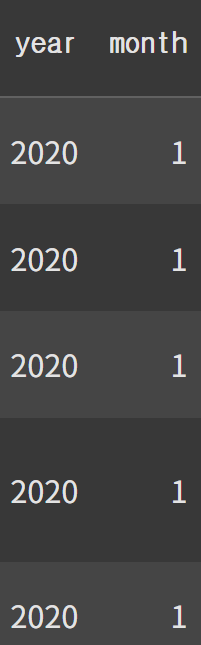
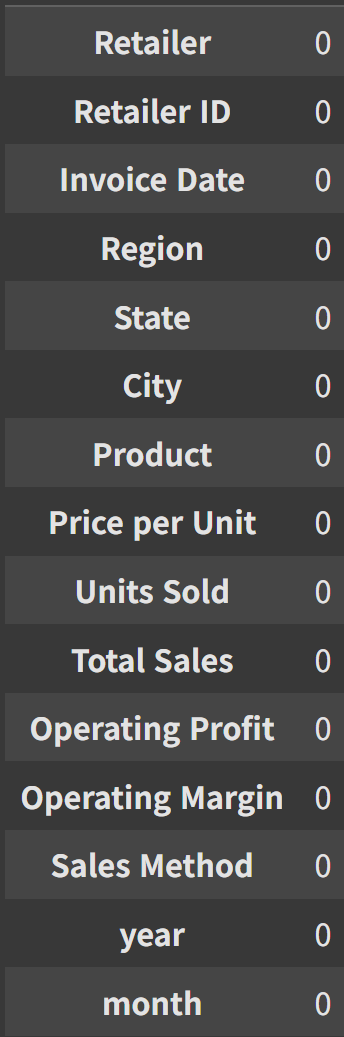
adidas['Retailer ID']=adidas['Retailer ID'].astype('int')결측치 확인
EDA
월별 판매량 분석
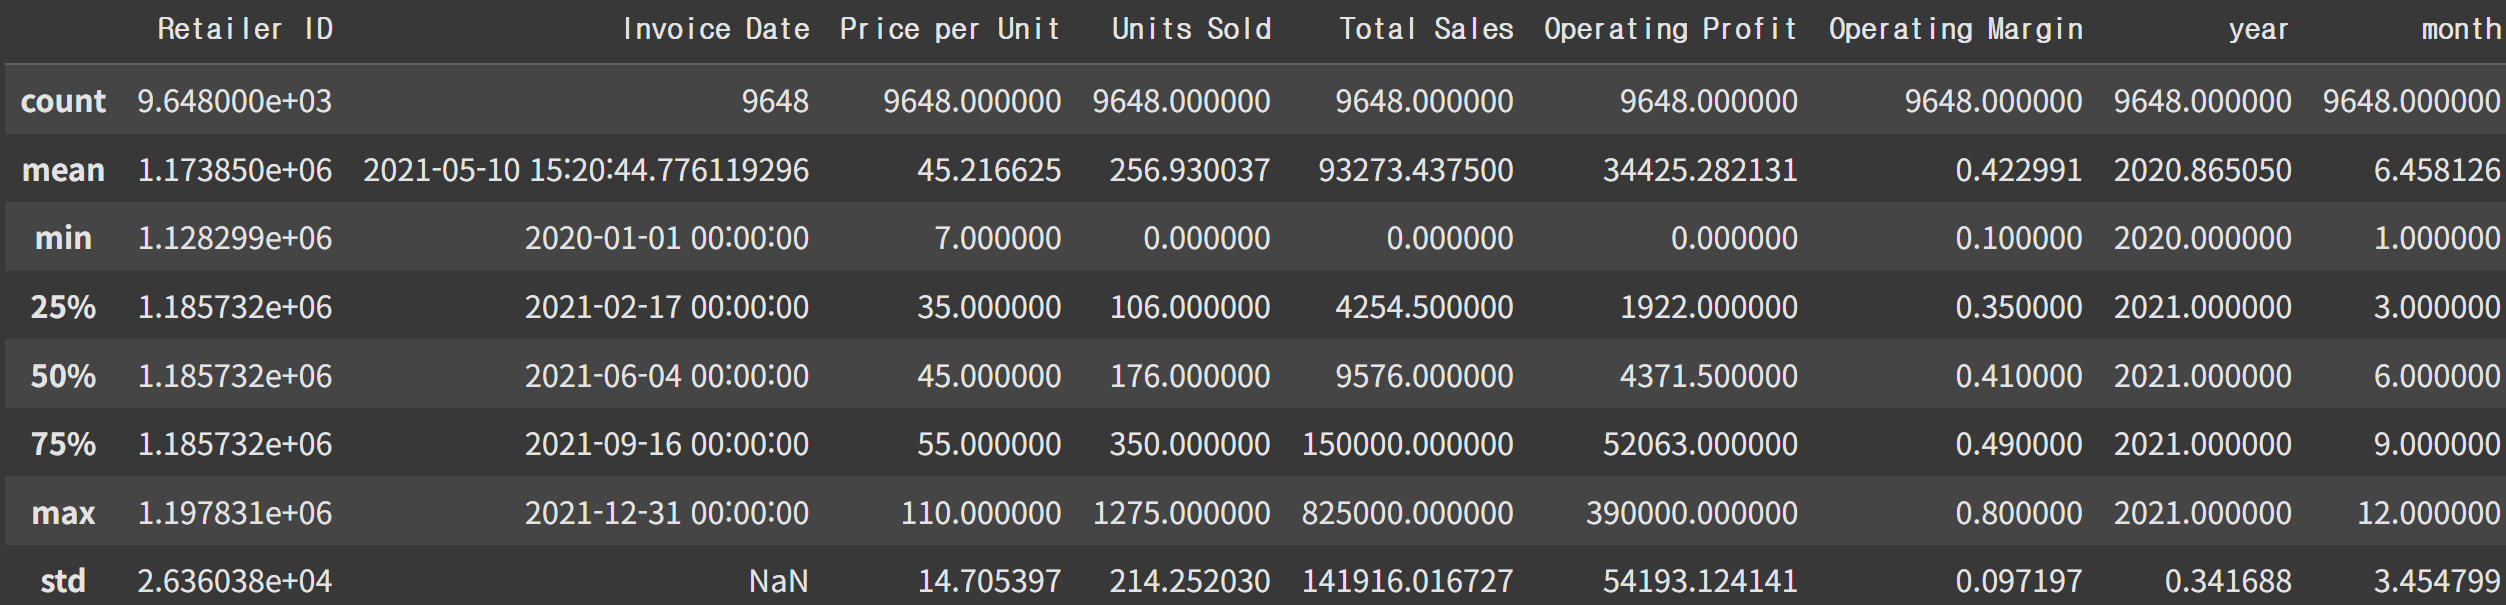
컬럼별 기술통계량 확인
월별 판매량 그래프
adidas.groupby(['year', 'month'])['Units Sold'].sum().plot.line()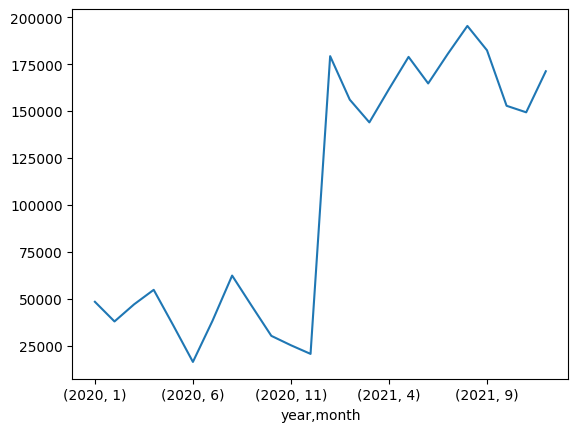
2021년 1월부터 판매량이 급등했다.
수치적으로 정확히 확인
adidas.groupby(['year', 'month'])['Units Sold'].sum()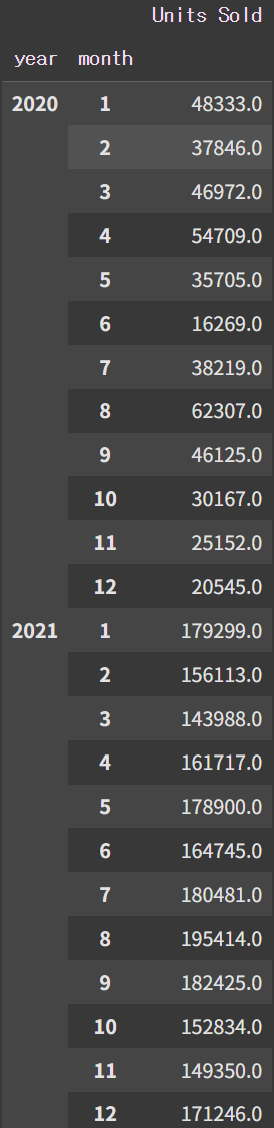
앞에서 산출한 결과는 보기 힘들다 -> 보기 쉽게 pivot table로 변환
adidas.pivot_table(index='year', columns='month', values='Units Sold', aggfunc='sum') # 연도별 비교 편하게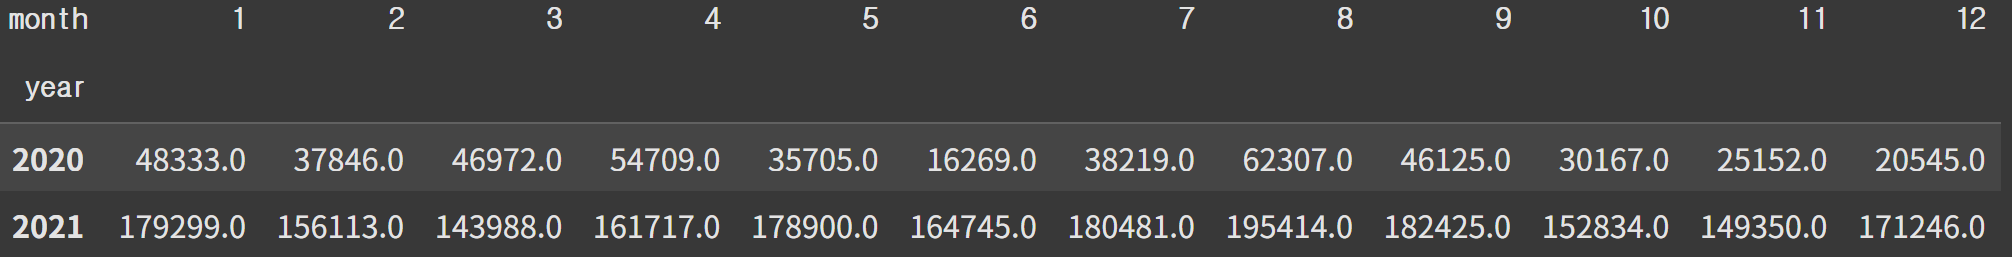
소매업체별 분석
특정업체의 판매량이 급증했는지 확인
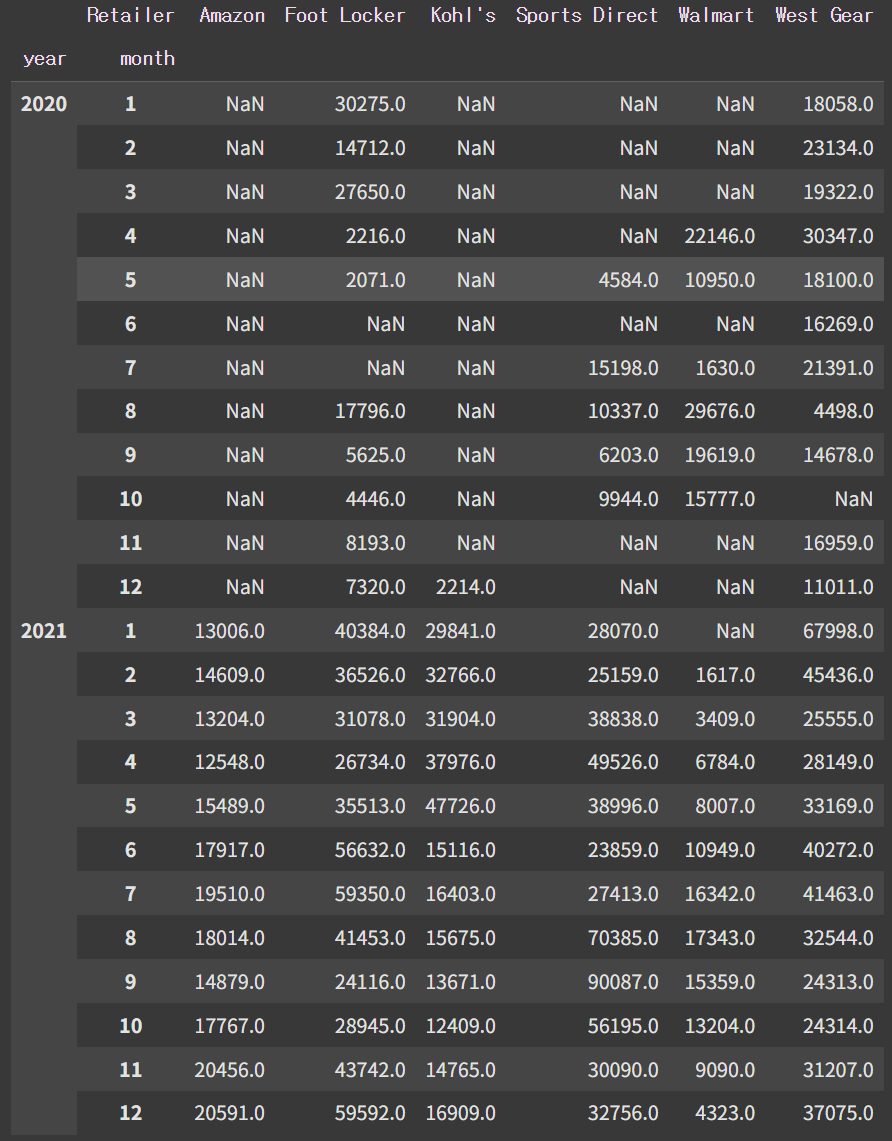
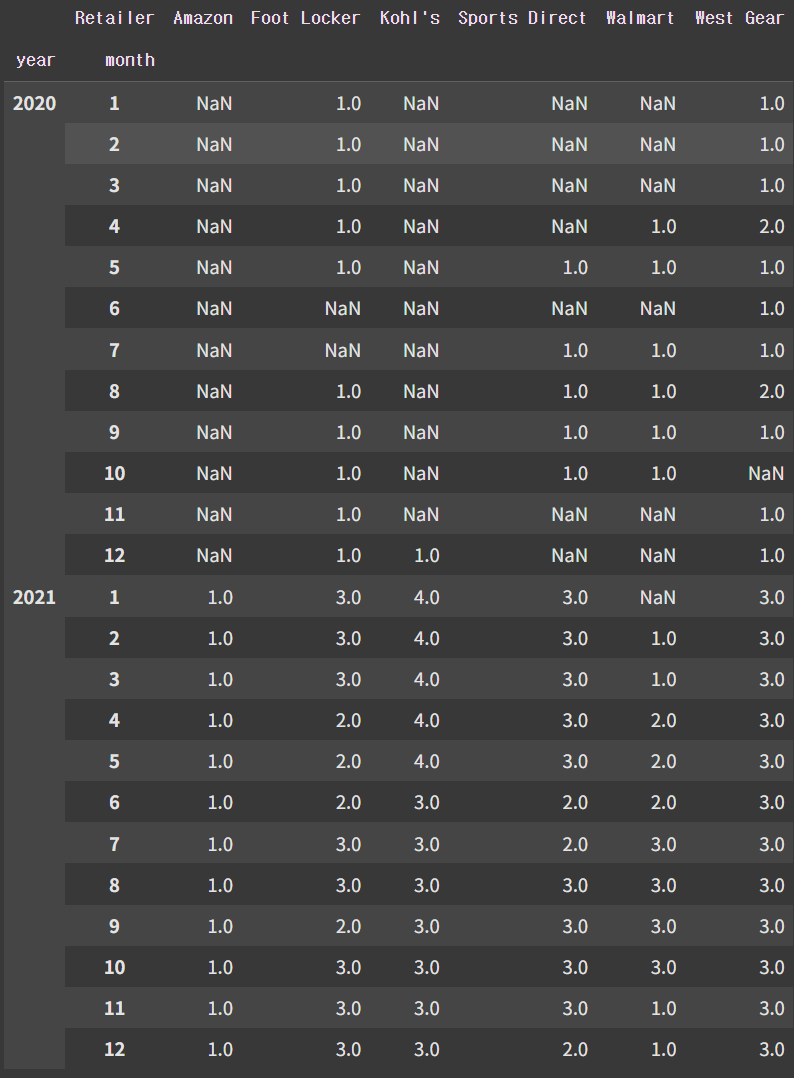
adidas.pivot_table(index=['year', 'month'], columns='Retailer', values='Units Sold', aggfunc='sum')
시각화
adidas.pivot_table(index=['year', 'month'], columns='Retailer', values='Units Sold', aggfunc='sum').plot.line()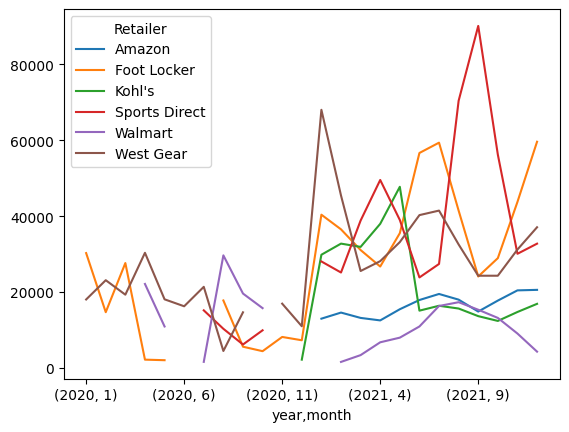
전체적인 판매량이 증가했다.
판매하지 않았던 Amazon, Kohl's의 판매 시작이거나 판매가 0이거나
그런데 Amazon 판매량이 0이게 현실적으로 말이 안된다
그래서 판매 시작이 더 가능성이 높다
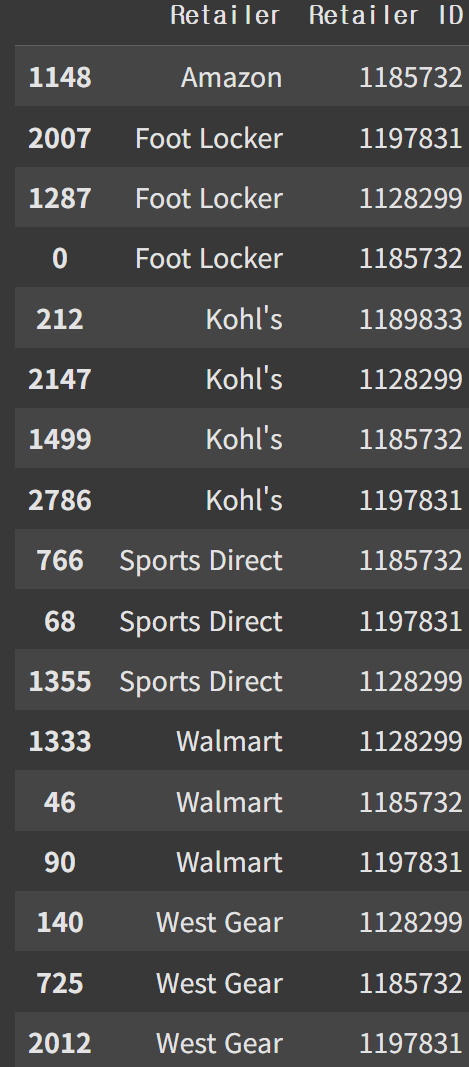
소매브랜드 안에도 여러개가 있다
adidas[['Retailer', 'Retailer ID']].drop_duplicates().sort_values('Retailer') # 중복을 제거하고 Retailer 이름 순서로 정렬
매장의 수가 늘었는지 의문 -> 월별 상점의 숫자는 어떻게 될까
ex) 2020년에는 상점 수가 1개엿는데 2021년에는 3개로 늘지 않았을까?
df.pivot_table(index=['year', 'month'], values='Retailer ID', aggfunc='count') # 소매별 개수
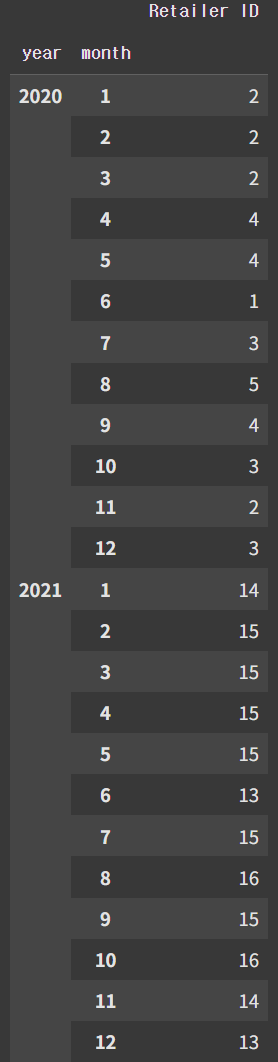
실제로 매장의 개수도 많이 늘었다
시각화
df.pivot_table(index=['year', 'month'], values='Retailer ID', aggfunc='count').plot(kind='line')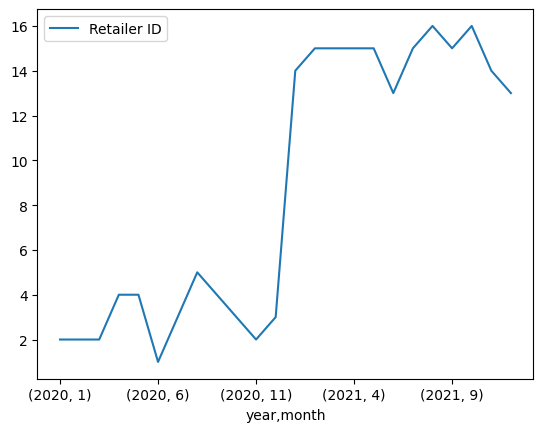
라인그래프
df.pivot_table(index=['year', 'month'], columns='Retailer', values='Retailer ID', aggfunc='count') # columns만 추가
누적그래프
df.pivot_table(index=['year', 'month'], columns='Retailer', values='Retailer ID', aggfunc='count').plot(kind='area', figsize=(20,7))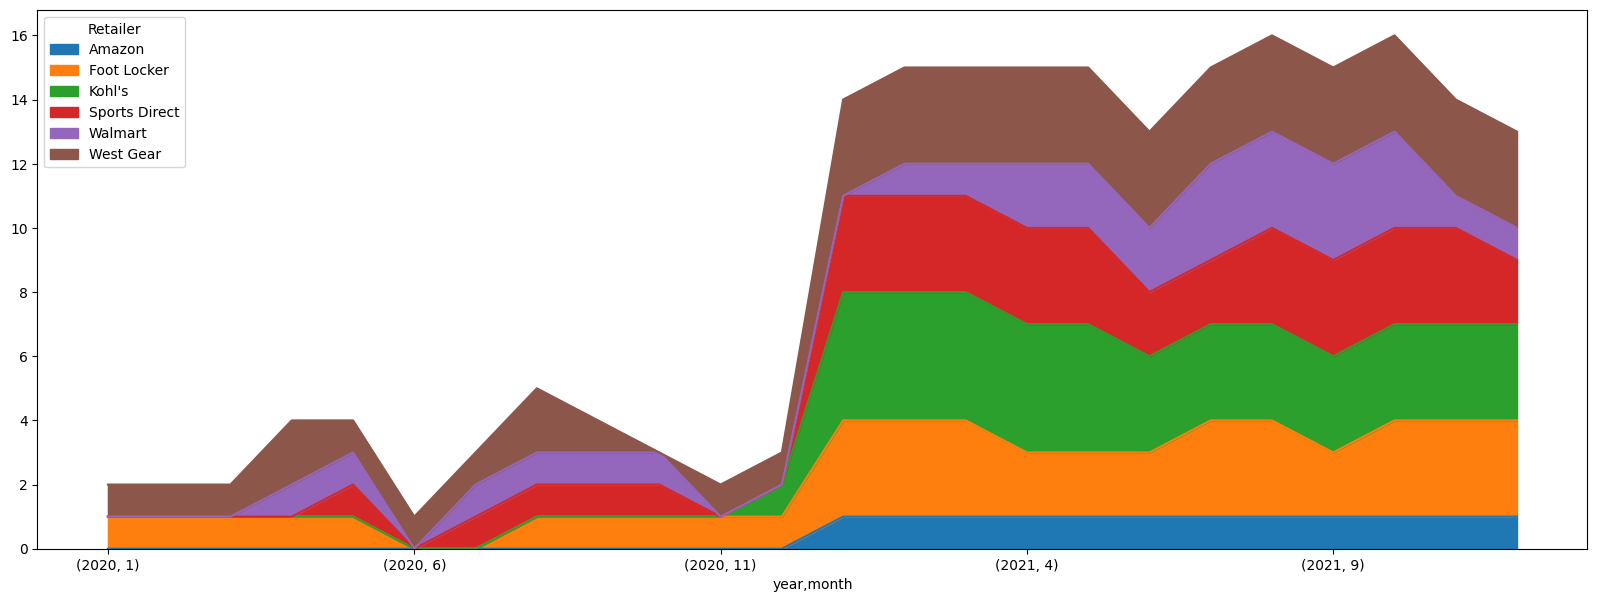
다른 원인
아디다스는 2020년 코로나로 인해 매출액이 하락했다가 2021년에 회복세였음
