Map-Projection 맵 프로젝션
📌 맵 프로젝션 (Map-Projection)
: 지구와 같은 3차원 형태의 표면을 2차원 평면(지도)으로 표현하는 방법
-
지구는 구형이기 때문에, 이를 평면에 정확하게 표현하는 것은 불가능.
-
지구 표면을 2D로 표현하는데 지구는 3D이기 때문에 이 과정에서 '맵 프로젝션'을 사용한다.
-
모든 맵 프로젝션은 일정한 정도의 왜곡을 포함
-
왜곡은 크게 세 가지 주요 속성인 면적, 형태, 방향 중 어느 것을 보존할지에 따라 달라짐
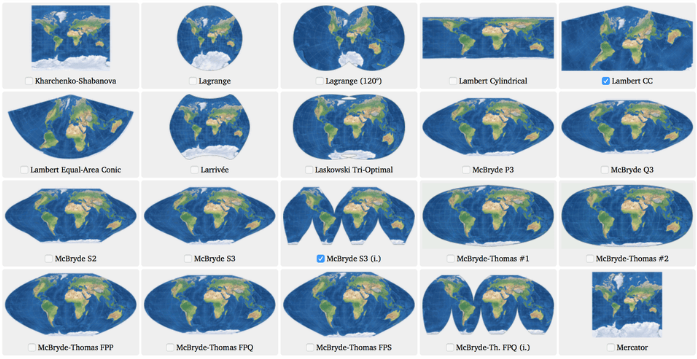
(이미지 출처 - List of map projections (Source))
Setting the CRS
coordinate reference system (CRS) 좌표 참조 시스템
📌 좌표 참조 시스템(Coordinate Reference System, CRS)
: 지구상의 위치를 좌표로 표현하는 데 사용되는 시스템. 지리적 위치를 정의하는 데 필요한 수학적, 지리적 정보를 제공. 지구라는 곡면을 2차원 데이터(평면)로 표현하는 방법론
자주 사용되는 좌표계
-
WGS84(EPSG:4326): GPS가 사용하는 좌표계(경도와 위도)
-
Bessel 1841(EPSG:4004): 한국과 일본에 잘 맞는 지역타원체를 사용한 좌표계
-
GRS80 UTM-K(EPSG:5179): 한반도 전체를 하나의 좌표계로 나타낼 때 많이 사용하는 좌표계. 네이버 지도
-
GRS80 중부원점(EPSG:5181): 과거 지리원 좌표계에서 타원체 문제를 수정한 좌표계. 다음카카오 지도
-
Web mercator projection(Pseudo-Mercator, EPSG:3857) : 구글지도/빙지도/야후지도/OSM 등 에서 사용중인 좌표계
-
Albers projection(EPSG:9822) : 미국 지질 조사국에서 사용하는 좌표계
CRS 설정 과정
- DataFrame 생성
- GeoDataFrame으로 변환
gpd.points_from_xy()로 Point객체 생성
# (1. df를 생성하기) Create a DataFrame with health facilities in Ghana
facilities_df = pd.read_csv("../input/geospa


'tial-learn-course-data/ghana/ghana/health_facilities.csv")

# (2. GeoDataFrame으로 변환) Convert the DataFrame to a GeoDataFrame
facilities = gpd.GeoDataFrame(facilities_df, geometry=gpd.points_from_xy(facilities_df.Longitude, facilities_df.Latitude))

#(3.Point 객체를 생성) Set the coordinate reference system (CRS) to EPSG 4326
facilities.crs = {'init': 'epsg:4326'}

# View the first five rows of the GeoDataFrame
facilities.head()
1. DataFrame 생성
import geopandas as gpd
import pandas as pd- shapefile의 GeoDataFrame에서는, CRS가 이미 import되어 있다
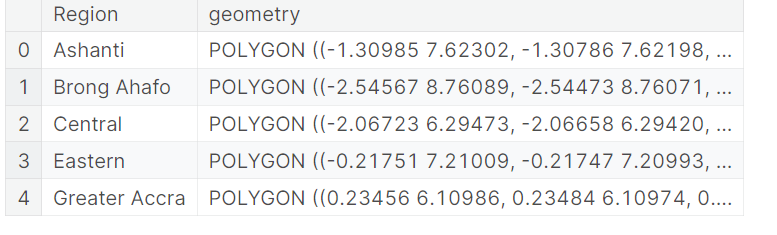
# Load a GeoDataFrame containing regions in Ghana
regions = gpd.read_file("../input/geospatial-learn-course-data/ghana/ghana/Regions/Map_of_Regions_in_Ghana.shp")
print(regions.crs)- European Petroleum Survey Group (EPSG) 코드는 좌표 참조 시스템(Coordinate Reference System, CRS)을 식별하는 데 있어서 광범위하게 사용되는 표준 중 하나이다.
- EPSG 32630("Mercator" projection)은 가장 흔한 투영법이다.
- CRS는 European Petroleum Survey Group (EPSG) 를 참조하여 만들어 진다.
# (1. df를 생성하기) Create a DataFrame with health facilities in Ghana
facilities_df = pd.read_csv("../input/geospa


'tial-learn-course-data/ghana/ghana/health_facilities.csv")- 본 데이터에는 EPSG 4326으로 위도 경도를 나타낸다.
- CSV 파일의 GeoDataFrame을 생성할때, CRS를 설정해줘야 한다.
2. GeoDataFrame으로 변환
# (2. GeoDataFrame으로 변환) Convert the DataFrame to a GeoDataFrame
facilities = gpd.GeoDataFrame(facilities_df, geometry=gpd.points_from_xy(facilities_df.Longitude, facilities_df.Latitude))
3. Point 객체를 생성
#(3.Point 객체를 생성) Set the coordinate reference system (CRS) to EPSG 4326
facilities.crs = {'init': 'epsg:4326'}

# View the first five rows of the GeoDataFrame
facilities.head()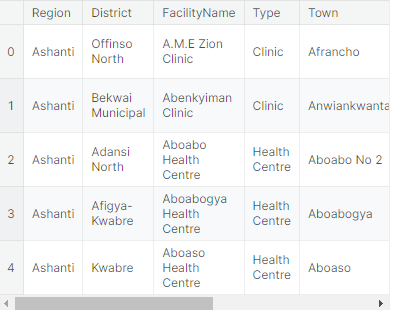
- GeoPandas는 위도, 경도 열이 있는 DataFrame을 생성한다.
- GeoDataFrame으로 변환하기 위해서
gpd.GeoDataFrame()를 사용한다. gpd.points_from_xy()를 통해 위 경도 칼럼으로 부터 Point 객체를 생성할 수 있다
Re-projecting
📌 Re-projecting
: 지리 데이터의 좌표 참조 시스템(Coordinate Reference System, CRS)을 변경하는 것을 의미.
서로 다른 CRS 를 가진 데이터를 사용하거나, 지리적 분석을 할때 특정 CRS가 더 적합한 경우 사용.
to_crs를 사용하여 CRS 변경- 여러 GeoPands를 작성할 때, 동일한 CRS를 사용하는 것이 좋음
# Create a map
ax = regions.plot(figsize=(8,8), color='whitesmoke', linestyle=':', edgecolor='black')
facilities.to_crs(epsg=32630).plot(markersize=1, ax=ax)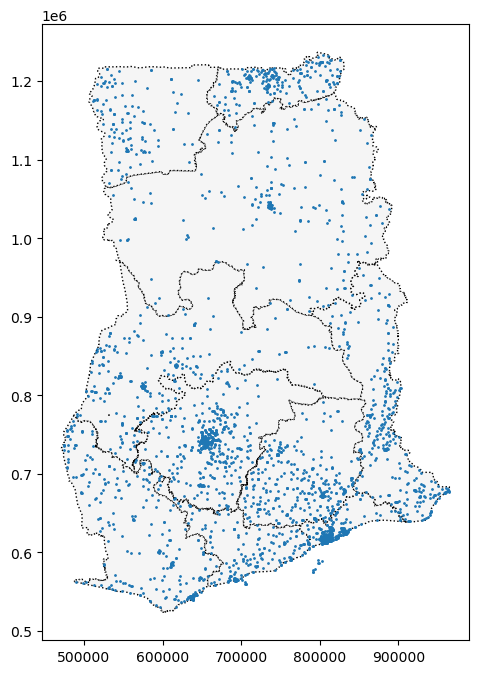
- to_crs는 geometry칼럼에만 적용된다. 다른 칼럼들은 그대로 데이터를 유지한다.
# The "Latitude" and "Longitude" columns are unchanged
facilities.to_crs(epsg=32630).head()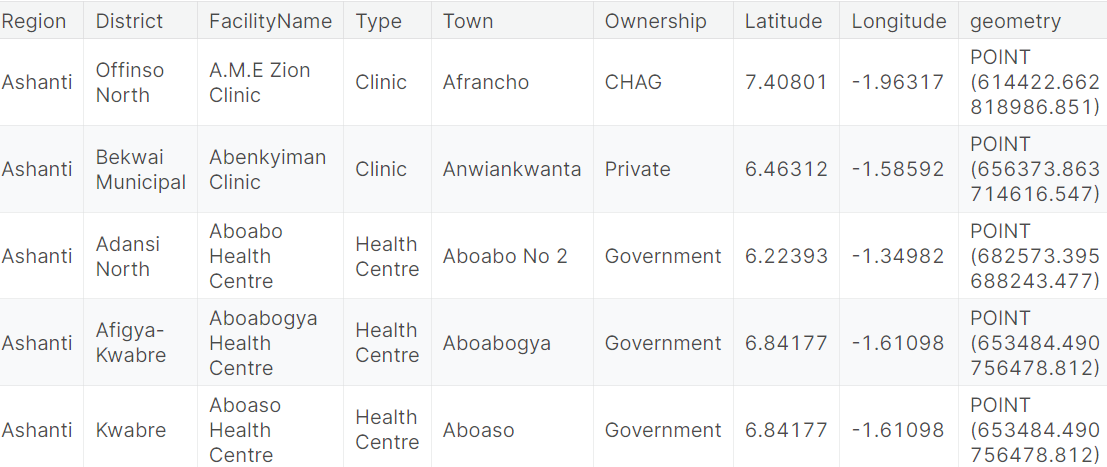
-
CRS를 변경할 수 없는 경우,
proj4 string을 사용하여 CRS로 변경할 수 있다.📌 proj4 string
:
Proj4 문자열(Proj4 string)은 좌표 참조 시스템(Coordinate Reference System, CRS)을 정의하는 데 사용되는 텍스트 형식의 문자열. -
proj4 string 기본 문법
+proj=<프로젝션> +datum=<데이터> +ellps=<타원체> +units=<단위> +zone=<존> +no_defs
-
+proj=<프로젝션>: 지도 투영법(Projection)을 지정합니다. 메르카토르 투영법인 경우 "+proj=merc"와 같이 지정할 수 있습니다.
-
+datum=<데이터>: 데이터 변환에 사용할 데이터 타입이나 기준을 나타냅니다. 예를 들어, "+datum=WGS84"는 WGS 84 데이터를 사용한다는 것을 나타냅니다.
-
+ellps=<타원체>: 사용할 타원체를 정의합니다. 예를 들어, "+ellps=WGS84"는 WGS 84 타원체를 사용한다는 것을 나타냅니다.
-
+units=<단위>: 좌표값의 단위를 지정합니다. "+units=m"은 미터 단위를 사용한다는 것을 나타냅니다.
-
+zone=<존>: 적용 가능한 경우, 좌표 시스템의 존을 지정합니다.
-
+no_defs: 사용자 정의 정의 파일을 사용하지 않음을 나타냅니다.
# Change the CRS to EPSG 4326
regions.to_crs("+proj=longlat +ellps=WGS84 +datum=WGS84 +no_defs").head()
Attributes of geometric objects
- geometry 칼럼은 사용자가 표시하고자 하는 방식에 따라 달라진다.
- point, line, polygon
# Get the x-coordinate of each point
facilities.geometry.head().x
- Line의 길이도 구할 수 있다.
# Calculate the area (in square meters) of each polygon in the GeoDataFrame
regions.loc[:, "AREA"] = regions.geometry.area / 10**6

print("Area of Ghana: {} square kilometers".format(regions.AREA.sum()))
print("CRS:", regions.crs)
regions.head()
참고
kaggle
지리 정보 데이터 처리 - 데이터 사이언스 스쿨