타이타닉 생존자 예측
- 머신러닝에서 거의 연습문제 1번같은 느낌
- 타이타닉배는 1910년대 당시 최대 여객선이고 영국에서 미국 뉴욕으로 가던 국제선
- 아래는 해당 데이터 칼럼의 의미이다.
| plcass | 객실 등급 |
|---|---|
| survived | 생존 유무 |
| sex | 성별 |
| age | 나이 |
| sibsp | 형제 혹은 부부의 수 |
| parch | 부모 혹은 자녀의 수 |
| fare | 지불한 요금 |
| boat | 탈출을 했다면 탑승한 보트의 번호 |
타이타닉 생존자분석 (EDA)
import pandas as pd
import matplotlib.pyplot as plt
import seaborn as sns
tatanic = pd.read_excel('./data/titanic.xls')
tatanic.head()

# 생존자 비율의 파이그래프, autopic : 숫자를 보여줌, shoadow : 그림자, explode : 구분되게 조금 띄어놓음

# 1행에 2열 생성, ax는 subplot에서 반환받은거
f ,ax = plt.subplots(1, 2, figsize=(16, 8))
tatanic['survived'].value_counts().plot.pie(ax=ax[0], autopct='%1.1f%%', shadow=True, explode =[0, 0.05]);
ax[0].set_title('Pie plot - survived')
ax[0].set_ylabel('')

sns.countplot(x='survived', data=titanic, ax=ax[1])
ax[1].set_title('Count plot - survived')
plt.show()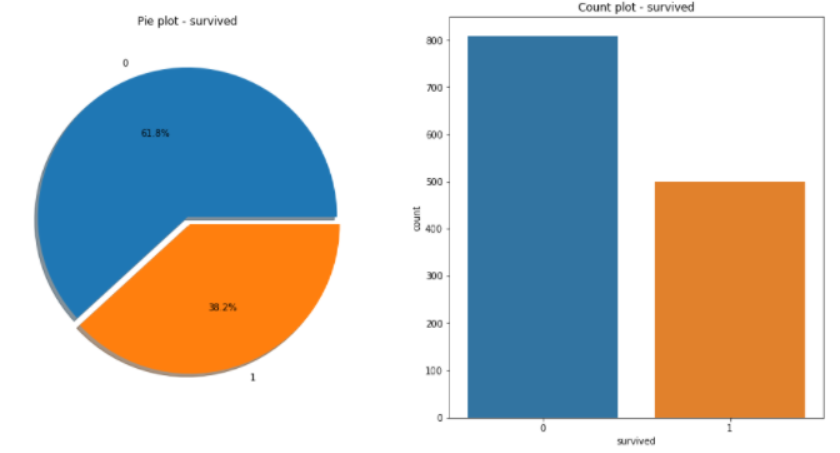
- 성별에 따른 생존 현황
f ,ax = plt.subplots(1, 2, figsize=(16, 8))
sns.countplot(x='sex', data=titanic, ax=ax[0])
ax[0].set_title('Count of passengers of sex')
ax[0].set_ylabel('')

sns.countplot(x='sex', data=titanic,hue='survived', ax=ax[1])
ax[1].set_title('Sex : Survived and Unservived')
plt.show()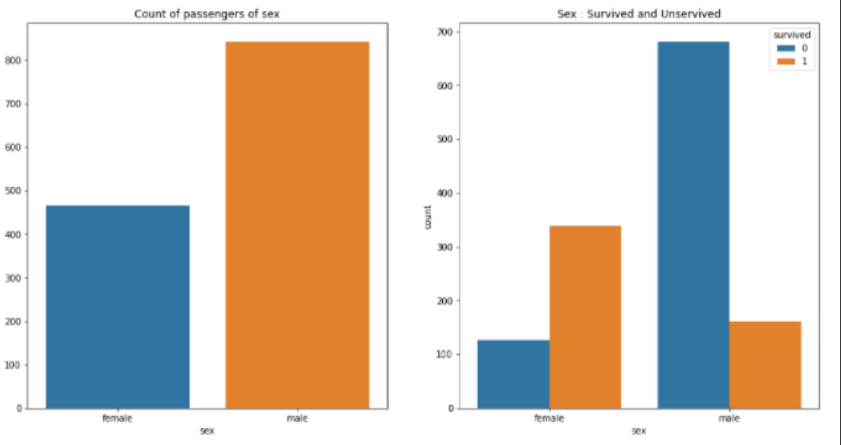
- 남성의 생존 가능성이 더 낮음, 거의 1/4만 살아남음
# 경제력 대비 생존률
# crosstab : 첫 번째는 인덱스, 두번째는 컬럼으로 생성해줌, margins: 합계
pd.crosstab(titanic['pclass'], titanic['survived'], margins=True)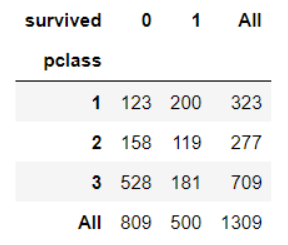
-
1등실의 생존률이 다른 두군데보다 매우 높음
-
그럼 1등실에는 여성이 많이 타고 있나?
grid = sns.FacetGrid(titanic, row='pclass', col='sex', heigt=3, aspect =1)
grid.map(plt.his, 'age', alpha=0.8, bins=20)
grid.add_legend()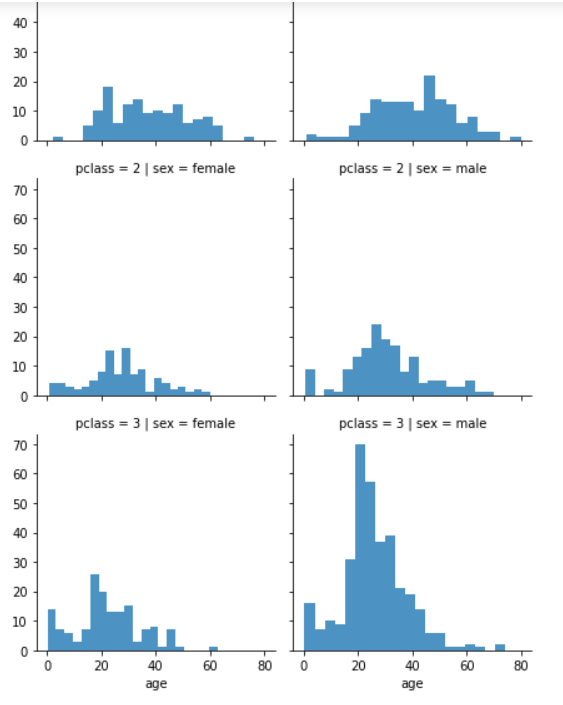
- 3등실에 남성이 많았음, 특히 20대
- 나이별 승객 현황 확인
import plotly.express as px
fig = px.histogram(titanic, x='age')
fig.show()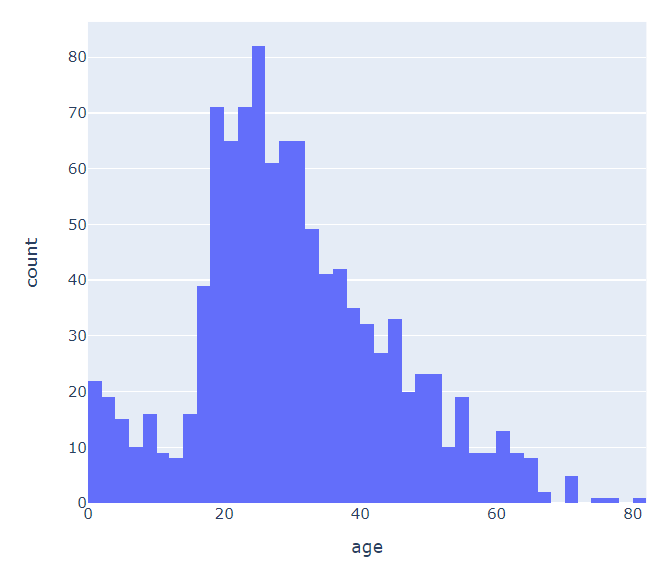
- 등실별 생존률 확인
grid = sns.FacetGrid(titanic, row='pclass', col='survived', height=3, aspect=1)
grid.map(plt.his, 'age', alpha=0.5, bins=20)
gird.add_legend();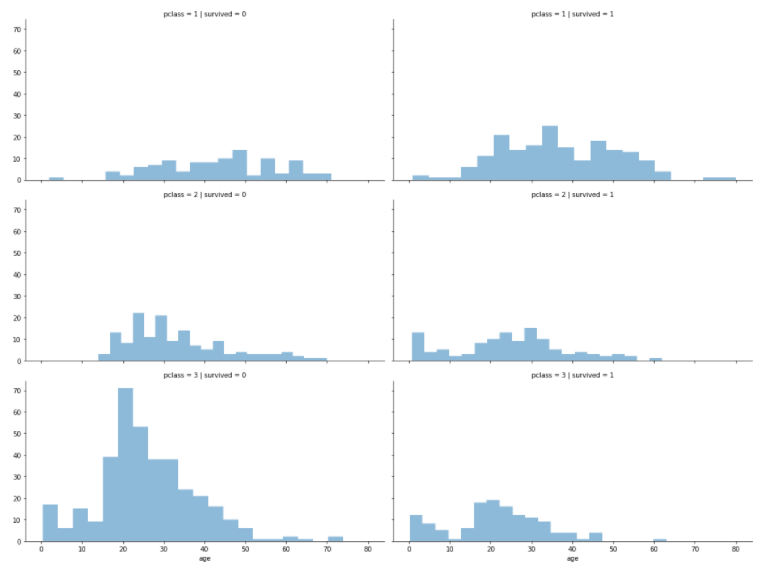
- 선실 등급이 높으면 생존률이 높은 경향을 보인다
- 나이를 5단계로 정리하기
titanicp['age_catg'] = pd.cut(titanic['age'], bins=[0, 7, 15, 30, 60, 100],
                             include_lowest=True,
labels = ['baby', 'teen', 'young', 'adult', 'old'])- 나이, 성별, 등급별 생존자 수를 한번에 파악 하기
plt.figure(figsize=(12, 4))
plt.subplot(131)
sns.barplot('pclass', 'survived', data=titanic)
plt.subplot(132)
sns.barplot('age_catg', 'survived', data=titanic)
plt.subplot(133)
sns.barplot('sex', 'survived', data=titanic)
# 신뢰구간
plt.subplots_adjus(top=1, bottom=0.1, left=0.1, right=1, hspace=0.5, wspace=0.5)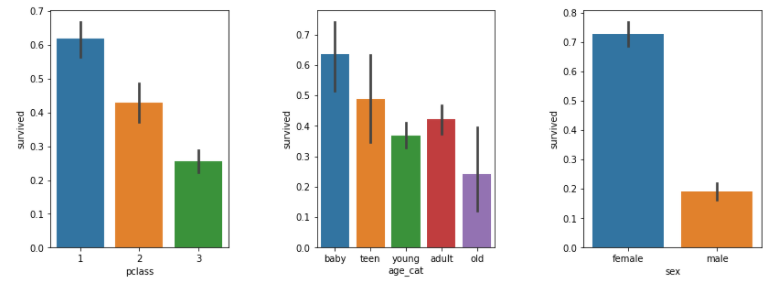
- 과연 어리고 여성이고 1등실일수록 생존하기 유리했을까?
- 남/여 나이별 생존 상황을 살펴보자
fig, axes = flt.subplots(nrows=1, ncols=2, figsize=(14, 6))

women = titanic[titanic['sex']=='female']
men = titanic[titanic['sex']=='men']

# bins가 다를 때 높이가 다르다고 다른거 아님, 구간에 맞춰서 합해야함
ax = sns.distplot(women[women['survived']==1]['age'], bins=20,label='survived', ax=axes[0], kde=False)
ax = sns.distplot(women[women['survived']==0]['age'], bins=40, label='not survived', ax=axes[0], kde=False)
ax.legend(); ax.set_title('Female')

ax = sns.distplot(men[men['survived']==1]['age'], bins=18, label='survived', ax=axes[1], kde=False)
ax = sns.distplot(men[men['survived']==0]['age'], bins=40, label='not survived', ax=axes[1], kde=False)
ax.legend(); ax.set_title('Male')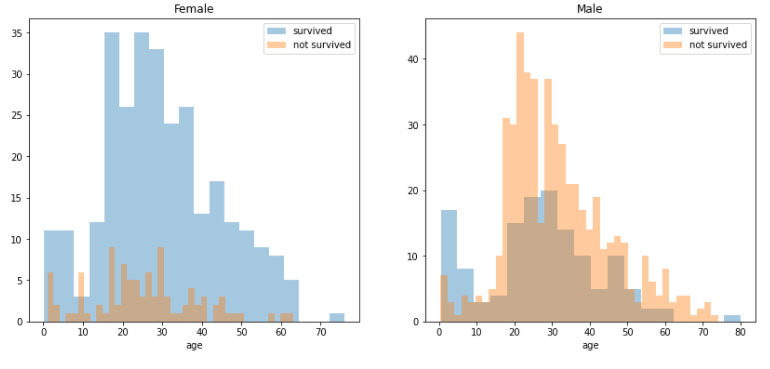
- 계급층에 따라 알아보자!
import re
title = []
for idx, dataset in tatanic.itterrowsd():
    tmp = dataset['name']
    title.append(re.search("\,\s\w+(\s\w+)?\.", tmp).group()[2:-1])
    # ,로 시작하고 한칸띄우고 어떤 글자들이 나오다가 단어가 몇개일지는 모르고 .로 마침
titanic['title'] = title

pd.crosstab(titanic['title'], titanic['sex'])

# 계급이 여러개라 이름을 합침, MLLe, Ms, Mme는 Miss랑 똑같은거라 이름 바꿈
titanic['title'] = titanic['title'].replace('Mlle', 'Miss')
titanic['title'] = titanic['title'].replace('Ms', 'Miss')
titanic['title'] = titanic['title'].replace('Mme', 'Miss')
Rare_f = ['Dona', 'Lady', 'the Countess']
Rare_m = ['Capt', 'Col', 'Don', 'Major', 'Rev', 'Sir', 'Dr', 'Master', 'Jonkheer']

for each in Rare_f:
    titanic['title'] = titanic['title'].replace(each, 'Rare_f')
for each in Rare_m:
    titanic['title'] = titanic['title'].replace(each, 'Rare_m')

titanic[['title', 'survived']].groupby(['title'], as_index=False).mean()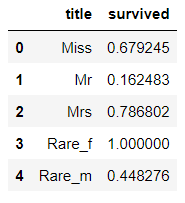
- 평민남성 -> 귀족남성 -> 평민여성 -> 귀족여성 순으로 생존률이 높음
머신 러닝을 이용한 생존자 예측
- 머신러닝을 하려면 데이터가 숫자여야한다, 그러나 성별이 숫자가 아님 -> 변경필요
from sklearn.preprocessing import LabelEncoder
le = LabelEncoder()
le.fit(titanic['sex'])
# le.classes_ 하면 클래스 나옴
titanic['gender'] = le.transfor(titanic['sex'])
# 결측치는 그냥 패쓰
titanic = titanic[titanic['age'].notnull()]
titanic = titanic[titanic['fare'].notnull()]
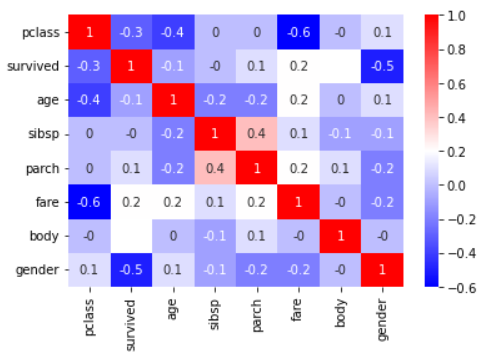
# 상관관계
correlation_matrix = titanic.corr().round(1)
sns.heatmap(data=correlation_matrix, annot=True, cmap='bwr')
titanic.columns

from sklearn.model_selection import train_test_split

x = titanic[['pclass', 'age', 'sibsp', 'parch', 'fare', 'gender']]
y = titanic[['survived']]
X_train, X_test, y_train, y_test = train_test_split(x, y, test_size=0.8, random_state=42)

from sklearn.tree import DecisionTreeClassifier
from sklearn.metrics import accuracy_score

dt = DecisionTreeClassifier(max_depth=4, random_state=42)
dt.fit(X_train, y_train)
pred = dt.predict(X_test)
print(accuracy_score(y_test, pred))

# 디카프리오와 윈슬릿의 생존가능 확률은?

import numpy as np
# 클래스 : [['pclass', "age", 'sibsp', 'parch', 'fare', 'gender']]
dicaprio = np.array([3, 18, 0, 0, 5, 1])
print('Dicaprio :', dt.predict_proba(dicaprio)[0][1])

# 윈슬릿은?
winslet = np.array([[1, 16, 1, 1, 100, 0]])
print('Winslet :', dt.predict_proba(winslet)[0][1])
윈슬릿은 100% !
