훈련 데이터 변형 및 데이터 리사이즈
코드
data_transforms = {

    #훈련데이터
    'train': transforms.Compose([  # 이미지 변형시키기 여러가지 옵션들이 많으니 검색해서 원하는 옵션을 적용!
       transforms.Resize((224, 224)), # 224,224 사이즈로 이미지를 리사이즈 한다.
       transforms.RandomCrop(150), # 랜덤으로 자름
       transforms.ColorJitter(brightness=0.2, contrast=0.2, saturation=0.2, hue=0.2), # 색 변조
        transforms.RandomHorizontalFlip(p = 1), # 수평으로 이미지 뒤집기
        transforms.ToTensor(), # 이미지 데이터를 tensor로 바꿔준다.
        transforms.Normalize([0.485, 0.456, 0.406], [0.229, 0.224, 0.225]) # 이미지 정규화
    ]),
    #검증데이터
    'val': transforms.Compose([
        transforms.Resize((224, 224)), # 이미지 사이즈를 resize로 변경한다.
        #transforms.CenterCrop(200), # 이미지 중앙을 resize × resize로 자른다
        transforms.ToTensor(), # 이미지 데이터를 tensor로 바꿔준다.
        transforms.Normalize([0.485, 0.456, 0.406], [0.229, 0.224, 0.225]) # 이미지 정규화

    ]),
	#테스트데이터
    'test': transforms.Compose([
        transforms.Resize((224, 224)), # 이미지 사이즈를 resize로 변경한다.
        #transforms.CenterCrop(200), # 이미지 중앙을 resize × resize로 자른다
        transforms.ToTensor(), # 이미지 데이터를 tensor로 바꿔준다.
        transforms.Normalize([0.485, 0.456, 0.406], [0.229, 0.224, 0.225]) # 이미지 정규화

    ]),


}

data_dir = '/content/drive/MyDrive/CARC' # train, val, test 경로설정

image_datasets = {x: datasets.ImageFolder(os.path.join(data_dir, x), # 설정한 경로에서 이미지를 가져오고 리사이즈에서 데이터저장
                                          data_transforms[x])
                  for x in ['train', 'val','test']}
dataloaders = {x: torch.utils.data.DataLoader(image_datasets[x], batch_size=32, # 배치사이즈 32
                                             shuffle=True, num_workers=2)
              for x in ['train', 'val', 'test']}
dataset_sizes = {x: len(image_datasets[x]) for x in ['train', 'val']}
class_names = image_datasets['train'].classes

device = torch.device("cuda:0" if torch.cuda.is_available() else "cpu") # gpu사용불가면 cpu를 사용.
훈련데이터는 이미지들을 변형시켜서 데이터양을 늘리고 리사이즈를 한다.
검증데이터와 테스트 데이터는 이미지 변형을 시키지 않고 리사이즈만 한다.
def imshow(inp, title=None): # 사용할 이미지의 일부를 보여줌(train)
    """Imshow for Tensor."""
    inp = inp.numpy().transpose((1, 2, 0))
    mean = np.array([0.485, 0.456, 0.406])
    std = np.array([0.229, 0.224, 0.225])
    inp = std * inp + mean
    inp = np.clip(inp, 0, 1)
    plt.imshow(inp)
    if title is not None:
        plt.title(title)
    plt.pause(0.001)

inputs, classes = next(iter(dataloaders['train'])) # 학습 데이터의 배치를 얻습니다.
out = torchvision.utils.make_grid(inputs) # 배치로부터 격자 형태의 이미지를 만듭니다.

imshow(out, title=[class_names[x] for x in classes]) # 이미지 보여주기
결과

사전학습 모델 불러오기
tochvision models 에서 regnet 불러오기
# models 사용가능 모델들 : https://pytorch.org/vision/stable/models.html 참고
model = models.regnet_x_32gf(pretrained=True) #이미 학습된 모델 불러온다.
print(model) #모델 구조 출력
불러온 모델의 출력층을 보면 1000개의 클래스가 출력이 된다.
model.fc=nn.Linear(in_features=2520, out_features=6) # 마지막 출력층을 나의 class 수에 맞춰서 바꿔준다.
print(model) # 바뀐모델 구조 출력

model = model.to(device) # 모델을 gpu로
criterion = nn.CrossEntropyLoss() # 손실함수(loss function) 크로스 엔트로피 사용
불러온 모델은 원래 1000가지의 다른 훈련데이터로
학습한 모델이라 출력 클래스가 1000개 이다.
전이학습을 위해 마지막 출력층을
내가 원하는 클래스 개수로 맞춰준다. 나는 6개 라서 out_features를 6으로 맞췄다.
그렇다면 out_features가 6으로 바뀐다.

옵티마이저 정의 및 훈련
# 최적화 기법 설정
optimizer = optim.SGD(model.parameters(), lr=0.001, momentum=0.9)
# optimizer sgd로 설정, 학습률 0.001

# 모델구조를 요약 해서 보여주는데 굳이 안해도 되는부분
#from torchsummary import summary
#summary(model, input_size=(3, 224, 224))
# training 함수 정의
def train_model(model, criterion, optimizer, num_epochs=50):
    since = time.time()

    best_model_wts = copy.deepcopy(model.state_dict())
    best_acc = 0.0
    train_loss, train_acc, valid_loss, valid_acc = [], [], [], []

    for epoch in range(num_epochs):
        print('Epoch {}/{}'.format(epoch, num_epochs - 1))
        print('-' * 10)

        # Each epoch has a training and validation phase
        for phase in ['train', 'val']:
            if phase == 'train':
                model.train()  # Set model to training mode
            else:
                model.eval()   # Set model to evaluate mode

            running_loss, running_corrects, num_cnt = 0.0, 0, 0

            # Iterate over data.
            for inputs, labels in dataloaders[phase]:
                inputs = inputs.to(device)
                labels = labels.to(device)

                # zero the parameter gradients
                optimizer.zero_grad()

                # forward
                # track history if only in train
                with torch.set_grad_enabled(phase == 'train'):
                    outputs = model(inputs)
                    _, preds = torch.max(outputs, 1)
                    loss = criterion(outputs, labels)

                    # backward + optimize only if in training phase
                    if phase == 'train':
                        loss.backward()
                        optimizer.step()

                # statistics
                running_loss += loss.item() * inputs.size(0)
                running_corrects += torch.sum(preds == labels.data)
                num_cnt += len(labels)
           # if phase == 'train':
            #    scheduler.step()

            epoch_loss = float(running_loss / num_cnt)
            epoch_acc  = float((running_corrects.double() / num_cnt).cpu()*100)

            if phase == 'train':
                train_loss.append(epoch_loss)
                train_acc.append(epoch_acc)
            else:
                valid_loss.append(epoch_loss)
                valid_acc.append(epoch_acc)
            print('{} Loss: {:.4f} Acc: {:.4f}'.format(phase, epoch_loss, epoch_acc))

            # deep copy the model
            if phase == 'val' and epoch_acc > best_acc:
                best_idx = epoch
                best_acc = epoch_acc
                best_model_wts = copy.deepcopy(model.state_dict())
#                 best_model_wts = copy.deepcopy(model.module.state_dict())
                print('==> best model saved - %d / %.1f'%(best_idx, best_acc))

    time_elapsed = time.time() - since
    print('Training complete in {:.0f}m {:.0f}s'.format(time_elapsed // 60, time_elapsed % 60))
    print('Best valid Acc: %d - %.1f' %(best_idx, best_acc))

    # load best model weights
    model.load_state_dict(best_model_wts) # accuracy best model 을 저장 한다.
    torch.save(model.state_dict(), '/content/drive/MyDrive/MODELS/non_reg1_2.pt') # 모델을 저장할 자신의 경로 설정
    print('model saved')
    return model, best_idx, best_acc, train_loss, train_acc, valid_loss, valid_acc
# epoch을 100으로 설정하고 학습시킨다. 시간이 꽤 걸린다.
model, best_idx, best_acc, train_loss, train_acc, valid_loss, valid_acc = train_model(model, criterion, optimizer,num_epochs=100)
모델 학습경과 시각화
코드
# 모델 시각화 train, val 의 accuracy , loss 시각화
print('best model : %d - %1.f / %.1f'%(best_idx, valid_acc[best_idx], valid_loss[best_idx]))
fig, ax1 = plt.subplots()

ax1.plot(train_acc, 'b-')
ax1.plot(valid_acc, 'r-')
plt.plot(best_idx, valid_acc[best_idx], 'ro')
ax1.set_xlabel('epoch')
# Make the y-axis label, ticks and tick labels match the line color.
ax1.set_ylabel('acc', color='k')
ax1.tick_params('y', colors='k')

ax2 = ax1.twinx()
ax2.plot(train_loss, 'g-')
ax2.plot(valid_loss, 'k-')
plt.plot(best_idx, valid_loss[best_idx], 'ro')
ax2.set_ylabel('loss', color='k')
ax2.tick_params('y', colors='k')

fig.tight_layout()
plt.show()
결과

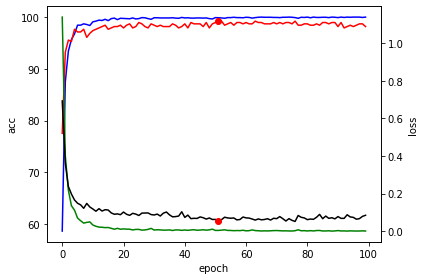
위 코드를 실행 하면 학습 과정을 시각화 해서 볼 수 있다. 내가 학습 시켰을때
가장 베스트 모델은 epoch 51 : acuracy 99% : val_loss =0.1 이다.
어느정도 학습하다보면 성능 향상이 없는부분이 있을 수 있는데 그러면 EarlyStopping을 사용하던지 하면 시간을 아낄 수 있고 과적합도 막을 수 있다.
전이학습모델 추론
검증데이터 추론 시각화
def visualize_model(model, num_images=6): # val 일부이미지에대한 예측값을 보여주는 함수
    was_training = model.training
    model.eval() # 모델을 검증모드로
    images_so_far = 0
    fig = plt.figure() #figure를 만들고 편집 할 수 있게 만들어주는 함수

    with torch.no_grad():
        for i, (inputs, labels) in enumerate(dataloaders['val']):
            inputs = inputs.to(device)
            labels = labels.to(device)

            outputs = model(inputs)
            _, preds = torch.max(outputs, 1)

            for j in range(inputs.size()[0]):
                images_so_far += 1
                ax = plt.subplot(num_images//2, 2, images_so_far)
                ax.axis('off')
                ax.set_title('predicted: {}'.format(class_names[preds[j]])) # 가장 높은확률의 이름 출력
                imshow(inputs.cpu().data[j]) # 예측하려고 입력된 이미지 보여주기

                if images_so_far == num_images:
                    model.train(mode=was_training)
                    return
        model.train(mode=was_training)
for x in range(3):
visualize_model(model) # val 이미지 모델 예측값 시각화
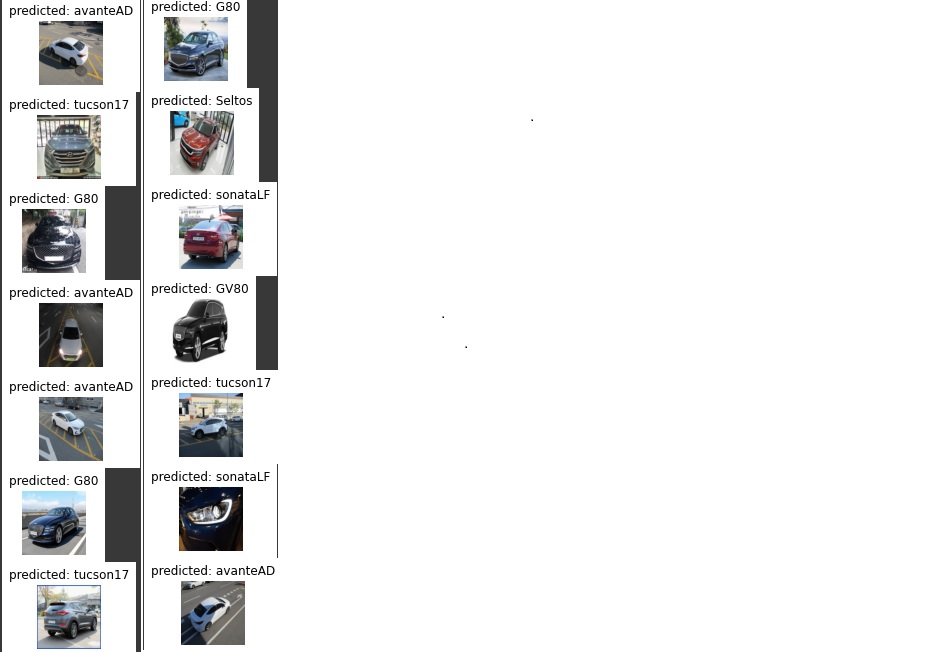
학습한 모델로 검증데이터 들을 추론해본다. 대부분 거의 다 일치한다.
아래 코드는 위에 코드와 같다. test 데이터에 대한 추론을 하는것이당
 def test_visualize_model(model, num_images=4): # test 일부 이미지에대한 예측값을 보여주는 함수
    was_training = model.training
    model.eval() # 모델을 검증모드로
    images_so_far = 0
    fig = plt.figure() #figure를 만들고 편집 할 수 있게 만들어주는 함수

    with torch.no_grad():
        for i, (inputs, labels) in enumerate(dataloaders['test']):
            inputs = inputs.to(device)
            labels = labels.to(device)

            outputs = model(inputs)
            _, preds = torch.max(outputs, 1)

            for j in range(inputs.size()[0]):
                images_so_far += 1
                ax = plt.subplot(num_images//2, 2, images_so_far)
                ax.axis('off')
                ax.set_title('predicted: {}'.format(class_names[preds[j]])) # 가장 높은확률의 이름 출력
                imshow(inputs.cpu().data[j]) # 예측하려고 입력된 이미지 보여주기

                if images_so_far == num_images:
                    model.train(mode=was_training)
                    return
        model.train(mode=was_training)
  for x in range(10): #위에 코드와 같다. test 이미지에 대한 예측값을 시각화 하기 위한 것
  test_visualize_model(model) # test 이미지 모델 예측값 시각화
Confusion Matrix 그리기
# 각 항목별 정확도 및 컨퓨전 매트릭스
from sklearn.metrics import classification_report
import matplotlib.pyplot as plt
nb_classes = 6

confusion_matrix = torch.zeros(nb_classes, nb_classes)
with torch.no_grad():
    for i, (inputs, classes) in enumerate(dataloaders['test']):
        inputs = inputs.to(device)
        classes = classes.to(device)
        outputs = model(inputs)
        _, preds = torch.max(outputs, 1)
        for t, p in zip(classes.view(-1), preds.view(-1)):
                confusion_matrix[t.long(), p.long()] += 1


print('        g80', '    gv80', '   Selots', ' avateAD', 'sonataLF', 'tucson17')
print(confusion_matrix.diag()/confusion_matrix.sum(1))

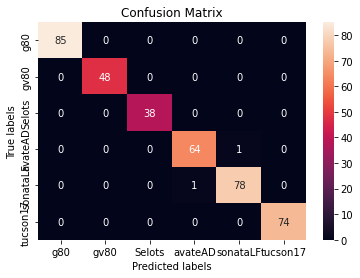
이제 학습모델이 얼마나 좋은 성능이 나오는지 각각의 카테고리
별로 얼마나 정확하게 예측 하는지에 대해서 출력해주는 코드이다.
싸이킷런 라이브러리를 사용해서 컨퓨전 매트릭스를 그려본다.
# 컨퓨전 매트릭스 heatmap 그리기
import seaborn as sns

ax= plt.subplot()
sns.heatmap(confusion_matrix, annot=True, fmt='g', ax=ax);  #annot=True to annotate cells, ftm='g' to disable scientific notation

# labels, title and ticks
ax.set_xlabel('Predicted labels');ax.set_ylabel('True labels');
ax.set_title('Confusion Matrix');
ax.xaxis.set_ticklabels(['g80', 'gv80', 'Selots', 'avateAD', 'sonataLF', 'tucson17']); ax.yaxis.set_ticklabels(['g80', 'gv80', 'Selots', 'avateAD', 'sonataLF', 'tucson17']);
컨퓨전 매트릭스를 직관적으로 볼 수 있도록 heatmap을 그려보았다.
300장이 넘는 테스트 데이터들중 거의 다 예측을하고 LF 소나타와 avanteAD 가
살짝 엇갈렸지만 대부분 예측이 맞았다ㅎㅎ
저장된 모델 불러오기
아래 코드는 번외로 저장된 모델을 불러오는 코드이다.
## 저장된 모델 경로 지정 하고 불러와서 추론
from torchvision import models
import torch

model=models.regnet_x_32gf(pretrained=False)
model.fc=nn.Linear(in_features=2520, out_features=6)

model.load_state_dict(torch.load("/content/drive/MyDrive/MODELS/non_reg1_2.pt", map_location=torch.device('cpu')))
model = model.to(device)
전체코드 및 데이터셋
전체 코드 및 데이터셋은 아래 깃허브 주소 참고!!
https://github.com/vipstard/Deeplearning
